



Table of contents
Marketing a pool building business in 2026 costs between $7,000 and $45,000 per month depending on revenue tier, market competitiveness, and growth goals. That range produces wildly different outcomes depending on channel mix and creative quality — one pool builder turned $43,513 in annual ad spend into $4.38 million in revenue, while others burn the same budget on shared leads that close at single-digit rates. Here are the statistics shaping digital marketing strategy across the pool construction industry.
Key Takeaways
- Pool builders should allocate 5–10% of gross revenue to marketing, with 7–12% recommended for aggressive scaling in competitive Sun Belt markets.
- Google Ads CPC for pool construction keywords averaged $5.81 in 2025 — up 46% year-over-year, the steepest increase in any home service category.
- The blended CPL for pool builders ranges from $55–$140 across Google LSA, with new-construction leads running $120–$280 on Google Search.
- Meta Ads deliver qualified pool leads at a $95 median CPL — roughly 60% cheaper than Google Search for install inquiries.
- Blue Tree Pools generated $4.38M revenue from $43,513 in ad spend — a 36× blended ROAS across Google and Meta channels.
- Organic SEO produces leads at $35–$75 after a 9–12 month ramp, closing at 35–50% — the lowest fully loaded cost per sale of any channel.
- SEO adoption among pool professionals jumped 7 percentage points year-over-year in the State of Pool Service 2026 survey.
- 65% of pool companies still rely on referrals as their top lead source, and 51% say referrals deliver the best quality leads.
- Email open rates for pool businesses average 24.5%, with welcome sequences hitting 42% — well above cross-industry benchmarks.
- The U.S. pool industry is worth $62 billion, with construction, maintenance, and equipment each representing a distinct marketing audience.
Pool Building Digital Marketing Benchmarks at a Glance
| Metric | Benchmark (2026) | Source |
|---|---|---|
| Monthly Marketing Budget | $7,000–$45,000 | DG Agency |
| Revenue Allocation | 5–10% of gross | Pool Marketing Pros |
| Google Ads CPC (Construction) | $7.50–$11.00 | CUFinder |
| Google Ads CPL (New Build) | $120–$280 | DG Agency |
| Google LSA CPL | $55–$140 | DG Agency |
| Meta Ads CPL (Installs) | $70–$120 | M.Wolf Media |
| Organic SEO CPL (Mo. 9–12) | $35–$75 | DG Agency |
| Email Open Rate | 24.5% | CUFinder |
| Service Contract Retention | 78% | CUFinder |
| Customer LTV (Service) | $2,400 over 3 years | CUFinder |
Paid Advertising Economics for Pool Builders
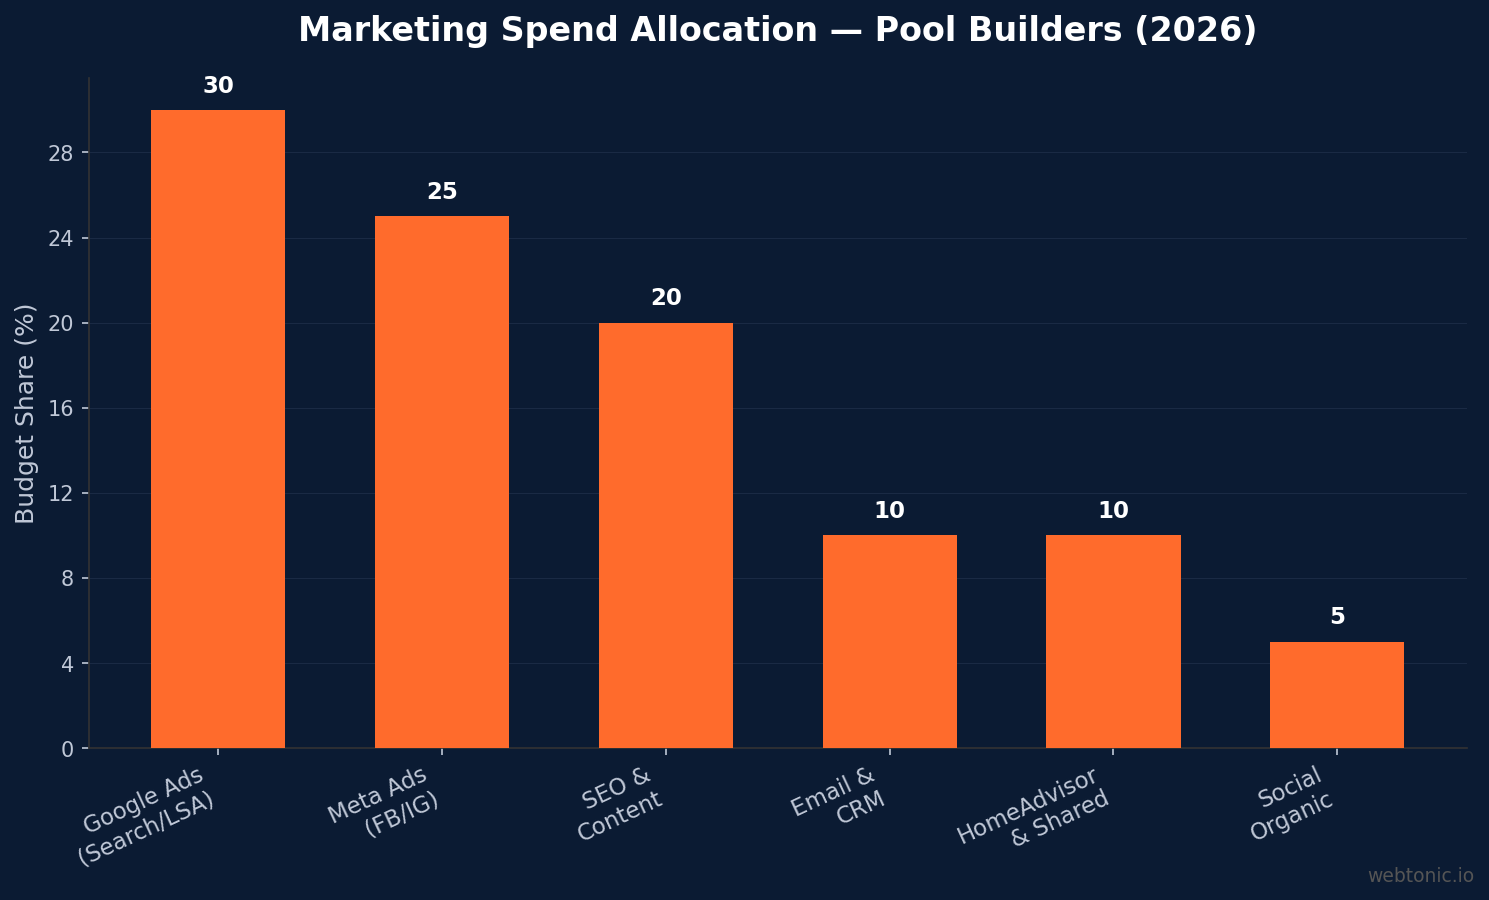
Paid channels dominate pool builder marketing budgets, but the economics vary dramatically by platform. Google Ads CPC for the pools and spas category hit $5.81 in 2025 — up 46% year-over-year according to WordStream and LocaliQ data from 3,211 U.S. campaigns, as cited by M.Wolf Media. In competitive Sun Belt markets like Phoenix, Houston, and Tampa, high-intent keywords reach $20–$30 per click.
| Channel | CPL Range | Close Rate | Best For |
|---|---|---|---|
| Google Local Service Ads | $55–$140 | 30–45% | High-intent local leads |
| Google Search Ads | $120–$280 | 30–45% | New construction inquiries |
| Meta Ads (Video) | $70–$120 | 25–35% | Demand creation, inspiration |
| HomeAdvisor / Angi | $45–$95 | 8–14% | Volume (shared leads) |
| Organic SEO (Mo. 9–12) | $35–$75 | 35–50% | Compounding long-term value |
The shared-lead model from HomeAdvisor and Angi looks inexpensive at $45–$95 per lead on paper, but each lead is sent to 3–5 competing builders simultaneously. The effective cost per signed job runs $563–$679 when factoring in the 8–14% close rate, according to Market Disruptors Agency.
SEO and Organic Growth Trends
Organic search is the single largest traffic source for pool companies, driving 42% of all U.S. pool business website visits. The channel's compounding economics make it the most efficient long-term investment: builders spending $1,500–$3,000 per month on SEO typically generate 2–8 leads in months 1–3, scaling to 25–60 leads per month by months 9–12, according to DG Agency.
Key SEO datapoints for pool builders:
- SEO adoption jumped 7 percentage points year-over-year among pool service professionals surveyed in the State of Pool Service 2026 report.
- 50% of pool builders rank for 22 keywords or fewer in Google, revealing massive untapped search opportunity.
- Organic leads close at 35–50% because the prospect found the builder by searching "pool builder [city]" — the intent is pre-qualified.
- 72% of pool builder websites lack local business schema, limiting structured data visibility in Google's local results.
- Construction and installer searches are up 16% from 2022, signaling growing demand for search-visible contractors.
Email Marketing and Retention Metrics
Pool businesses perform above average on email engagement metrics, driven by the seasonal nature of the product. Email open rates average 24.5% across the industry, with welcome sequences reaching 42% — nearly double the standard rate. Click rates average 2.8%, unsubscribe rates are low at 0.18%, and hard bounce rates sit at 0.6%, all according to CUFinder.
The retention opportunity is substantial. 78% of pool service customers renew annual maintenance contracts, and 45% make a repeat purchase within 90 days. Annual churn runs just 12%. The customer lifetime value for service-only relationships averages $2,400 over three years, making post-sale email nurture among the highest-ROI email marketing investments.
80% of pool service companies use email for customer retention, but fewer than half run automated drip campaigns. Builders who connect their CRM to email sequences for seasonal reminders, maintenance upsells, and referral requests capture significantly more lifetime value per customer.
Campaign ROI Case Studies
Real campaign data illustrates what disciplined digital marketing produces for pool companies:
- Blue Tree Pools: Invested $43,513 in Google and Meta ads, generated $4.38 million in total revenue across 350 deals. Pool campaigns alone produced $3.23 million from 37 deals at an average deal value of $87,000. Google pool ROAS: 293×. Combined paid pool ROAS: 135×. Cost per pool sale: $988 according to ROI.LIVE.
- Noga Pools: Achieved a 9,860% return on ad spend in four months running strategic Meta campaigns with a $1,000 monthly budget, demonstrating that smaller builders can compete effectively when creative and targeting are optimized.
- Regional builders (DG Agency data): A well-run Google Ads account for a $5M pool builder should average $150–$220 cost per qualified construction lead, producing a steady pipeline of 15–30 new-build inquiries per month.
Best Practices for Pool Building Digital Marketing
- Allocate 5–10% of gross revenue to marketing. A $5M pool builder needs $250,000–$500,000 annually — underspending leaves growth on the table.
- Diversify beyond shared-lead platforms. HomeAdvisor and Angi leads close at 8–14% versus 30–50% for direct and organic leads.
- Run Google Ads and Meta Ads together. Google captures intent (searches); Meta creates demand (inspiration). The combination delivered 36× ROAS for Blue Tree Pools.
- Start SEO early and compound. Month-9 organic leads cost $35–$75 — less than half of any paid channel. SEO adoption is accelerating (+7 pts YoY) across the pool sector.
- Build email sequences for retention. With 78% contract renewal and $2,400 LTV over three years, keeping existing pool owners engaged is the most capital-efficient growth lever.
- Invest in video creative. Video outperforms static by 3–4× on Meta platforms — the visual nature of pool projects makes footage a competitive advantage.
- Launch campaigns before January. The pool buying window opens in late fall; builders who capture planning-phase leads benefit from 30–40% lower CPCs.
- Track full-funnel ROI. With 90–180 day sales cycles and average deal values of $65,909, last-click attribution severely undervalues upper-funnel campaigns. Use CRM pipeline tracking from data intelligence tools.
Social Media and Content Marketing Data
Social media plays an increasingly visible role in pool builder marketing, though its contribution remains secondary to search and paid channels. Instagram engagement rates for pool companies average 1.85%, with TikTok reaching 4.2% and Facebook at 0.65% according to CUFinder.
Organic social adoption across the pool building sector reveals significant gaps:
- 70% of pool builders link Facebook to their website; the remaining 30% have no Facebook presence visible from their site.
- 42% maintain a linked Instagram account — a missed opportunity given the visual nature of pool projects.
- 80.5% do not have a YouTube channel, despite video being the highest-performing ad format for the vertical.
- 76% do not use X (Twitter) and 74% ignore LinkedIn for marketing, according to Patrick Herbert's study.
- Only 20–30% of pool builders are active on channels beyond Facebook, creating a competitive advantage for those who invest in multi-platform presence.
Content marketing in the pool sector centers on project portfolios, seasonal maintenance guides, and financing explainers. The average homepage word count for pool builders is just 633 words, well below SEO best practices. Builders who invest in comprehensive service pages, blog content, and video portfolios capture disproportionate organic traffic — the top 25% of Florida pool builders split 56,000 monthly visits while the remaining 75% get fewer than 50 each.
Regional Cost Variation Across Major Markets
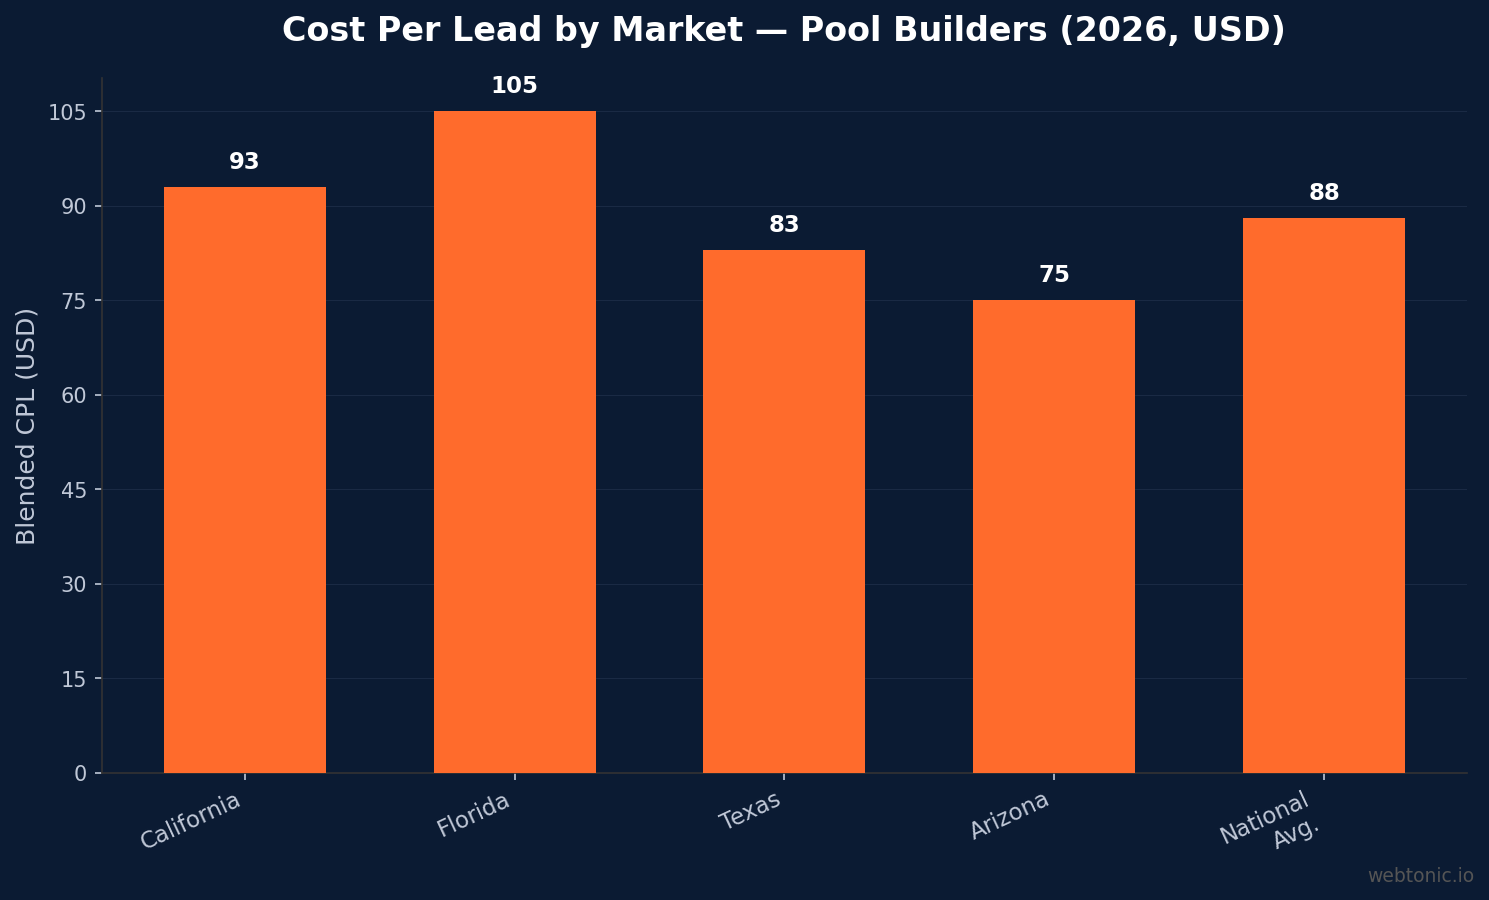
Pool builder marketing costs vary dramatically by geography, driven by competition density, average project values, and seasonal demand patterns. DG Agency provides the most granular CPL breakdowns by state:
| Market | LSA CPL | Google Ads CPL (New Build) | Avg. Pool Value |
|---|---|---|---|
| California (LA, OC, SD) | $65–$120 | $150–$300 | $75,000–$150,000 |
| Florida (Tampa, Miami) | $70–$140 | $120–$280 | $55,000–$120,000 |
| Texas (DFW, Houston) | $55–$110 | $100–$250 | $50,000–$100,000 |
| Arizona (Phoenix, Tucson) | $55–$95 | $90–$220 | $55,000–$90,000 |
Arizona produces the most favorable economics for paid advertising, with the lowest LSA CPL range and one of the highest per-capita pool ownership rates in the country. Maricopa County alone has over 300,000 residential pools, and new installations continue at a steady pace across the East Valley suburbs.
Related reading
- HVAC Digital Marketing Statistics 2026: CPL, Ad Spend & Lead Data
- Medical Spa & Aesthetics Digital Marketing Statistics: 2026 Industry Data
- Mortgage Digital Marketing Statistics: 40+ Benchmarks for 2026
- Marketing Strategy Consulting services at Web Tonic
Frequently Asked Questions
How much should a pool builder spend on digital marketing?
Pool builders should allocate 5–10% of gross revenue to digital marketing, with 7–12% recommended for aggressive growth. In practice, this means $7,000–$45,000 per month depending on company revenue tier. A $5 million pool builder should budget $250,000–$500,000 annually across Google Ads, Meta Ads, SEO, email, and content.
What is the best digital marketing channel for pool companies?
No single channel wins across all metrics. Google Local Service Ads produce the best blended cost per sale ($183–$311). Meta Ads create demand at the lowest CPL ($70–$120 for install leads). Organic SEO delivers the cheapest long-term leads ($35–$75 after a 9–12 month ramp) with the highest close rate (35–50%). The most successful pool builders run all three simultaneously.
What ROI can pool builders expect from digital marketing?
Well-executed pool builder campaigns routinely produce double-digit ROAS. Blue Tree Pools achieved a 36× blended return on $43,513 in ad spend, generating $4.38 million in revenue. Smaller builders with optimized Meta campaigns have reported returns exceeding 9,000% on $1,000 monthly budgets. The high average deal value ($65,909) makes even modest lead generation highly profitable.
Is SEO worth it for pool builders?
SEO is the highest-ROI long-term channel for pool builders. After a 9–12 month ramp at $1,500–$3,000 per month, organic leads cost $35–$75 each and close at 35–50% because the prospect searched specifically for a pool builder. SEO adoption among pool professionals jumped 7 percentage points year-over-year, signaling growing recognition of its value.
How long does it take to see results from pool builder marketing?
Paid channels (Google Ads, Meta Ads) produce leads within days of launch. SEO requires 6–12 months to reach full velocity, scaling from 2–8 leads per month in months 1–3 to 25–60 leads per month by months 9–12. The pool buying cycle itself averages 90–180 days, so leads generated in February may not close until May or June.
Sources
dgagency.co/blog/pool-builder-marketing-cost-2026
mwolfmedia.com/google-ads-for-pool-builders
cufinder.io/blog/benchmarks/swimming-pool
roi.live/Blue_Tree_Case_Study.html
poolmarketingpros.com — marketing-spend-guide
pooldial.com/resources/articles/business/pool-industry-statistics-2026
pooldial.com — state-of-pool-service-2026
marketdisruptorsagency.com — pool-builder-lead-costs
getxmedia.com/benchmarks/pool-builder-marketing
mwolfmedia.com/meta-ads-for-pool-companies-arizona
boldprodigital.com — noga-pools-case-study


