



Table of contents
Pool construction is a $62 billion industry in the United States, yet the average builder's advertising creative has barely evolved past a static photo of a finished backyard. The data tells a different story: video ads outperform static images by 3–4× for pool companies, and the format gap is widening as homeowners scroll past generic imagery and stop for transformation footage. Below are the numbers shaping ad creative strategy across the pool building sector in 2026.
Key Takeaways
- Video creative outperforms static by 3–4× in pool builder Meta campaigns, with timelapse and drone-shot formats driving the highest engagement.
- Meta Ads produce qualified pool install leads at a $95 median CPL in competitive Sun Belt markets — roughly 60% less than Google Search campaigns.
- Before-and-after carousel ads generate 3.2× more conversions than single-image lifestyle posts for pool contractors.
- 68% of pool install leads come from homeowners aged 35–55 with household incomes above $120,000, making demographic targeting critical.
- The booking window opens in January: builders who launch dream-and-design creative in winter capture planning-phase leads at 30–40% lower CPCs.
- Financing-focused creative converts fence-sitters — monthly payment messaging reduced CPL by 22% in pool builder A/B tests.
- 3D pool renders paired with financing CTAs delivered 2.8× the lead volume compared to portfolio-only static ads.
- On-time completion testimonials rank as the #1 trust signal in pool advertising, outperforming awards and years-in-business claims.
- $65,909 is the average inground pool install cost, making even a $200 lead profitable at a 30% close rate ($667 effective CPA against $65K revenue).
- Pool companies allocating 5–10% of gross revenue to marketing outperform competitors relying solely on referrals.
Pool Building Ad Creative Benchmarks at a Glance
| Metric | Benchmark (2026) | Source |
|---|---|---|
| Video vs. Static Lift | 3–4× higher engagement | M.Wolf Media |
| Meta Ads Median CPL (AZ) | $95 | M.Wolf Media |
| Google Ads CPL (New Build) | $120–$280 | DG Agency |
| Facebook/Instagram CPC | $2.15–$3.50 | CUFinder |
| Google Ads CPC (Construction) | $7.50–$11.00 | CUFinder |
| Search Ads CTR | 5.2% | CUFinder |
| Google Ads Conversion Rate | 4.8% | CUFinder |
| Avg. Inground Pool Cost | $65,909 | Angi / M.Wolf |
| CPA New Construction Lead | $125–$180 | CUFinder |
| Instagram Engagement Rate | 1.85% | CUFinder |
Video Creative Dominance in Pool Advertising
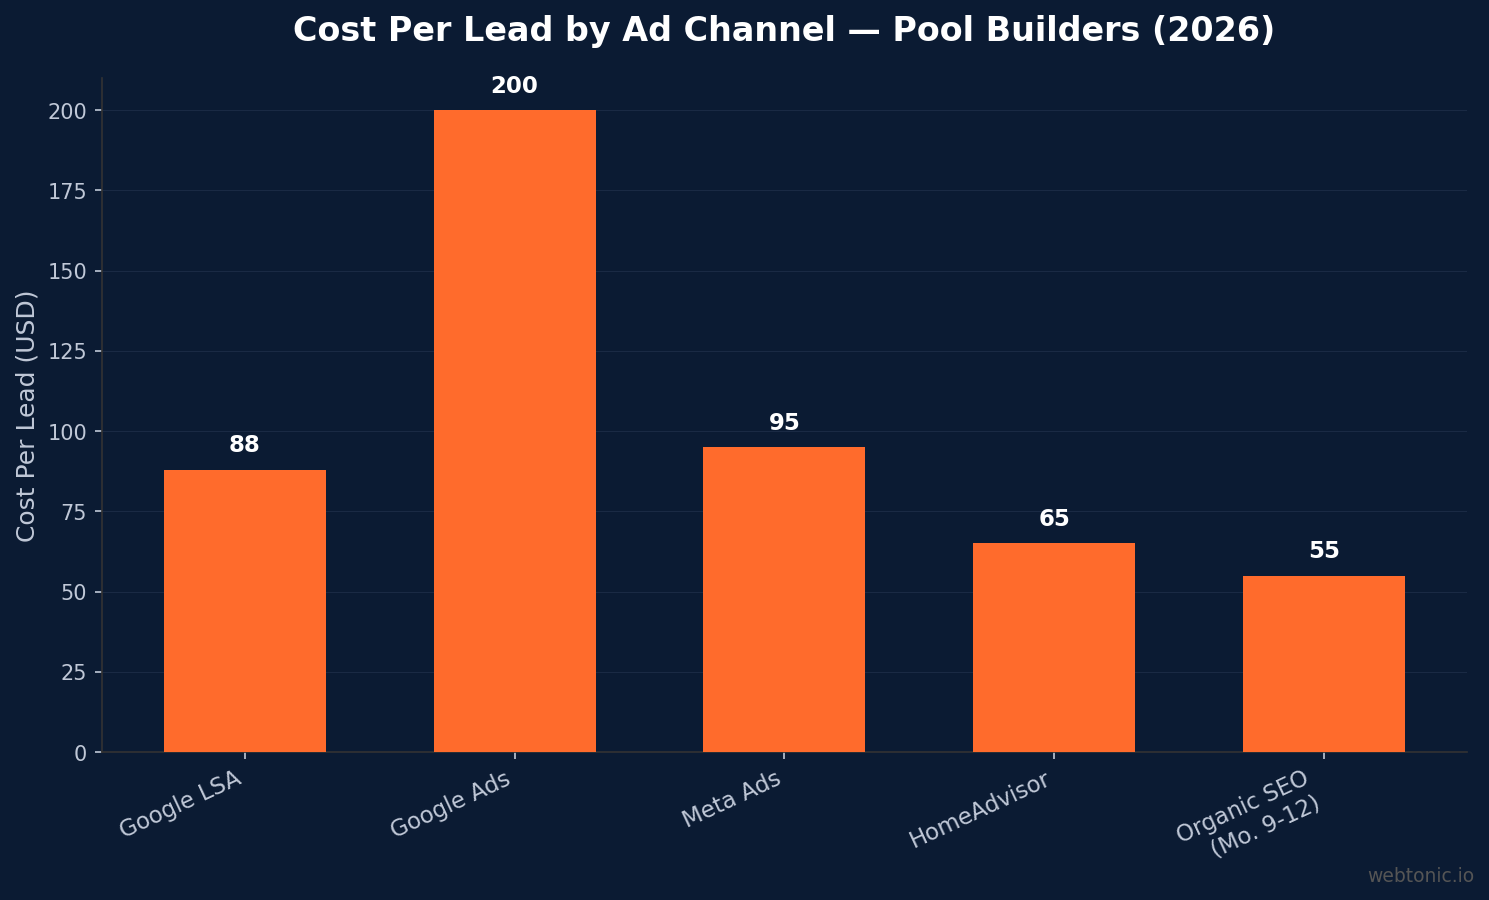
The visual nature of pool construction makes video the highest-performing format across every paid channel. Pool company Meta campaigns using timelapse and drone-shot video outperform static imagery by 3–4×, according to campaign data from M.Wolf Media. That gap widens during the pre-season window (January–April) when homeowners are in the inspiration phase.
The best-performing pool ad formats in 2026 follow a clear hierarchy. Transformation timelapse clips — showing a bare backyard becoming a finished oasis — generate the strongest engagement and lowest CPL. Before-and-after carousels rank second, letting prospects swipe through the entire project arc. Static lifestyle shots, once the default, now sit at the baseline. 3D pool renders paired with financing CTAs deliver 2.8× the lead volume of portfolio-only imagery because they show the prospect their future backyard with a reachable monthly figure attached.
Drone footage of completed backyards performs especially well on Instagram Reels and TikTok, where the pool building vertical sees a 4.2% engagement rate on TikTok and 1.85% on Instagram — both above the performance creative benchmarks for home services.
Cost Per Lead by Channel and Creative Format
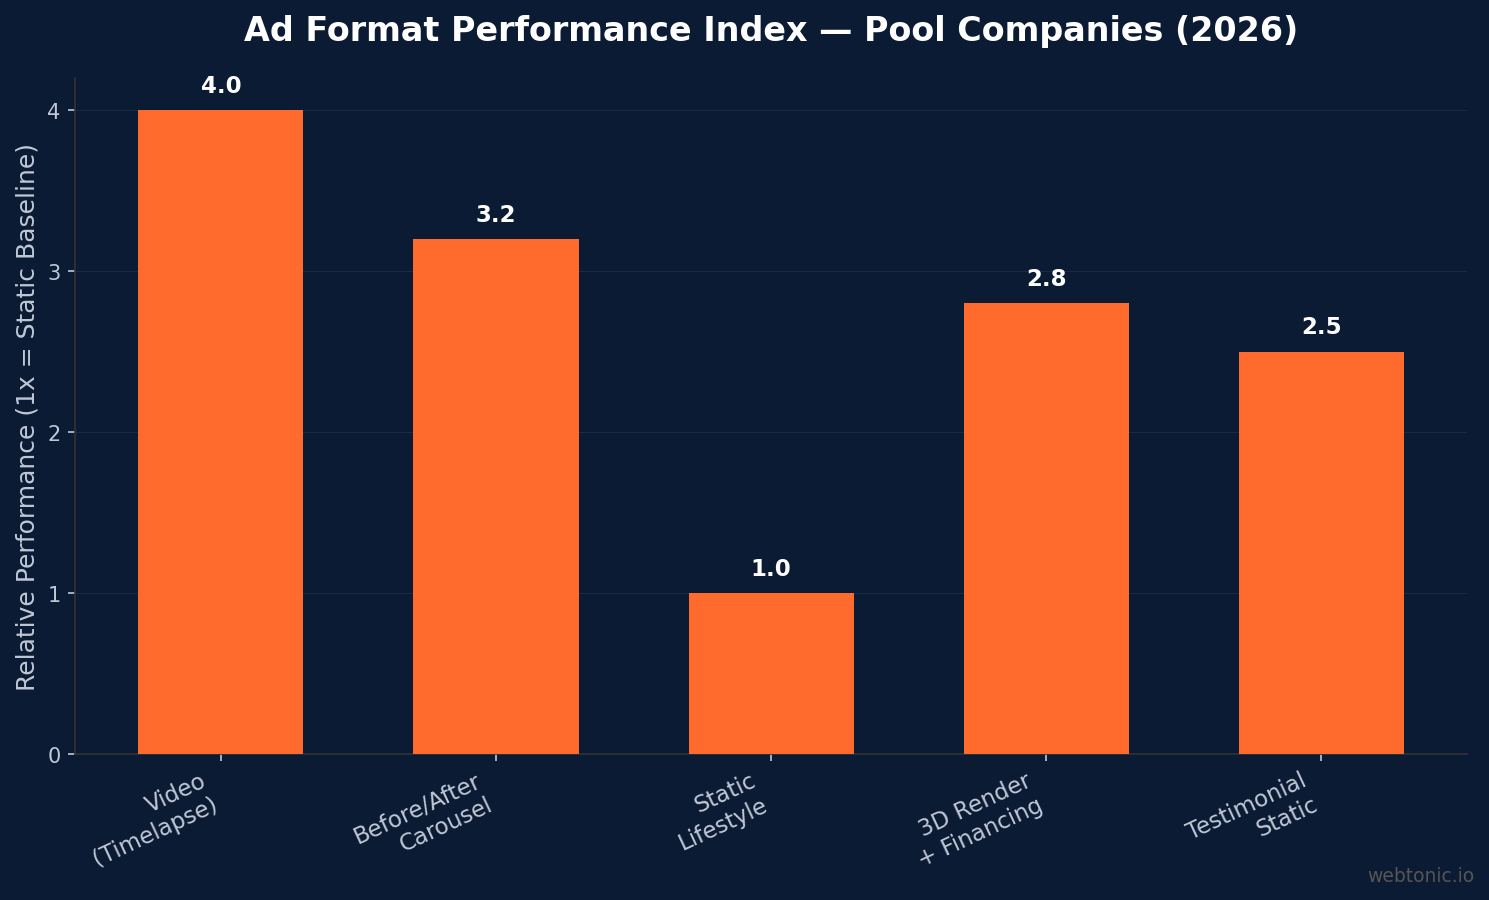
Ad creative quality directly impacts acquisition economics. Pool companies running optimized video and carousel campaigns on Meta report a median CPL of $95 for qualified install leads in Arizona — versus $240+ from Google Search using standard text ads. The gap stems from Meta's visual feed format, which matches the aspirational nature of pool purchases.
| Channel / Format | CPL Range | Close Rate | Effective Cost per Sale |
|---|---|---|---|
| Meta Video Ads | $70–$120 | 25–35% | $280–$480 |
| Meta Static/Carousel | $90–$160 | 20–28% | $450–$570 |
| Google Search Ads | $120–$280 | 30–45% | $400–$622 |
| Google LSA | $55–$140 | 30–45% | $183–$311 |
| HomeAdvisor (Shared) | $45–$95 | 8–14% | $563–$679 |
| Organic SEO (Mo. 9–12) | $35–$75 | 35–50% | $100–$150 |
Google Local Service Ads produce the best blended economics when creative assets (photos, reviews) are optimized. Builders in California pay $65–$120 per LSA lead, while Florida markets run $70–$140, with close rates of 30–45% on direct leads according to DG Agency.
Seasonal Timing and Creative Rotation
Pool purchases are seasonal by nature but decided months before the swim season. Homeowners researching in January and February want their pool finished by Memorial Day. Builders who launch aspirational creative — dream-and-design imagery, 3D renders, "imagine your backyard" video — in the off-season capture leads at 30–40% lower CPCs than those waiting for spring.
The critical advertising calendar for pool contractors:
- November–January: Dream-phase campaigns. Lifestyle video, 3D renders, and "plan your summer" messaging. Lowest competition, cheapest clicks.
- February–April: Peak booking window. Before-and-after reveals, financing offers, and testimonial proof. The majority of new-build contracts are signed during this window.
- May–July: Swim-season urgency. "Last slots available" scarcity messaging. CPCs peak; shift budget toward retargeting warm leads.
- August–October: Off-season pivots. Pool remodel, resurfacing, and service-contract creative replaces new-build campaigns.
New pool sales cycles average 90 to 180 days, which means retargeting and CRM nurture are essential — a lead generated in February may not close until May.
Creative Elements That Drive Pool Construction Leads
The five creative angles that consistently fill pool builder pipelines each target a different buyer psychology, and the most effective campaigns rotate all five across their ad sets:
| Creative Angle | Format | Buyer Trigger | Best Placement |
|---|---|---|---|
| Backyard Oasis Hero | Video / Photo | Aspiration / Lifestyle | IG Reels, FB Feed |
| Family UGC Moment | User-generated clip | Emotional connection | TikTok, Stories |
| Tired-Yard Before/After | Carousel / Swipe | Transformation proof | FB Feed, IG Feed |
| On-Time Testimonial | Static + quote overlay | Trust / credibility | FB Feed, Google |
| Financing Offer | Static / Motion | Affordability | FB Feed, Display |
On-time completion testimonials rank as the number-one trust signal in pool advertising according to creative testing data from Zendux AI. Pool projects run weeks to months, so the fear of a delayed or botched build outweighs price concerns. Ads featuring real homeowner quotes about on-time delivery outperform "award-winning builder" messaging by a wide margin.
Pool Industry Market Context for Advertisers
Understanding the market backdrop is essential for sizing creative budgets. The U.S. pool, hot tub, and spa industry is valued at $62 billion by the Pool & Hot Tub Alliance, with approximately 60,000 new in-ground pools built annually and over 14 million existing residential pools requiring ongoing maintenance.
Despite new construction falling roughly 50% from the 2021 pandemic peak, the industry remains resilient because 64% of all pool revenue comes from non-discretionary maintenance — equipment, chemicals, and service that existing pool owners cannot defer.
For advertisers, the takeaway is clear: pool building creative must sell the dream and de-risk the build. The average inground pool costs $65,909, putting it in the same decision category as a car purchase. Campaigns need both aspirational hooks (lifestyle footage, 3D renders) and rational reassurance (financing terms, testimonials, completion guarantees).
Pool companies allocating 5–10% of gross revenue to marketing consistently outperform referral-only competitors, according to Pool Marketing Pros. For a $5 million pool builder, that translates to $250,000–$500,000 in annual marketing investment.
Platform-Specific Creative Performance
Meta Ads outperform Google for pool installs in CPL terms because pool purchases are inspired, not searched. Homeowners do not type "inground pool builder" until they have already seen a finished backyard that looks like theirs — and that discovery happens in the Facebook and Instagram feed.
- Meta Ads (Facebook/Instagram): CPC of $2.15–$3.50, CPM of $14.50, with video creative cutting CPL to $70–$120 for qualified leads.
- Google Ads: CPC of $7.50–$11.00 for construction keywords (up 46% year-over-year), conversion rate of 4.8%.
- TikTok: Highest organic engagement at 4.2%, emerging as a discovery channel; paid pool campaigns still nascent.
- Instagram: 1.85% engagement rate for pool companies, strong for Reels and portfolio-driven content.
- Facebook: 0.65% engagement rate, strongest for retargeting and financing offers to warm audiences.
Blue Tree Pools invested $43,513 in combined Google and Meta ad spend and generated $4.38 million in total revenue — a 36× blended ROAS. Their pool campaigns alone produced $1.46 million from paid ads at 135× ROAS on campaign-attributed spend, with an average deal value of $132,933 per pool sale according to ROI.LIVE.
Best Practices for Pool Builder Ad Creative
- Lead with video. Timelapse builds, drone shots of finished backyards, and owner-on-camera walkthroughs consistently outperform static photos. Aim for clips under 60 seconds for feed placement.
- Show the monthly payment, not just the total price. A $65,000 pool at $389/month changes the conversation. Financing creative reduces CPL by an estimated 22% in split tests.
- Rotate five creative angles (oasis hero, family moment, before/after, testimonial, financing) — no single "winner" can address every buyer psychology.
- Launch campaigns in November–January when CPCs are lowest and homeowners are in the planning phase.
- Use geographic targeting by zip code in high-value areas. Pool installs in Arizona average $55,000–$90,000; the ideal customer profile lives in zip codes with median home values above $450,000.
- Invest in professional photography and videography. 85% of pool builder websites use blue-and-white branding — standing out visually is a competitive advantage.
- Include social proof in every ad. Customers have left over 10,000 reviews for Florida-based pool builders alone — reference ratings and review counts in creative overlays.
- Retarget for the full sales cycle. With 90–180 day consideration windows, a lead from February needs nurture through growth marketing campaigns until May or June.
Related reading
- Pool Building Video Marketing Trends: Data-Driven Insights for 2026
- Roofing Ad Creative Statistics (2026)
- What B2B SaaS ad creatives actually work?
- Branding services at Web Tonic
Frequently Asked Questions
What type of ad creative works best for pool builders?
Video creative — especially timelapse pool builds, drone shots of finished backyards, and before-and-after transformation clips — outperforms static images by 3–4× in Meta campaigns. Carousel formats showing the full project arc rank second. The most effective pool builder campaigns rotate five creative angles: oasis hero, family moment, before/after, testimonial, and financing offer.
How much does a pool builder lead cost in 2026?
Pool builder lead costs vary by channel: Google Local Service Ads produce leads at $55–$140, Meta Ads deliver qualified install leads at a median of $95, Google Search Ads run $120–$280 for new construction inquiries, and HomeAdvisor shared leads cost $45–$95 on paper but close at only 8–14%. Organic SEO leads cost $35–$75 after a 9–12 month ramp.
When should pool companies start running ads?
Pool companies should launch dream-and-design creative in November through January, when CPCs are 30–40% lower and homeowners begin planning for summer. The peak booking window is February through April, when most new-build contracts are signed. Starting ads in spring means competing against higher auction prices and shorter lead times.
Do Meta Ads or Google Ads work better for pool builders?
Meta Ads typically produce lower CPL ($95 median vs. $200+ on Google Search) because pool purchases are inspired, not searched — homeowners discover the idea in a visual feed before they ever type a query. Google captures higher-intent leads with better close rates (30–45% vs. 25–35%), so the best-performing pool builders run both channels simultaneously.
How much should a pool building company spend on marketing?
Most pool construction companies should allocate 5–10% of gross revenue to marketing, with 7–12% recommended for aggressive growth in competitive markets. A $5 million pool builder should budget $250,000–$500,000 annually across channels. Companies spending $7,000–$45,000 per month typically achieve sustainable lead pipelines.
Sources
mwolfmedia.com/meta-ads-for-pool-companies-arizona
mwolfmedia.com/google-ads-for-pool-builders
dgagency.co/blog/pool-builder-marketing-cost-2026
cufinder.io/blog/benchmarks/swimming-pool
pooldial.com/resources/articles/business/pool-industry-statistics-2026
roi.live/Blue_Tree_Case_Study.html
zenduxai.com/blog/pool-company-ad-examples.html
poolmarketingpros.com — how-much-should-i-spend-on-marketing
patrickherbert.com.au/pool-builder-statistics
getxmedia.com/benchmarks/pool-builder-marketing


