Table of contents
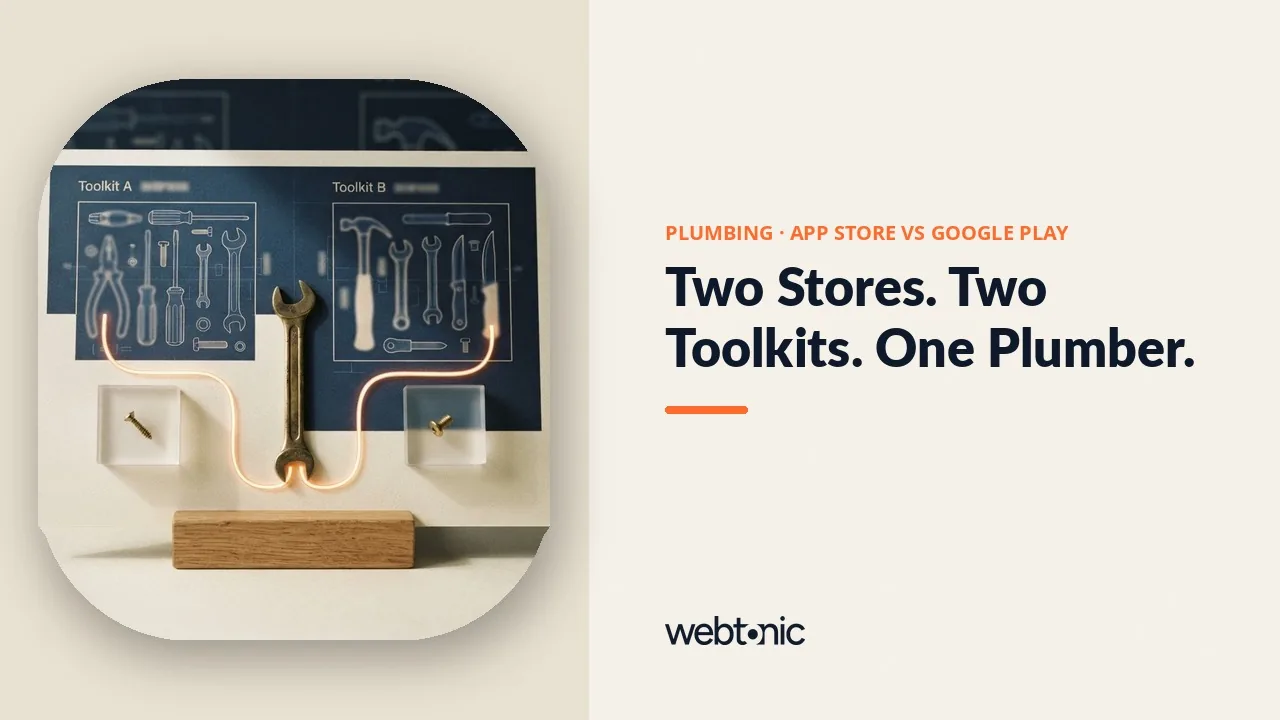
For a US plumbing company, the App Store reaches the larger share of phones - iOS carried 60.68% of US mobile web traffic in August 2026 - but Google Play gives more listing variants per dollar of setup. Neither store publishes plumbing-specific conversion data, so this page compares the two platforms lever by lever using Apple's and Google's own documentation and labelled cross-industry benchmarks.
Key Takeaways
- iOS held 60.68% of US mobile web traffic in August 2026, Android 39.29% (Statcounter).
- Across North America the split was 60.22% iOS and 39.75% Android.
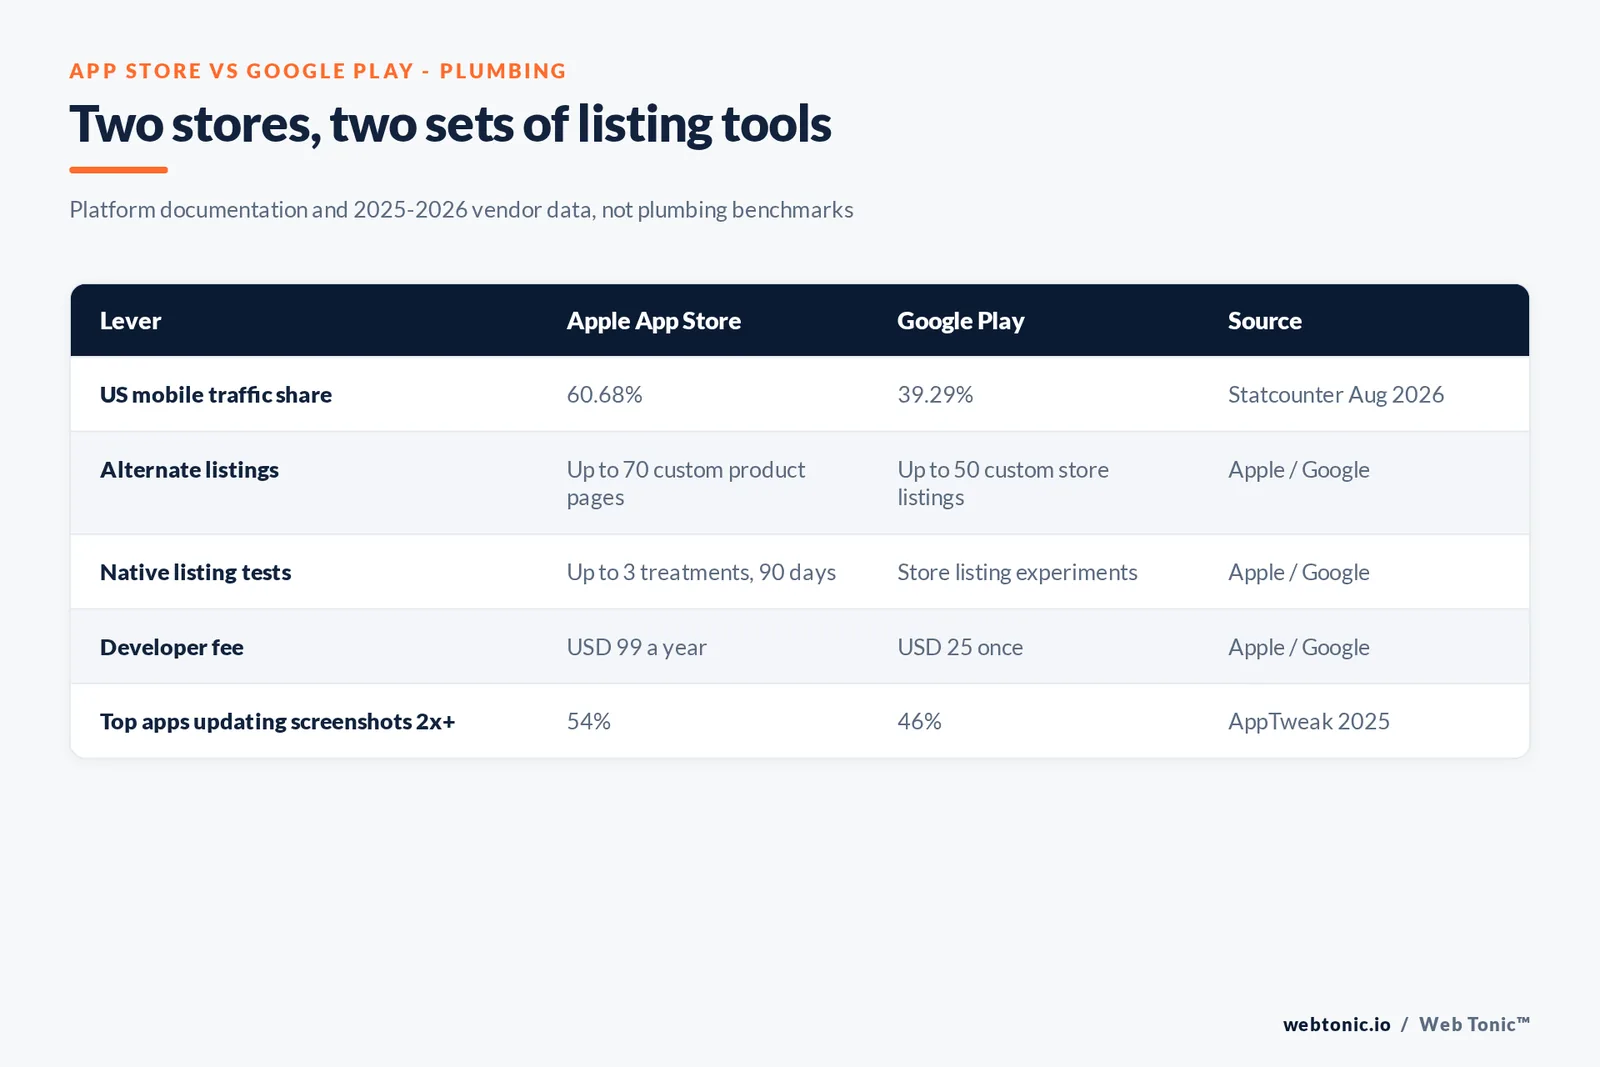
- Apple allows up to 70 custom product pages per app; Google Play allows up to 50 custom store listings.
- Apple product page tests use up to three treatments and run for up to 90 days.
- AppTweak's 2025 US average conversion rate: 8.56% on the App Store, 16.15% on Google Play.
- 54% of top US apps updated App Store screenshots twice or more in 2025, against 46% on Google Play.
- Store fees: USD 99 a year for Apple, USD 25 once for Google Play.
- No published source measures plumbing-specific app store traffic or conversion.
The device split plumbing customers bring
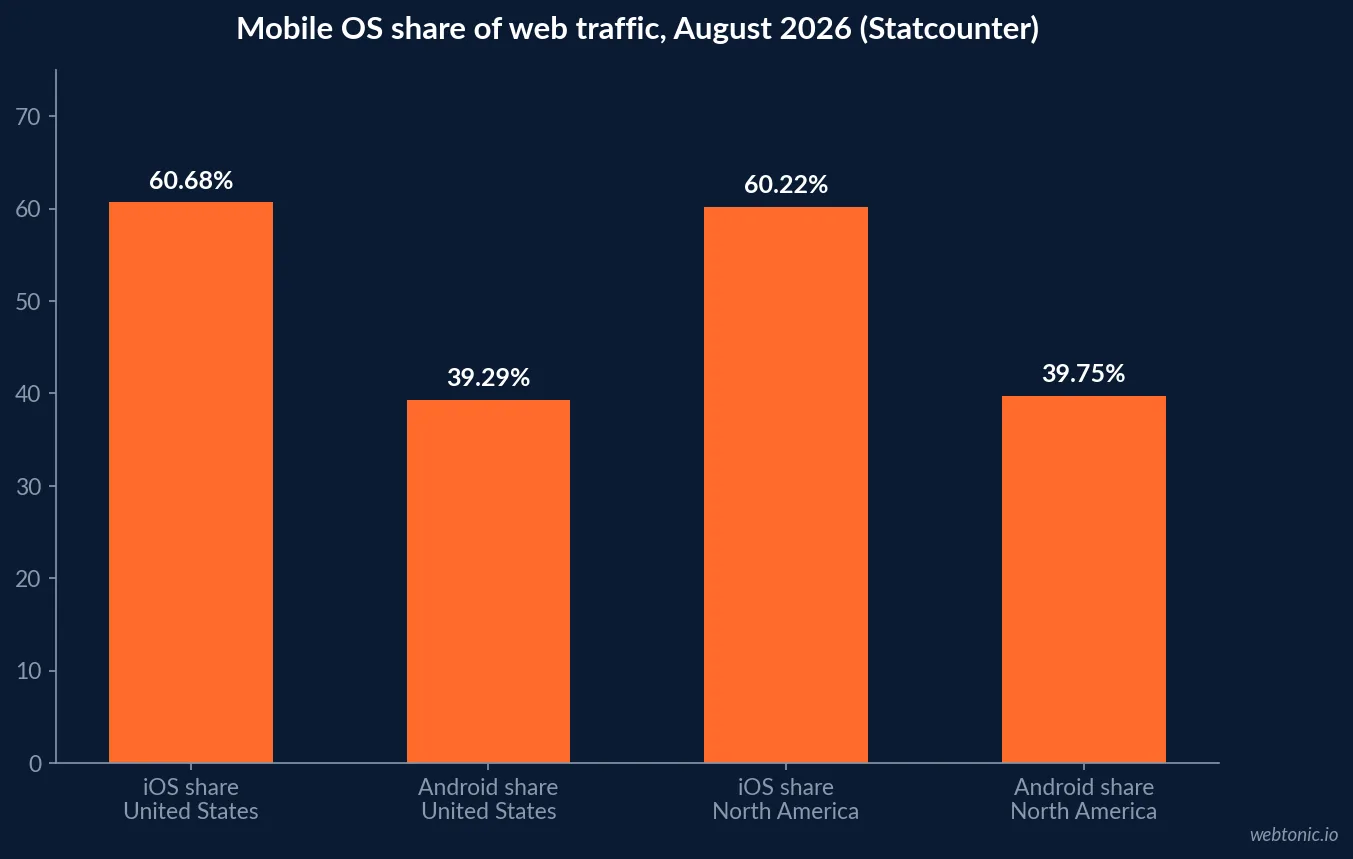
Before comparing stores, compare audiences. Statcounter's US mobile operating system data for August 2026 shows iOS at 60.68% of mobile web traffic and Android at 39.29%; its North America view is almost identical at 60.22% and 39.75%. Statcounter measures page views on sites running its tracker, so it is a proxy for who is browsing, not a count of devices or of plumbing customers. Your own website analytics by operating system is the better number for your service area.
| Market (August 2026) | iOS share | Android share | Gap |
|---|---|---|---|
| United States | 60.68% | 39.29% | 21.39 points |
| North America | 60.22% | 39.75% | 20.47 points |
Why a plumbing app is usually a retention tool
Emergency plumbing is a search-engine problem. ServiceTitan's 2025 consumer trends report says 80% of homeowners begin their search online, and Google's US Local Services Ads category list names "Plumbers" and, in California and Florida, "Drain expert" as lead categories. A homeowner with water on the floor calls whoever Google shows. The app, if there is one, earns its keep afterwards: booking the annual water heater flush, paying an invoice, sharing photos of a slow drain. That shapes which store features matter - deep links, custom pages and reviews - more than keyword rank on "plumber".
Listing variants: 70 pages on iOS, 50 on Google Play
Apple's custom product pages documentation says an app can publish up to 70 additional versions of its product page, each with different screenshots, promotional text and app previews and its own URL. Google's Play Console help allows up to 50 custom store listings, which can change the app name, icon and descriptions and can target country, user state or search keywords. For a plumbing brand that means a drain-cleaning page, a water-heater page and a maintenance-plan page, each matched to the ad or email that links to it.
| Lever | Apple App Store | Google Play | Plumbing use |
|---|---|---|---|
| Alternate listings | Up to 70 custom product pages | Up to 50 custom store listings | One page per service line |
| What can change | Screenshots, previews, promotional text | Name, icon, descriptions, graphics | Match the ad that linked in |
| Targeting | Unique URL per page, ad variations | Country, user state, search keyword | Service-area campaigns |
| Native listing test | Up to 3 treatments, 90 days max | Store listing experiments | Test the booking screenshot |
| Developer fee | USD 99 per year | USD 25 one time | Negligible either way |
Testing: what each store lets you prove
Apple's product page optimisation tests up to three treatments of icon, screenshots and previews against the original, and a test runs for 90 days or until stopped; Apple estimates the traffic needed for 90% confidence. Google's store listing experiments page cites Tapps Games increasing installs by more than 20% and Kongregate by 45% with experiments - games with national traffic. A local plumbing app with a few dozen page views a week will rarely reach significance on either store, which is a useful reality check on how much listing work it deserves.
Conversion rate: the numbers are not comparable across stores
AppTweak's 2025 category benchmarks report an average conversion rate of 8.56% on the US App Store and 16.15% on US Google Play, and a 3.8% average install rate from App Store search or browse impressions. On the App Store the highest category average was Food and Drink at 52.8%; on Google Play it was Auto and Vehicles at 62.3%. AppTweak also notes App Store conversion can exceed 100% because of redownloads. The stores count page views differently, so an Android listing converting at twice the iOS rate is not necessarily doing twice as well.
| Metric (US, 2025, cross-industry) | App Store | Google Play | Caveat |
|---|---|---|---|
| Average conversion rate | 8.56% | 16.15% | Different page-view definitions |
| Highest category average | Food and Drink 52.8% | Auto and Vehicles 62.3% | Category mix differs |
| Lowest category average | Games - Trivia 5.2% | Games - Strategy 6.6% | Games skew low |
| Install rate from search or browse | 3.8% | Not reported | App Store only |
| Plumbing-specific rate | Not published | Not published | No source found |
How top apps maintain each store
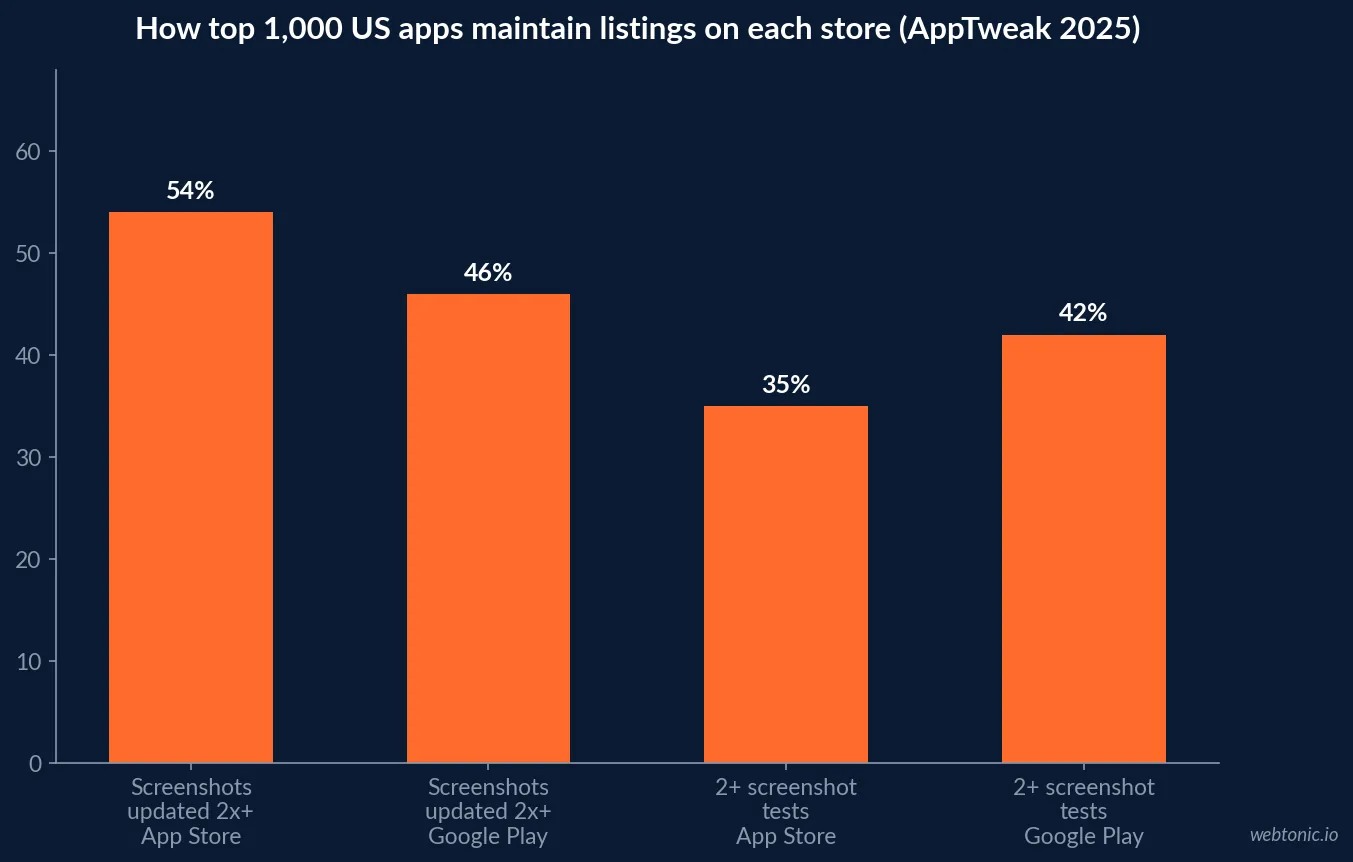
AppTweak's 2026 ASO and Apple Ads trends report, built on the top 1,000 US apps and games through 2025, shows iOS listings get refreshed more and Android listings get tested more: 54% of top apps updated App Store screenshots twice or more against 46% on Google Play, while 42% of top apps ran two or more screenshot tests on Google Play against 35% on the App Store. Around 95% of featured App Store apps and 96% of featured Google Play apps are rated 4.0 or higher. In the US, 18.6% of top apps run at least one Google Play custom store listing.
| Top 1,000 US apps, 2025 | App Store | Google Play |
|---|---|---|
| Updated screenshots twice or more | 54% | 46% |
| Ran two or more screenshot tests | 35% | 42% |
| Featured apps rated 4.0 or higher | About 95% | About 96% |
| Updated description twice or more | 34% | 34% |
| Never touched the description | 38% | 43% |
Search behaviour inside the App Store
Apple Ads help says over 70 percent of App Store visitors use search to discover apps, and Apple's 2025 transparency report counts 463,575,966 average weekly accounts searching the store. Apple publishes no equivalent split for Google Play in the sources we opened, so this page does not quote one. For plumbing, the question is not how big store search is but whether anyone types a plumbing need into it; nothing published suggests many do.
A split decision for plumbing brands
- Launching one store only: in the US, iOS reaches the larger share of mobile traffic at 60.68%.
- Multiple service lines: both stores support per-service pages; Apple allows more of them (70 vs 50).
- Want to test copy: Google Play experiments cover localised text; Apple tests cover icon, screenshots and previews.
- Reviews: with about 95-96% of featured apps at 4.0 stars or higher, ask satisfied customers for ratings on both.
- Budget: store fees are USD 99 a year and USD 25 once; the real cost is keeping two listings current.
Where this sits in a plumbing marketing plan
For demand capture, search, Maps and Local Services Ads come first; see the Google Ads cost guide and the broader app store optimization statistics for context on consumer-app benchmarks. Plumbing brands experimenting with video can compare the plumbing connected TV data.
Paid visibility on each store
The two stores sell visibility in different ways. On iOS, Apple Ads runs keyword auctions inside the App Store; MobileAction's 2026 benchmark report puts 2025 search results ads at an 8.08% tap-through rate, a 65.82% conversion rate and a USD 2.51 cost per acquisition, all cross-industry client data. On Android there is no store-only ad product; installs are bought through Google App campaigns that run across Search, Play, YouTube and partner apps, and Google's setup guidance asks for a daily budget of at least 50 times the target cost per install. For a plumbing brand that means iOS paid visibility can be bought in small, keyword-specific amounts, while Android paid installs arrive bundled with Google's wider network and a higher minimum commitment.
| Paid lever | Apple App Store | Google Play | Plumbing takeaway |
|---|---|---|---|
| Ad product | Apple Ads inside the store | Google App campaigns across networks | iOS is more store-specific |
| Benchmark cost | USD 2.51 CPA, 2025 (MobileAction) | No store-only benchmark published | Only iOS has a clean number |
| Budget rule | Set per campaign, no published ratio | At least 50x target CPI per day | Android asks for more upfront |
| Ad destination | Default or custom product page | Default or custom store listing | Match the service line |
| Search share | Over 70% of visitors use search | Not published in sources opened | Keyword work matters on iOS |
Commission and fees: why they rarely touch plumbing
Apple's Developer Program terms list a 99 USD annual fee and a 30% commission on digital goods and services sold through the App Store, 15% for Small Business Program members. A plumbing company selling physical service visits, parts and labour is not selling digital goods inside the app, so the commission normally does not apply to invoices paid through it. Google Play's registration is a one-time USD 25. Fees are therefore not a reason to prefer either store; audience and maintenance effort are.
The practical cost difference is labour. Two stores mean two sets of screenshots, two descriptions and two review queues to answer. AppTweak's data shows even top apps leave listings alone for long stretches - 38% of top App Store apps never changed their description in 2025 - so a local plumbing company should plan a quarterly refresh rather than chasing the national apps' cadence.
Methodology and limits
Platform limits come from Apple and Google documentation opened in September 2026. Device share is Statcounter's page-view measure for August 2026. Conversion and maintenance data come from AppTweak's own published datasets for 2025, a vendor labelled as such, covering top apps across all categories. No figure on this page is a plumbing benchmark, and we did not estimate one.
Frequently Asked Questions
Should a plumbing company launch on iOS or Android first?
In the United States, iOS. Statcounter's August 2026 data puts iOS at 60.68% of US mobile web traffic and Android at 39.29%. That is traffic share, not your customer base, so check your own website analytics by operating system before deciding. If the app is a thin booking or account tool, cross-platform frameworks make launching on both stores at once the usual choice.
Is Google Play conversion really higher than the App Store?
AppTweak reports a 2025 average conversion rate across categories of 8.56% on the US App Store and 16.15% on US Google Play. The two stores define a page view differently, so the gap partly reflects measurement rather than shopper behaviour. Compare each app only against its own store's benchmark.
Can a plumbing app have different store pages for drain cleaning and water heaters?
Yes. Apple lets an app publish up to 70 custom product pages, each with its own screenshots, promotional text and previews, and Google Play allows up to 50 custom store listings targeted by country, user state or search keyword. For a plumbing brand, the practical use is one page per service line linked from matching ads.
Do plumbing customers search app stores for a plumber?
No published source measures that, and the demand data points elsewhere: ServiceTitan's 2025 consumer trends report says 80% of homeowners begin their search online, and Google lists plumbers as a Local Services Ads category in the United States. Treat a plumbing app as a tool for existing customers.
How do I A/B test a plumbing app listing on each store?
On iOS, Apple's product page optimisation tests up to three alternative treatments against the original page for up to 90 days. On Android, Google Play Console has built-in store listing experiments for graphics and localised text. Low-traffic local apps may never reach significance, which is itself a signal about the channel's size.
Sources
Statcounter - US mobile OS share
Apple Developer - custom product pages
Apple Developer - product page optimization
Google Play Console Help - custom store listings
Google Play Console - store listing experiments
AppTweak - average conversion rate by category
AppTweak - ASO and Apple Ads trends report 2026
Apple - 2025 App Store Transparency Report
ServiceTitan - 2025 consumer trends report
Google - Local Services Ads categories