



Table of contents
Social platforms now influence 68% of electronics purchase decisions, and brands are responding by funneling 41% of their total marketing spend into social channels. Here are the engagement benchmarks, conversion data, and channel insights that phone and tech retailers need to allocate budgets effectively in 2026.
Key Takeaways
- 68% of electronics consumers use social media as their primary product research source, making social presence essential for phone and tech brands.
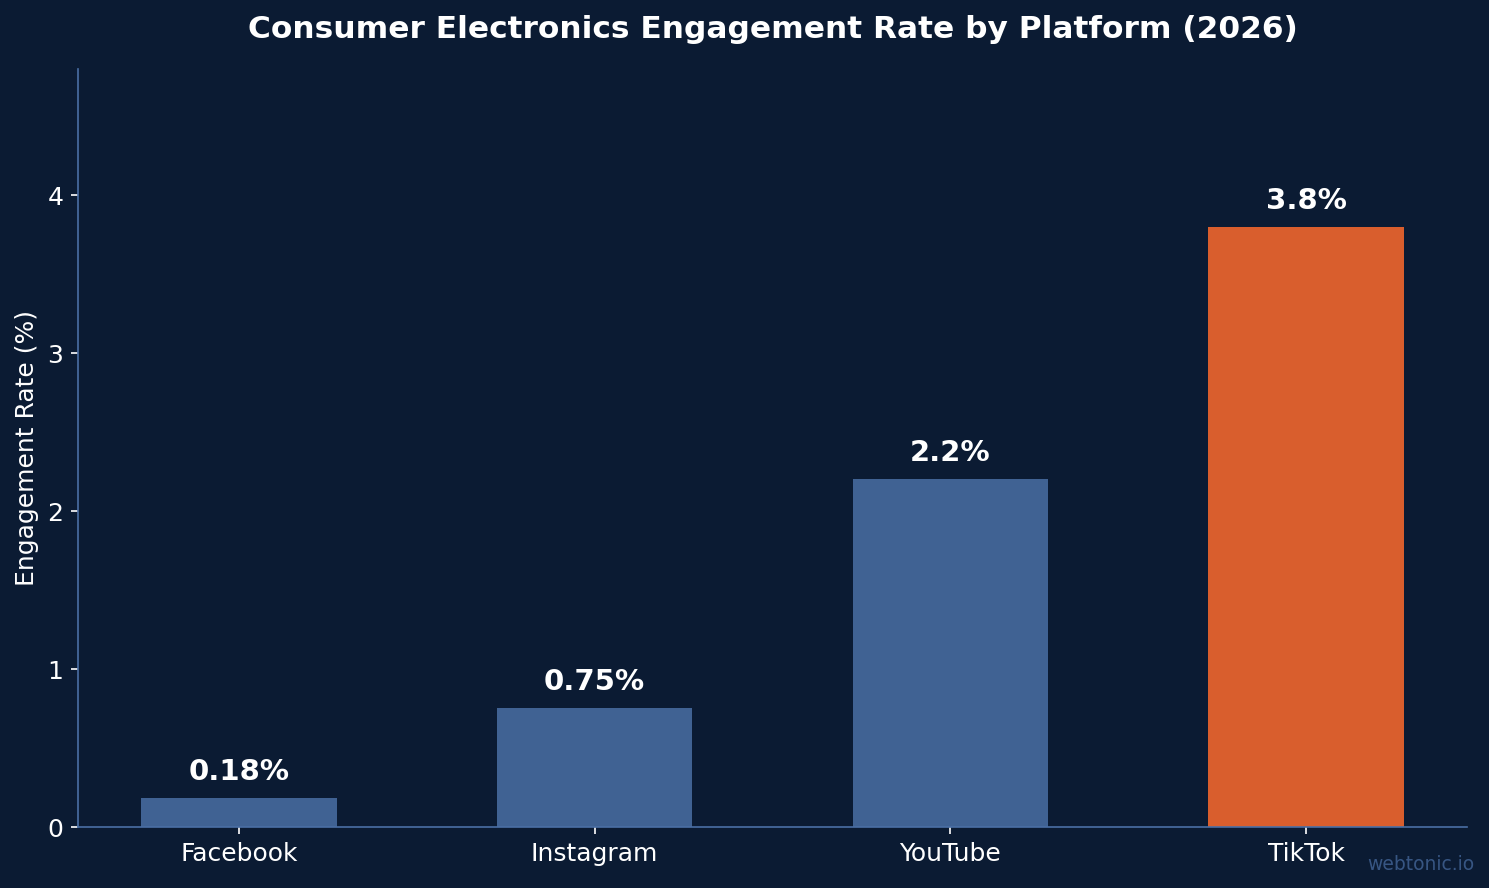
- TikTok leads engagement at 3.8% for consumer electronics, followed by YouTube (2.2%), Instagram (0.75%), and Facebook (0.18%).
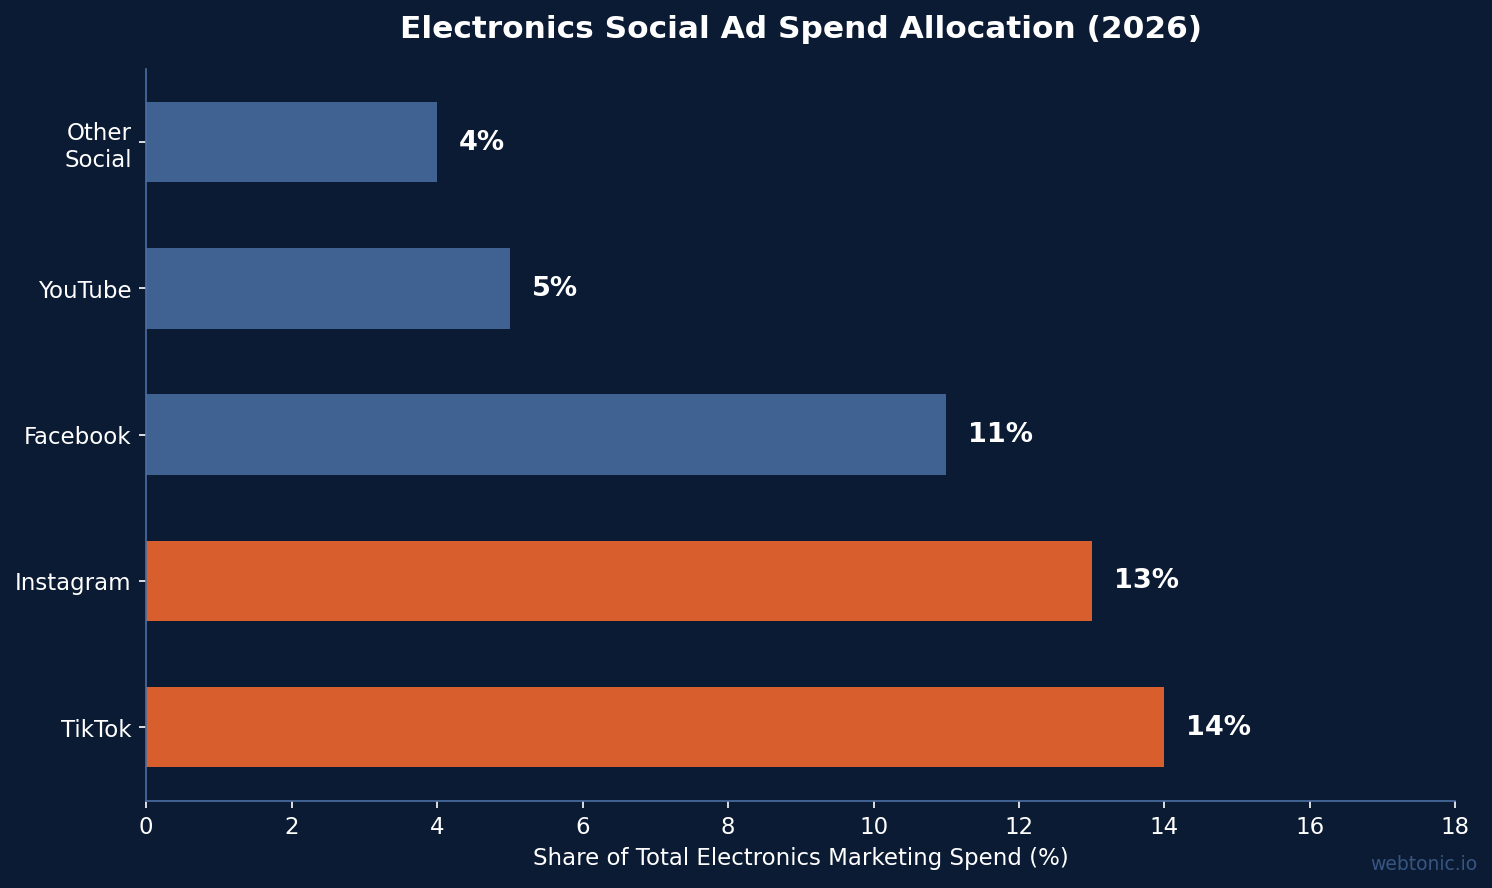
- Social media advertising accounts for 41% of total electronics marketing spend, with TikTok (14%), Instagram (13%), and Facebook (11%) leading.
- TikTok Shop converts at 4.7% versus Instagram at 2.1% and Facebook at 1.8% for electronics products.
- Micro-influencers deliver 2.3x higher ROI for electronics brands than traditional advertising channels.
- Meta video-first shopping ads produce 127% higher conversion rates compared to static image-based product ads.
Phone & Tech Retail Social Media Benchmarks at a Glance
These benchmarks aggregate data from multiple independent studies covering consumer electronics brands across all major platforms. Engagement rates, conversion metrics, and spend allocations reflect 2025–2026 data from industry reports by CuFinder, Zipdo, Dash Social, and FoundryCRO.
| Metric | Electronics Benchmark | Cross-Industry Average | Source |
|---|---|---|---|
| Social Research Usage | 68% of buyers | 55–60% | Zipdo |
| Social Ad Spend Share | 41% of marketing | 30–35% | Zipdo |
| TikTok Engagement Rate | 3.8% | 4.4% (retail avg) | CuFinder, Dash Social |
| Instagram Engagement Rate | 0.75% | 0.8–1.2% | CuFinder |
| TikTok Shop CVR | 4.7% | 3.5–4.0% | FoundryCRO |
| Influencer ROI (Micro) | 2.3x vs. traditional | 1.8x | Zipdo |
Source: Aggregated from CuFinder, Zipdo, Dash Social, FoundryCRO (2025–2026 data).
Social Media Engagement by Platform for Electronics
Engagement rates for consumer electronics vary dramatically across platforms. TikTok dominates with 3.8% engagement, driven by short-form product demos, unboxing content, and side-by-side comparisons that resonate with tech-curious audiences. Instagram Reels and YouTube Shorts follow as secondary engagement drivers, while Facebook engagement remains stubbornly low at 0.18% despite still capturing significant ad spend. The retail industry average on TikTok is 4.4%, meaning electronics slightly underperforms the broader retail benchmark — but the quality of engagement in terms of downstream purchase intent is materially higher for tech products.
| Platform | Engagement Rate | Primary Content Format | Best Electronics Use Case |
|---|---|---|---|
| TikTok | 3.8% | Short-form video (15–60s) | Unboxing, feature demos, comparisons |
| YouTube | 2.2% | Long-form video (5–15 min) | Reviews, tutorials, teardowns |
| 0.75% | Reels + carousel posts | Product photography, launch teasers | |
| 0.18% | Link posts + video | Community groups, customer support |
Source: CuFinder — Consumer Electronics Marketing Benchmarks 2026.
The engagement gap between TikTok and legacy platforms is widening. For phone and tech retailers, TikTok's algorithm favors product-focused content over polished brand messaging, which means smaller electronics brands can compete effectively against established players. Retailers investing in performance creative that showcases real product demonstrations outperform those running traditional lifestyle imagery.
Social Commerce Conversion Rates: Where Purchases Happen
Social commerce is rapidly transitioning from a discovery channel to a direct revenue driver for electronics. TikTok Shop leads conversion rates at 4.7% for in-platform purchases, substantially ahead of Instagram (2.1%) and Facebook (1.8%). Live shopping sessions on TikTok convert at even higher rates, reaching 4–6% for well-seeded sessions.
| Platform | Social Commerce CVR | Live Shopping CVR | Source |
|---|---|---|---|
| TikTok Shop | 4.7% | 4–6% | FoundryCRO |
| Instagram Shops | 2.1% | 2.5–3.5% | FoundryCRO |
| Facebook Shops | 1.8% | 2.0–2.8% | FoundryCRO |
| YouTube Shopping | 1.4% | — | FoundryCRO |
Source: FoundryCRO — Ecommerce Marketing Benchmarks 2026.
The US live shopping market is projected at $68 billion for 2026, and electronics products are a natural fit for live demonstrations. Samsung and Disney joining TikTok Shop during Black Friday 2025 drove 54.5% higher social commerce sales compared to 2024, signaling mainstream adoption in the electronics category.
Social Commerce Market Growth and Electronics Share
The global social commerce market is on track to reach $1.2 trillion, and consumer electronics ranks among the top three product categories driving that growth. Within the broader social commerce landscape, electronics benefits from a unique advantage: buyers actively seek product demonstrations and peer reviews before purchasing, and social platforms deliver both at scale.
Clothing leads social commerce adoption at 53% of all social purchases, followed by shoes at 42% and consumer electronics at 30%. However, electronics commands a higher average transaction value, making each social sale more profitable than in apparel or beauty categories. The combination of high AOV and strong social research behavior — 68% of electronics buyers start on social — positions phone and tech retailers to capture outsized returns from social commerce investment.
Black Friday 2025 proved the concept at scale. Social commerce sales surged 54.5% year-over-year, driven by major electronics brands like Samsung and Disney activating TikTok Shop storefronts. The live shopping market in the US alone is projected at $68 billion for 2026, a figure that underscores how quickly social platforms are evolving from awareness channels into transaction layers.
Video-First Advertising Performance for Electronics
Meta's video-first shopping ads are reshaping how electronics brands approach paid social. According to Ecommerce Times, video-first shopping ads deliver measurably stronger results than image-based alternatives across every metric:
- 127% higher conversion rates compared to image-based product ads
- 89% increase in click-through rates
- 52% improvement in return on ad spend (ROAS)
- 34% longer average session duration post-click
For phone and tech retailers, these numbers make a strong case for shifting creative budgets away from static imagery and toward short-form video production. 40% of electronics shoppers say they have purchased a product after being influenced by a social media advertisement, according to WiFi Talents, and video ads are the format driving that conversion behavior.
Influencer Marketing ROI for Phone & Tech Brands
Influencer partnerships deliver outsized returns for electronics brands compared to other verticals. Micro-influencers generate 2.3x higher ROI than traditional advertising for electronics products, largely because tech audiences trust peer-level reviews more than polished brand campaigns.
- 78% of consumers trust "regular user" reviews when researching electronics purchases — more than professional critic reviews or brand messaging.
- Samsung's social shopping livestream generated 967K+ views with a 92-second average watch time, an unboxing CTR of 21.47% (versus the 13% benchmark), and 459K additional views from a 3-day stream extension.
- Apple leads electronics brand loyalty at 72%, followed by Sony (58%) and Samsung (55%), partly driven by consistent influencer and social media presence.
- Contextual social advertising — which targets based on real-time behavioral signals rather than demographics — reduces customer acquisition costs by 79% compared to traditional social targeting.
The Meta advertising ecosystem remains the primary spend destination for most electronics brands, but TikTok is capturing an increasing share. Brands that diversify across both platforms while maintaining creative consistency see the strongest overall performance.
Best Practices for Phone & Tech Social Media Marketing
- Prioritize short-form video content — TikTok and Reels drive the highest engagement. Feature real product demos over lifestyle imagery.
- Invest in micro-influencer partnerships — 2.3x higher ROI than traditional ads. Focus on tech reviewers with 10K–100K followers who produce authentic content.
- Launch TikTok Shop for direct conversions — 4.7% CVR outpaces every other social commerce channel for electronics products.
- Test live shopping events — live sessions convert at 4–6% and the $68B US market is still in early adoption for electronics.
- Shift to video-first ad creative — Meta video-first shopping ads deliver 127% higher conversions than static images.
- Use contextual targeting — behavioral-signal targeting cuts CAC by 79% versus traditional demographic-based social ads.
- Monitor cross-platform attribution — social discovery often converts on-site; use proper attribution tracking to capture full ROI.
- Leverage user-generated content — 78% of electronics consumers trust regular-user reviews. Repurpose customer videos and photos into ad creative for authentic social proof at scale.
Electronics vs. Other Industries: Social Media Marketing Comparison
Compared to other retail verticals, electronics social marketing is defined by higher spend, lower organic engagement, and stronger conversion once engagement occurs. The deliberation cycle is longer and the average purchase value is higher, but social proof — particularly peer reviews and product demonstration videos — has an outsized impact on purchase confidence. Electronics brands also benefit from higher search intent on social platforms, as 68% of buyers research products through social content before visiting a brand site or retailer.
| Metric | Electronics | Fashion | Beauty | Food & Bev |
|---|---|---|---|---|
| Social Ad Spend (% of budget) | 41% | 35% | 38% | 28% |
| TikTok Engagement | 3.8% | 4.2% | 5.0% | 3.5% |
| Social Commerce CVR | 4.7% (TikTok) | 3.5% | 4.0% | 2.8% |
| Influencer ROI Multiple | 2.3x | 2.0x | 2.5x | 1.5x |
| Social Research Usage | 68% | 55% | 60% | 42% |
Source: Zipdo, CuFinder, FoundryCRO, Dash Social (2025–2026 data).
Electronics stands out in social research usage: 68% of buyers use social platforms to research products, compared to 55% in fashion and just 42% in food and beverage. This makes social presence not just a branding investment but a direct driver of purchase intent and consideration. Brands that combine strong organic engagement with well-targeted paid social campaigns see the highest overall return from social channels, particularly when creative assets are repurposed across platforms.
FAQ
Which social media platform has the highest engagement for electronics brands?
TikTok leads with 3.8% engagement rate for consumer electronics in 2026, according to CuFinder. YouTube follows at 2.2%, while Instagram and Facebook trail at 0.75% and 0.18% respectively. Short-form product demos and unboxing videos drive the bulk of TikTok engagement.
What percentage of electronics marketing spend goes to social media?
41% of total electronics marketing spend goes to social media advertising, with TikTok capturing 14%, Instagram 13%, and Facebook 11% of the total budget. This allocation has shifted significantly toward TikTok over the past two years.
How effective is TikTok Shop for selling electronics?
TikTok Shop converts at 4.7% for electronics products, substantially higher than Instagram Shops (2.1%) and Facebook Shops (1.8%). Live shopping sessions on TikTok achieve even higher rates of 4–6%. Samsung joining TikTok Shop during Black Friday 2025 contributed to a 54.5% increase in social commerce sales.
Do influencer partnerships work for electronics brands?
Yes. Micro-influencers deliver 2.3x higher ROI for electronics brands than traditional advertising. Tech audiences trust peer-level reviews — 78% of consumers trust regular-user reviews over professional critics or brand messaging when researching electronics purchases.
Are video ads more effective than image ads for electronics on social media?
Significantly. Meta video-first shopping ads deliver 127% higher conversion rates, 89% higher CTR, and 52% better ROAS compared to image-based product ads. For electronics, where product functionality is difficult to convey through static images, video advertising is the highest-performing format.
Sources
CuFinder — Consumer Electronics Marketing Benchmarks 2026
Zipdo — Marketing in the Electronics Industry Statistics 2026
WiFi Talents — Marketing in the Electronics Industry 2026
Dash Social — 2026 Retail Industry Benchmarks
FoundryCRO — Ecommerce Marketing Benchmarks 2026
Marketing LTB — Social Commerce Statistics 2026
Pulse Advertising — Social Media Black Friday Stats 2025
Ecommerce Times — Meta Video Shopping Ads
Ecommerce Times — Contextual Social Ads
Searchlab — Social Media Statistics 2026


