Table of contents
X sells the cheapest attention in paid social — a $5.65 CPM and $0.74 clicks — and produces the weakest engagement of any major platform at 0.035% per brand post. For pest control, that trade-off has one narrow winning use case.
Key Takeaways
- Average X CPC is $0.74, ranging $0.27–$1.95.
- Average CPM is $5.65, down about 38% since 2022.
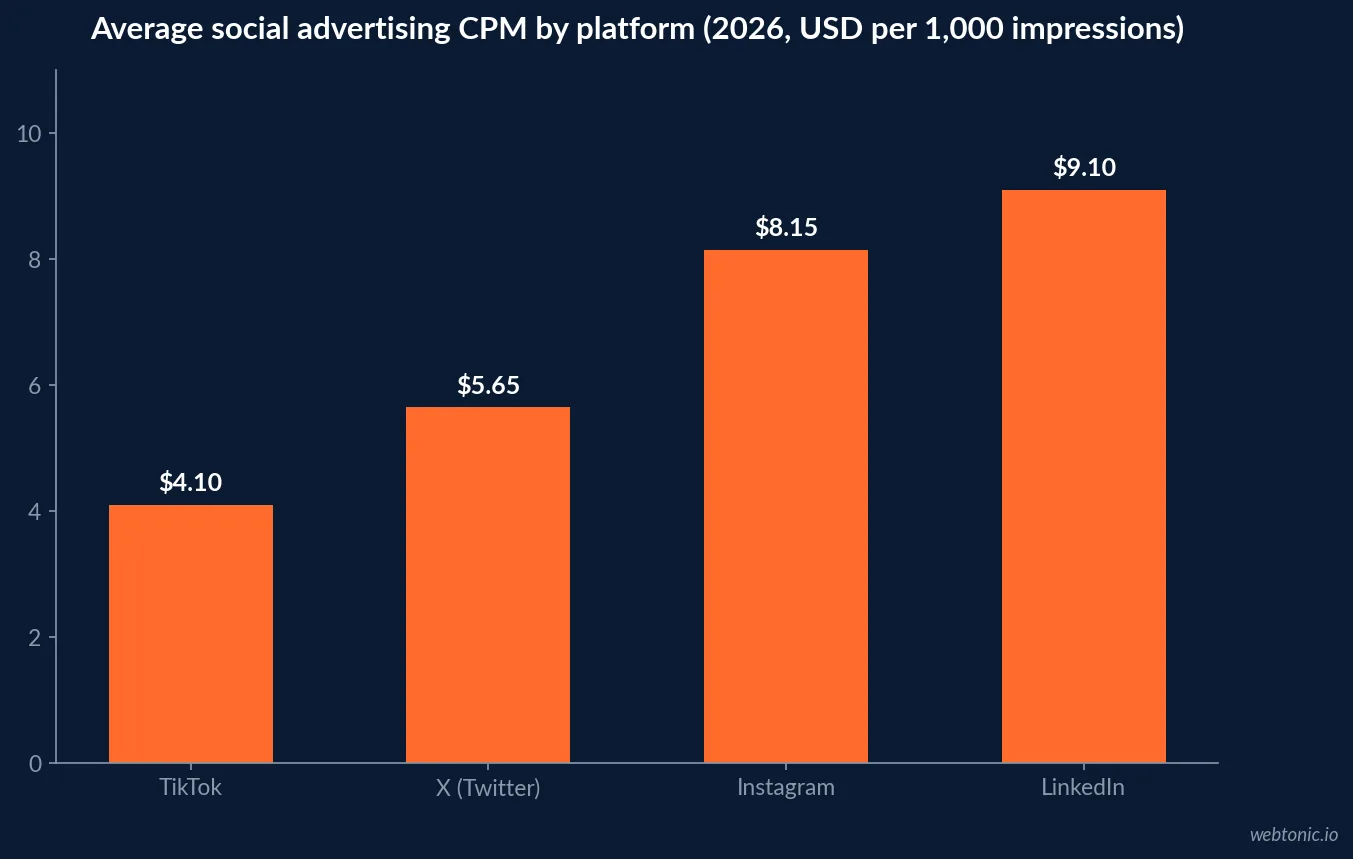
- X CPM undercuts Instagram at $8.15 and LinkedIn at $9.10.
- Average CTR is 0.86%; promoted video reaches 1.24%.
- Cost per lead is $41 versus $24 on Facebook.
- Marketers report 34% lower lead quality on X than LinkedIn.
- Lead-generation campaigns convert at 0.77%.
- Brand engagement is 0.035% per post, the lowest of any major platform.
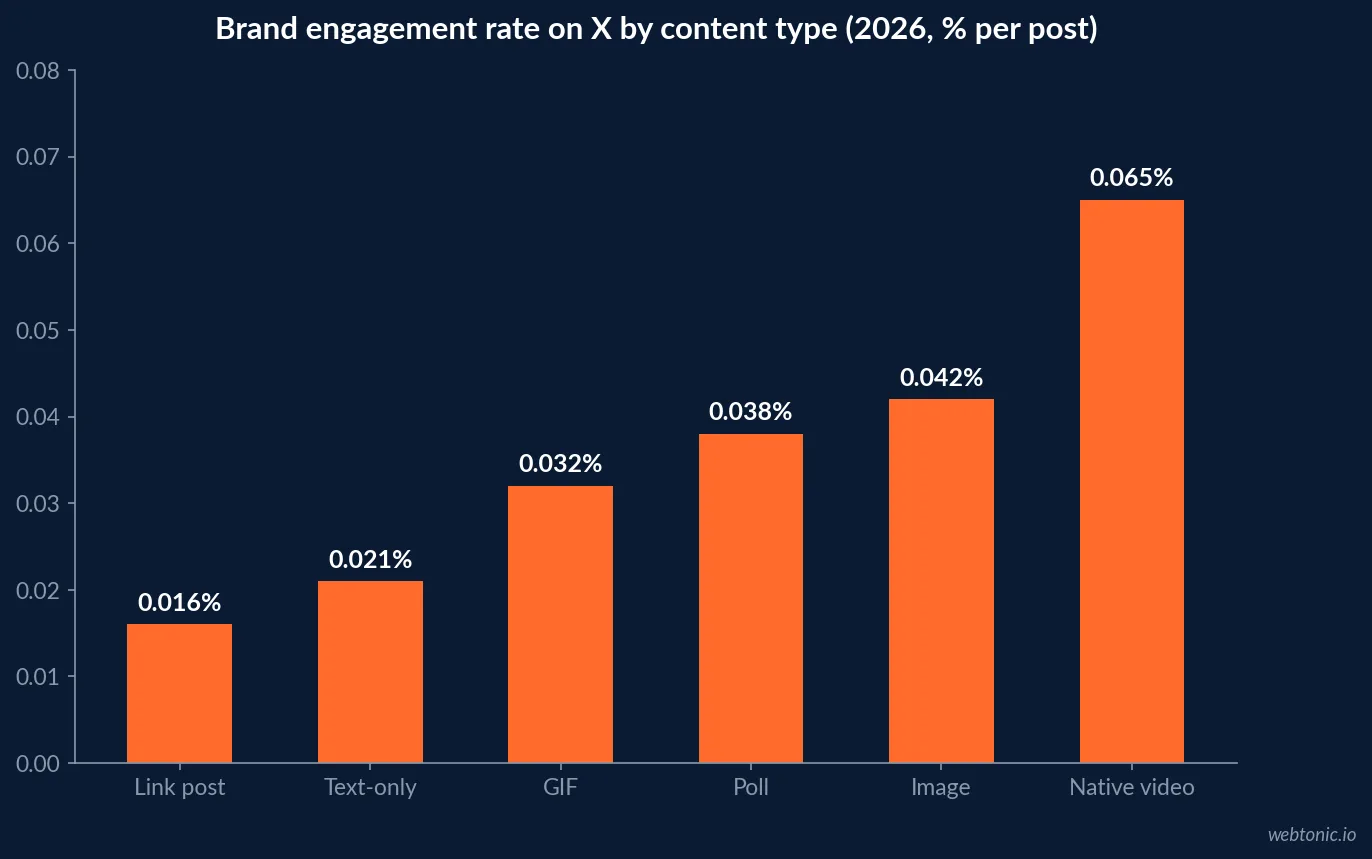
- Native video engages at 0.065% versus 0.016% for link posts.
- Keyword targeting lifts CTR about 31% over interest targeting.
- Vertical video ads outperform horizontal by about 28%.
- X reports 611 million monthly and 259 million daily users.
- The US base is 95.4 million, 15.6% of global MAU.
- SpaceX’s S-1 disclosed 550 million MAU for X plus Grok.
- Pew finds 21% of US adults use X.
- 60.9% of users are male and 68% live in urban areas.
- 47% of users describe themselves as lurkers; only 8% post daily.
- Only 16% of social users discover products on X versus 61% on Instagram.
- X ad revenue is about $2.5 billion, down 54% from 2021.
- 52% of pre-acquisition advertisers cut or stopped X spend.
- Promoted Trends cost $100,000–250,000 per day.
- Pest control cost per lead runs $150–250 nationally.
The Price List: Why X Inventory Is Cheap
X is inexpensive for a structural reason, not a clever one. Average CPC sits at $0.74 across a $0.27–$1.95 range, average CPM at $5.65 — a 38% decline since 2022 — and 52% of advertisers who ran on the platform before the 2022 acquisition have reduced or stopped spending. Lower advertiser density means less auction pressure, which is the whole mechanism.
| Platform | Average CPM | Average CPC | Average CTR | Cost per lead |
|---|---|---|---|---|
| X (Twitter) | $5.65 | $0.74 | 0.86% | $41 |
| TikTok | $4.10 | $0.62–$1.02 | 1.18% | $20 |
| $8.15 | Not disclosed | Not disclosed | Not disclosed | |
| $9.10 | Not disclosed | 0.65% | $82 | |
| Not disclosed | Not disclosed | 0.90% | $24 |
Cheap impressions are genuinely useful for one thing: buying recognition in a service area at a low unit cost. They are useless for the moment that actually produces pest control revenue, when a homeowner finds swarmers in a living room and searches. That is a paid-search and Local Services Ads problem, which is why we usually build the growth marketing plan around capture first and cheap reach second.
Engagement: The Lowest Floor in Social
The reason cheap X impressions rarely compound is engagement. Brand posts average 0.035% engagement, a 28% decline versus 2023, against 0.60% on Instagram, 2.65% on TikTok and 0.54% on LinkedIn. Content type matters more here than on any other platform.
| Content type on X | Engagement rate | Relative to text-only | Pest control application |
|---|---|---|---|
| Native video | 0.065% | 3.1x | Treatment footage, technician explainers |
| Image, single or carousel | 0.042% | 2.0x | Seasonal pest identification graphics |
| Poll | 0.038% | 1.8x | Local awareness hooks, low commercial value |
| GIF | 0.032% | 1.5x | Rarely worth production time |
| Text-only | 0.021% | Baseline | Service alerts and swarm warnings |
| Link post | 0.016% | 0.8x | Worst performer — the format most operators default to |
Two structural facts compound the problem. 47% of X users describe themselves as lurkers and only 8% post daily, while 20% of accounts generate 98% of posts. The audience is real but overwhelmingly passive, and the algorithmic “For You” feed produces 78% of impressions, so organic reach for a local service brand is effectively a paid outcome.
Audience Fit: Educated, Urban, Male — and Not Shopping
Demographically, X is a news and commentary platform. 60.9% of global users are male, 68% live in urban areas — the highest urban concentration of any major platform — 42% hold a college degree and 63% use the platform primarily for news. Pew Research finds 21% of US adults use X, well behind YouTube at 84%, Facebook at 71% and Instagram at 50%.
The commercial-intent gap is the number that should decide the budget. Only 16% of social media users use X for product discovery, against 61% for Instagram and 60% for Facebook, and X is forecast to capture just 0.2% of worldwide digital ad spending. Pest control is a local, urgent, household purchase; X is a national, ambient, opinion channel.
| Audience metric | X figure | Why it matters for pest control |
|---|---|---|
| US adults using the platform | 21% | Smallest addressable local base of the major platforms |
| US monthly active users | 95.4M | Nationally broad, locally thin |
| Male share of users | 60.9% | Household decision-making often shared or female-led |
| Urban share of users | 68% | Suits metro operators, poor fit for suburban routes |
| Primary use is news | 63% | Mindset is commentary, not home maintenance |
| Product discovery usage | 16% | Four times weaker than Instagram |
| Self-described lurkers | 47% | Little organic amplification to earn |
| Daily posters | 8% | Community-building strategies underperform |
The Platform Risk Nobody Prices
Platform stability is a media-planning input, not a political one. SpaceX’s May 2026 S-1 filing disclosed 550 million monthly active users across the combined X plus Grok ecosystem, 117 million Grok monthly actives, 6.3 million paid subscribers and roughly 350 million daily posts — the first SEC-filed X user metrics since 2022. Third-party trackers publish 611 million MAU for the X platform alone. Both figures are defensible; they measure different things.
| Metric | Figure | Scope and source type |
|---|---|---|
| Monthly active users, X platform | 611M | Third-party estimate, X Corp statements |
| Monthly active users, X plus Grok | 550M | Management-disclosed in an SEC filing |
| Daily active users | 259M | Third-party estimate |
| Grok monthly active users | 117M | Management-disclosed |
| Paid subscribers | 6.3M | Management-disclosed, March 2026 |
| Global ad revenue | ~$2.5B | Forecast, down 54% from $5.4B in 2021 |
| Monetizable daily active users | Not disclosed | Discontinued after Q2 2022 |
For a local operator the practical read is simple: do not build a lead engine on a channel whose advertising revenue has halved and whose core delivery metric is no longer reported. Keep X reversible and keep the tracking in your own stack through data intelligence rather than platform dashboards.
The One Play That Works: Keyword Targeting
X has a targeting capability no other social platform matches: bidding against the words people recently posted or searched. That delivers roughly 31% higher CTR than interest targeting and gets a pest control brand in front of genuine local conversation — complaints about roaches in a specific building, storm-driven rodent surges, apartment infestation threads.
| Use case on X | Mechanism | Realistic outcome | Verdict |
|---|---|---|---|
| Local keyword targeting | Bid on recent posts and searches | 0.86%–1.24% CTR at $0.74 CPC | Worth testing |
| Reputation monitoring | Track brand and competitor mentions | Faster complaint response | Keep, free |
| Promoted native video | Reuse existing vertical creative | 1.24% CTR, 0.065% engagement | Low-cost add-on |
| Lead-generation campaigns | In-platform form fills | 0.77% conversion, 34% lower quality | Skip |
| Promoted Trends | Premium takeover placement | $100,000–250,000 per day | Not applicable |
| Community building | Organic posting cadence | 0.035% engagement per post | Not a priority |
Everything else on the platform is a worse version of something a pest control operator already runs. The cheap CPM is real; the intent is not. Treat X the way you would treat a billboard in a commuter corridor: measurable in reach, unmeasurable in booked jobs, and priced accordingly.
Reading X Against the Channels That Actually Book Jobs
Every channel decision in pest control should be made against Local Services Ads, because that is the cheapest high-intent lead available to the trade. Regional 2026 benchmarks put Local Services Ads leads at $20–30, the national blended cost per lead at $150–250, organic search converting pest traffic at 14.6%, and Southeast termite leads justifying $200–350 because the treatment ticket runs $500–3,000. Regional spread matters too: California and Pacific Northwest metros routinely exceed $350 per high-intent lead, while the Mountain West sits at $140–200.
| Channel | 2026 cost per lead | Intent at point of contact | Role for a pest operator |
|---|---|---|---|
| Google Local Services Ads | $20–30 | Ready to book, phone-first | Always-on core |
| Organic search and local pack | Content and time cost | High, 14.6% conversion | Compounding asset |
| Paid search | $90.92 home-services average | Keyword-matched | Scaled acquisition |
| Meta and Instagram | Roughly $30–60 locally | Interrupted but household-aligned | Demand creation |
| TikTok | $20 benchmark CPL | Interrupted, young skew | Capped test |
| X (Twitter) | $41 benchmark CPL | Interrupted, news mindset | Capped test at best |
| $82 benchmark CPL | Professional, B2B only | Commercial accounts only |
Two things stand out when X is placed in that column. First, its $41 benchmark cost per lead is nominally cheaper than a blended pest lead but arrives with 34% lower reported quality and a 0.77% conversion rate, so the effective cost per booked job is unknowable from platform data alone. Second, every channel above it in the table either matches household demographics better or captures existing intent. X does neither, which is why it belongs at the bottom of a pest control media plan rather than off it entirely.
Commercial accounts are the one exception worth naming. Property managers, restaurant groups and facilities teams do use X, and 34% of its users work in the knowledge economy with 42% holding a degree. If commercial contracts are a growth priority, keyword-targeted X reach against local business conversation is a defensible sliver of a B2B budget — still smaller than LinkedIn, and still measured on tracked calls.
How to Cap the Experiment
If you run X, run it small and run it with an exit condition. Against a national pest control cost per lead of $150–250 and Local Services Ads leads at $20–30, X has to prove itself against a very cheap incumbent.
- Cap spend at 3–5% of paid budget for 30 days.
- Use keyword targeting only — interest targeting gives up the 31% CTR edge.
- Run native vertical video; it beats horizontal by about 28% and link posts by 4x on engagement.
- Never use in-platform lead forms at 0.77% conversion and 34% lower quality.
- Measure tracked calls and booked jobs, not impressions at $5.65 per thousand.
- Kill it if cost per tracked call exceeds 2x your Local Services Ads baseline.
Compared with the platforms that reliably move home-services revenue — search, Local Services Ads and Meta — X is a rounding error you can afford to test once. If you want a second opinion on the channel mix before you spend, talk to us, and if you are weighing paid social costs more broadly, our breakdown of Facebook ad pricing for 2026 is the right comparison point.
Frequently Asked Questions
What do X (Twitter) ads cost in 2026?
The average CPC on X is $0.74 within a range of $0.27 to $1.95, and the average CPM is $5.65 — below Instagram at $8.15 and LinkedIn at $9.10, above TikTok at $4.10. CPM has fallen about 38% since 2022 as advertisers left the platform, which is the entire reason the inventory is cheap.
Is X advertising worth it for a pest control company?
Only as a small, capped experiment. X carries the lowest engagement rate of any major platform at 0.035% per brand post, lead-generation campaigns convert at 0.77%, and only 16% of social users treat X as a product-discovery channel versus 61% on Instagram. Against a pest control cost per lead of $150–250, X can supply cheap impressions but rarely booked jobs.
What is the cost per lead on X compared to other platforms?
Benchmark data puts X cost per lead at $41, against $82 on LinkedIn, $24 on Facebook and $20 on TikTok — with marketers reporting 34% lower lead quality on X than LinkedIn. Cheap leads that do not close are more expensive than dear leads that do.
How many people use X in 2026?
Statista and X Corp figures give 611 million monthly active users worldwide and 259 million daily, with 95.4 million in the United States. Separately, SpaceX’s May 2026 S-1 disclosed 550 million monthly actives across the combined X plus Grok ecosystem, so cite the scope you mean. Pew data shows 21% of US adults use X.
What is the one legitimate use of X for a pest control business?
Keyword targeting and reputation monitoring. Keyword targeting based on recent posts and searches is unique to X and delivers about 31% higher CTR than interest targeting, and X remains the fastest channel for spotting service complaints. Vertical video ads also perform about 28% better than horizontal, so existing short-form creative can be reused at almost no cost.
Sources
SearchLab — X (Twitter) Statistics 2026
Digital Applied — X Platform Statistics from the SpaceX S-1
Enrich Labs — Twitter/X Benchmarks
Onclusive — X (Twitter) Statistics 2026
Christoph Olivier Consulting — X Ads in 2026
AdWave — X for Small Business
Cube Creative — Pest Control Cost Per Lead 2026
SocialPilot — Twitter/X Statistics