Table of contents

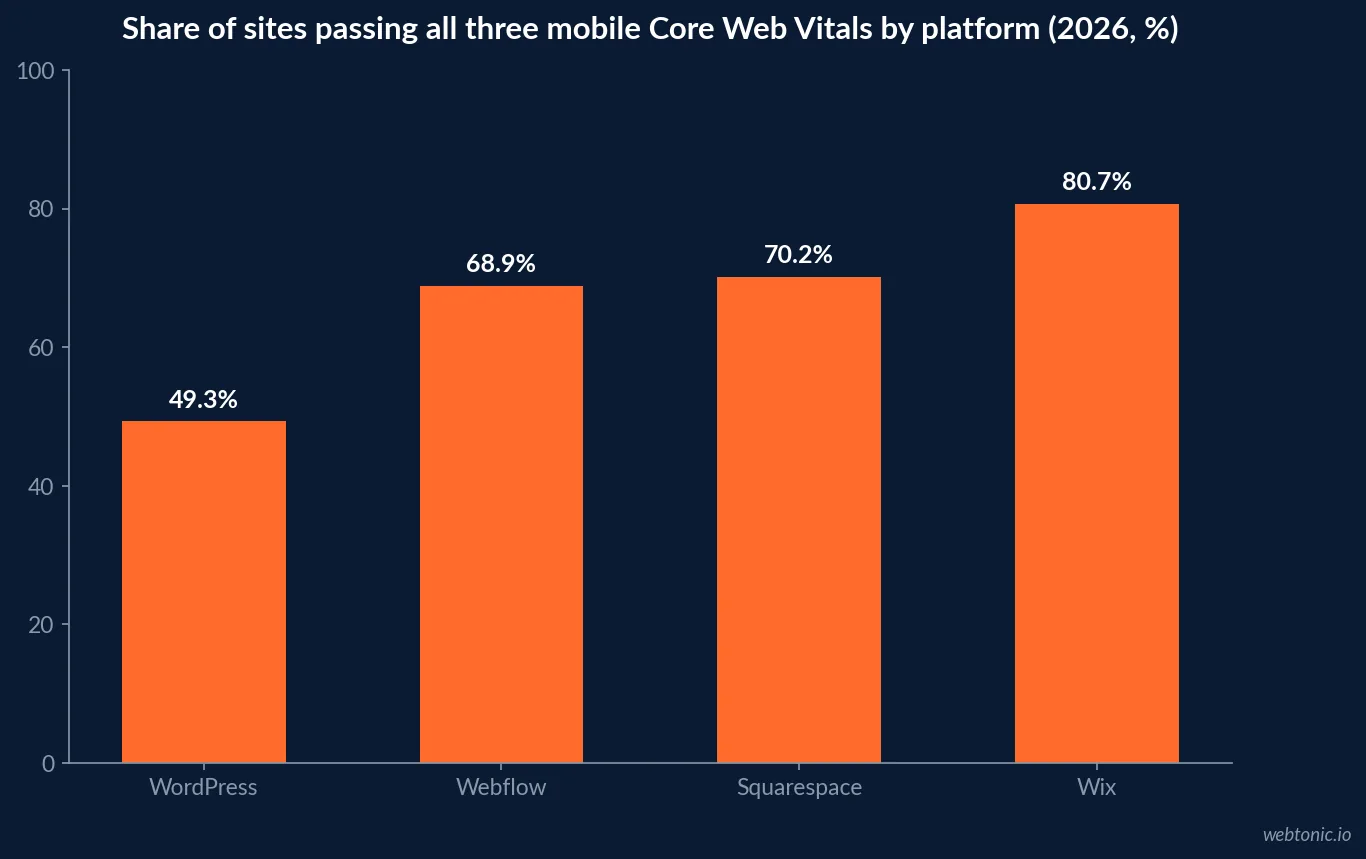
68.9% of Webflow sites pass all three mobile Core Web Vitals against 49.3% of WordPress sites — a 19.6-point gap that only pays for itself if your pest control site is currently converting at 2% when it could be converting at 4%.
Key Takeaways
- Webflow powers about 822,550 live websites in 2026.
- That is 0.8% of all websites and roughly 1.2% CMS share.
- Webflow site count is up from 544,053 two years earlier.
- The US accounts for 160,696 Webflow sites.
- Webflow revenue reached $213 million, up 66%.
- Webflow ecommerce stores grew 647.81% over three years to 12,501.
- 68.9% of Webflow sites pass mobile Core Web Vitals.
- WordPress passes on 49.3%, Squarespace 70.2%, Wix 80.7%.
- Good mobile TTFB: Webflow 55.5% versus WordPress 24.8%.
- Webflow ships the lightest combined mobile payload: 918 KB JS plus 855 KB images.
- Squarespace ships 1,571 KB and Wix 1,707 KB of mobile JS.
- Webflow’s LCP at the 75th percentile is 1.7s versus WordPress at 2.7s.
- 53% of users abandon pages that take over three seconds.
- A one-second delay cuts conversions by about 20%.
- Each extra form field costs roughly 4% of completions.
- The form-field sweet spot is 4–6 fields.
- Authentic video on a landing page lifts conversions 80–86%.
- The average homeowner calls only 1.3 businesses before booking.
- Q2 delivers 26.4% of annual pest control revenue.
- 96% of consumers search online before buying a service.
- Pest control cost per lead runs $150–250 nationally.
- 95% of marketing leaders say website governance hurts their team.
Where Webflow Sits in 2026
Webflow is a small platform growing quickly, which is exactly the profile that produces overheated claims in both directions. It now powers roughly 822,550 websites — about 0.8% of the web, or one site in 125 — on $213 million of annual revenue, up 66% year over year at a $4 billion valuation. W3Techs data puts its CMS market share at 1.2%, double the 0.4% share it held in 2021.
| Webflow metric | 2026 figure | Comparison point |
|---|---|---|
| Live websites | 822,550 | Up from 544,053 two years earlier |
| Share of all websites | 0.8% | One site in 125 |
| CMS market share | 1.2% | WordPress remains above 60% of the CMS market |
| US Webflow sites | 160,696 | UK 14,891, Germany 14,510 |
| Annual revenue | $213M | Up 66% from $128M |
| Valuation | $4B | On $334.9M total funding |
| Ecommerce stores | 12,501 | Up 647.81% over three years |
| Marketing leaders citing governance problems | 95% | The real reason teams migrate |
For a pest control operator none of that is a reason to switch. The reason to look at Webflow is narrower: field-measured speed by default, and the ability for a marketing person to publish a new city or pest-type page without a developer ticket.
Core Web Vitals: Webflow Versus WordPress on Field Data
Lab tests are worthless in this comparison because they measure the software, not the deployment. Chrome UX Report field data via the HTTP Archive May 2026 crawl shows mobile Core Web Vitals pass rates of 80.7% for Wix, 70.2% for Squarespace, 68.9% for Webflow and 49.3% for WordPress, with good-TTFB shares of 66.9%, 80.8%, 55.5% and 24.8%.
| Platform (mobile field data) | Passes all 3 CWV | Good TTFB share | Median JS | Median images |
|---|---|---|---|---|
| Wix | 80.7% | 66.9% | 1,707 KB | 185 KB |
| Squarespace | 70.2% | 80.8% | 1,571 KB | 1,111 KB |
| Webflow | 68.9% | 55.5% | 918 KB | 855 KB |
| WordPress | 49.3% | 24.8% | 692 KB | 1,029 KB |
Webflow has the lightest combined JavaScript-plus-image payload of the four at 1,773 KB, consistent with clean generated markup and an automatic responsive-image pipeline. WordPress ships the least JavaScript but the second-heaviest images, which is why most WordPress speed wins are media wins. Its 24.8% good-TTFB share reflects hosting quality across the whole population, from $3 shared plans to managed clusters — the platform’s ceiling is the highest of the four and its floor is by far the lowest. We covered that trade-off in detail in our pest control WordPress statistics analysis.
The Sample-Size Caveat Most Comparisons Skip
A second 2026 field dataset reports Webflow passing LCP on 100% of measured sites with a 1.7s 75th-percentile LCP, 110ms INP and 0.00 CLS — against WordPress at 2.7s LCP and a 69.5% pass rate. The Webflow figure comes from only 15 qualifying origins in that sample, against 59,040 WordPress origins, so it is directionally supportive and statistically thin. Cite the 68.9% population figure when the number has to hold up.
| Dataset | Webflow result | WordPress result | Sample caveat |
|---|---|---|---|
| HTTP Archive / CrUX, May 2026 | 68.9% pass all 3 CWV | 49.3% pass all 3 CWV | Population-wide, use this one |
| State of Web Vitals, Q2 2026 | 100% pass LCP, 1.7s p75 | 69.5% pass LCP, 2.7s p75 | Only 15 Webflow origins |
| Good mobile TTFB share | 55.5% | 24.8% | Hosting-driven for WordPress |
| Median mobile JS payload | 918 KB | 692 KB | WordPress lighter on script |
| Median mobile image payload | 855 KB | 1,029 KB | Webflow converts to WebP natively |
Webflow’s known weak points are worth stating plainly: dynamic pages carrying forms or membership logic slow down measurably, there is no native AVIF support, and one Lottie animation can add 200 KB to 2 MB to a page. A bloated Webflow build loses to a lean WordPress build every time.
What Speed Is Actually Worth on a Pest Control Site
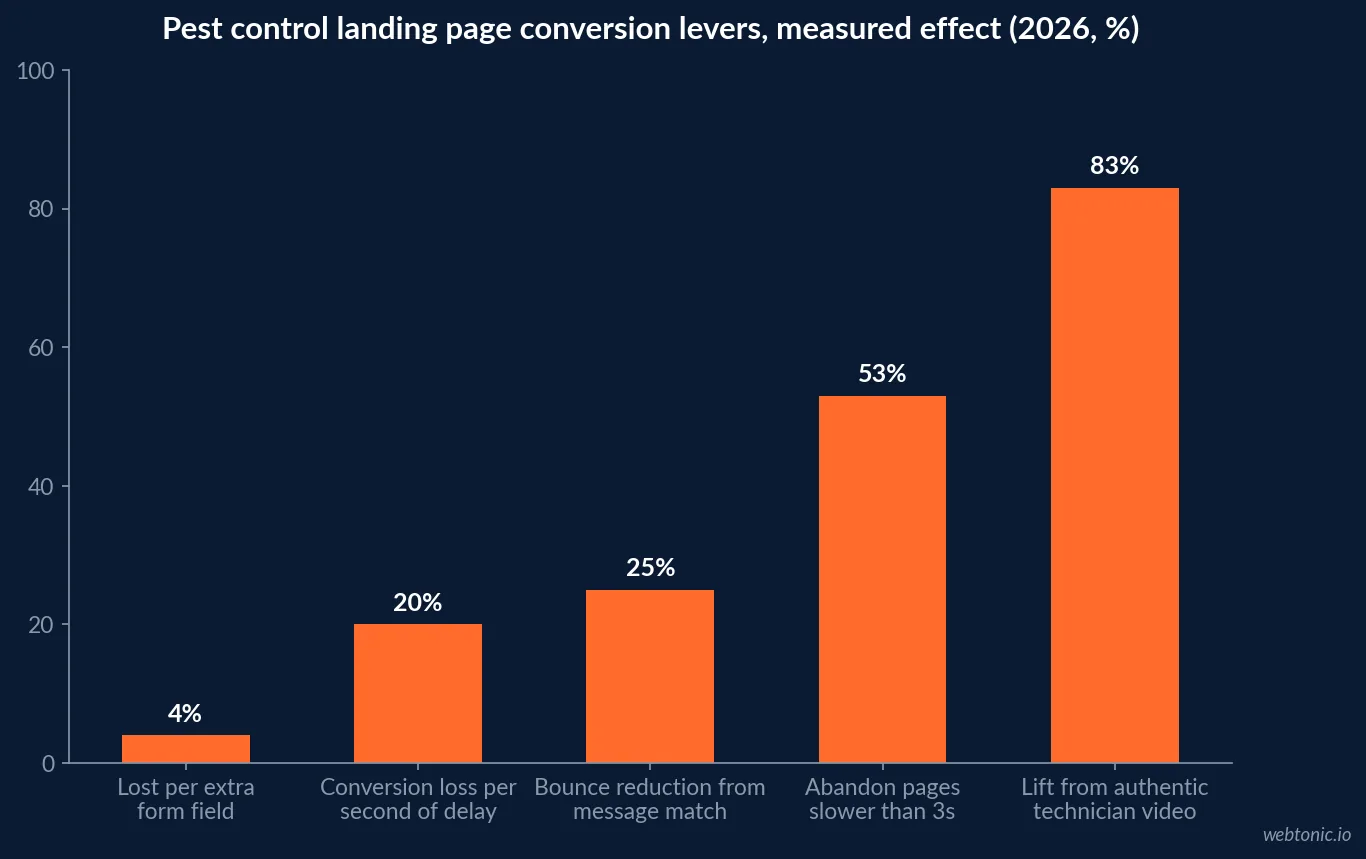
Platform choice only earns its migration cost through conversion. Pest control landing-page research reports 53% of users abandoning pages slower than three seconds, one-second delays cutting conversions about 20%, each extra form field costing roughly 4% of completions, and authentic video lifting conversions 80–86%. It also puts Q2 at 26.4% of annual revenue and notes that the average consumer calls only 1.3 businesses before deciding.
| Conversion lever | Measured effect | Platform-dependent? | Priority |
|---|---|---|---|
| Sub-three-second mobile load | 53% abandon above 3s | Partly — defaults differ by platform | First |
| Each second of delay | About 20% fewer conversions | Partly | First |
| Form length at 4–6 fields | About 4% lost per extra field | No | Immediate, free |
| Message match to ad copy | 20–30% lower bounce | No | Immediate, free |
| Authentic technician video | 80–86% conversion lift | No | High |
| Google Verified badge and reviews | Trust signal on high-intent traffic | No | High |
| Click-to-call above the fold | Calls close at 46% in home services | No | High |
Run the arithmetic before the rebuild. A site taking 3,000 monthly visits at 2% produces 60 inquiries; at 4% it produces 120. At a national cost per lead of $150–250, those 60 extra inquiries represent $9,000–15,000 of equivalent monthly media value on unchanged traffic. That is the number that justifies a platform decision — not a pass rate.
Publishing Velocity: The Underrated Argument
The strongest Webflow case for a multi-location pest control operator is not milliseconds, it is throughput. 95% of marketing leaders say current website governance practices hurt their ability to manage sites, and 52% say they will prioritise optimising for AI-driven search this year. Both problems are publishing-speed problems.
One documented enterprise migration from WordPress to Webflow reported 12.7% more pageviews, a 27.9% lower bounce rate, 9.5% more new users and 3.4% more pages per session, with routine edits dropping from four to five developer hours to about 20 minutes. For a pest control company that needs a page per city and per pest type, that ratio compounds faster than any Core Web Vitals delta.
| Operational metric after migration | Reported change | Pest control equivalent |
|---|---|---|
| Pageviews | +12.7% | More indexed city and pest-type pages |
| Bounce rate | −27.9% | Faster first paint on mobile ad traffic |
| New users | +9.5% | Wider long-tail organic coverage |
| Pages per session | +3.4% | Service cross-selling from ants to termites |
| Time to make a routine edit | 4–5 hours to 20 minutes | Seasonal offers shipped inside the swarm window |
Publishing velocity is what lets you have the page live before the termites swarm rather than three weeks after. That is the same reasoning behind how we build performance creative and landing systems for local service brands.
What a Pest Control Site Has to Do Regardless of Platform
Platform arguments distract from the fixes that pay first, and none of them require a migration. Pest control demand is urgent, mobile and comparison-shy: 96% of consumers search online before buying a service, 68–70% of pest inquiries start on a smartphone, and the average homeowner calls only 1.3 businesses. That means the mobile page has one chance and roughly three seconds to take it.
| Fix | Effort | Platform needed | Expected effect |
|---|---|---|---|
| Cut the form to 4–6 fields | One hour | Any | About 4% recovered per field removed |
| Click-to-call in a sticky mobile header | One hour | Any | Captures the 46% close rate on calls |
| Match the headline to the ad copy | 15 minutes per page | Any | 20–30% lower bounce |
| Replace stock imagery with technician photos | One shoot | Any | Trust signal on high-intent traffic |
| Add a 30-second technician video | One phone recording | Any | 80–86% conversion lift |
| Compress and lazy-load hero media | Half a day | Any | Direct LCP improvement |
| Publish city and pest-type pages at speed | Ongoing | CMS-dependent | Long-tail organic coverage |
| Move off shared hosting | One migration | WordPress | TTFB is 24.8% good in the field |
Only the last two lines in that table are genuinely platform questions. Everything above them is available on the site you already own, and most pest control operators leave those points on the table while debating a rebuild. Fix the free ones first, measure for a full month, then decide whether the remaining gap is a platform gap at all.
Should a Pest Control Company Move to Webflow?
Four decision rules, in order:
- Do not migrate if your current site already loads under three seconds on mobile and converts above 4%. Fix forms and trust signals instead — both are free.
- Consider migrating if you are on cheap shared hosting, since only 24.8% of WordPress origins hit good mobile TTFB in the field.
- Migrate if publishing a city page takes a developer ticket and you need dozens of them for a 26.4%-of-revenue Q2.
- Stay on WordPress if you have a developer and want the highest ceiling: premium hosting plus a lightweight theme beats every closed platform on LCP.
Whichever way it goes, decide it on measured conversion and lead cost rather than platform loyalty. If you want the numbers for your own site read against these benchmarks, get in touch and we will run them with you, alongside the tracking setup our data intelligence team uses to make the comparison honest.
Frequently Asked Questions
Is Webflow faster than WordPress for a pest control website?
On field data, yes by default. Chrome UX Report data via the HTTP Archive May 2026 crawl shows 68.9% of Webflow sites passing all three Core Web Vitals on mobile against 49.3% of WordPress sites, with good-TTFB shares of 55.5% and 24.8% respectively. WordPress has the higher ceiling on premium hosting; Webflow has the higher floor, which matters more for a small operator without a developer on retainer.
How many websites use Webflow in 2026?
Roughly 822,550 live sites, about 0.8% of all websites and a CMS market share near 1.2%. That is up from 544,053 sites two years earlier, with the US accounting for 160,696 of them. Webflow reported $213 million of annual revenue, up 66% year over year, at a $4 billion valuation.
Will moving a pest control site to Webflow increase leads?
Only if the current site is losing leads to speed or publishing friction. Pest control landing-page research finds 53% of users abandon a page that takes over three seconds, a one-second delay cuts conversions about 20%, and each additional form field costs roughly 4% of completions. Moving from a 2% to a 4% conversion rate doubles leads on the same traffic and the same ad budget.
What are Webflow's weaknesses for a local service business?
Three real ones. Dynamic functionality (forms, memberships, ecommerce) adds weight to specific pages, there is no native AVIF support, and a single Lottie animation can add 200 KB to 2 MB. Field data also shows Webflow trailing Squarespace at 80.8% and Wix at 66.9% on good mobile TTFB, so the platform is not automatically the fastest choice.
How much of a pest control site's traffic is mobile?
Around 68–70% of pest control inquiries begin on a smartphone, and mobile is roughly 71% of home-services website visits. Because Google has indexed mobile-first since 2024, the mobile render is effectively the only version of the site that matters for both ranking and conversion.
Sources
Popupsmart — 50+ Webflow Statistics 2026
The Alien Design — Webflow Usage Statistics
PageSpeed Matters — WordPress vs Webflow vs Squarespace Speed
State of Web Vitals — CMS Impact, Q2 2026
W3Techs — Webflow Usage Report
Cube Creative — Pest Control Landing Page Optimization
Cube Creative — Pest Control Cost Per Lead 2026
The Stacc — WordPress vs Webflow SEO