Table of contents
TikTok sells the cheapest clicks in paid social in 2026 — a median $0.62 CPC — while a pest control lead costs $150–250 nationally. The gap between those two numbers is where most pest control TikTok budgets are won or wasted.
Key Takeaways
- Median TikTok CPC is $0.62, IQR $0.38–$1.04.
- A second in-feed-only dataset reports $1.02 average CPC.
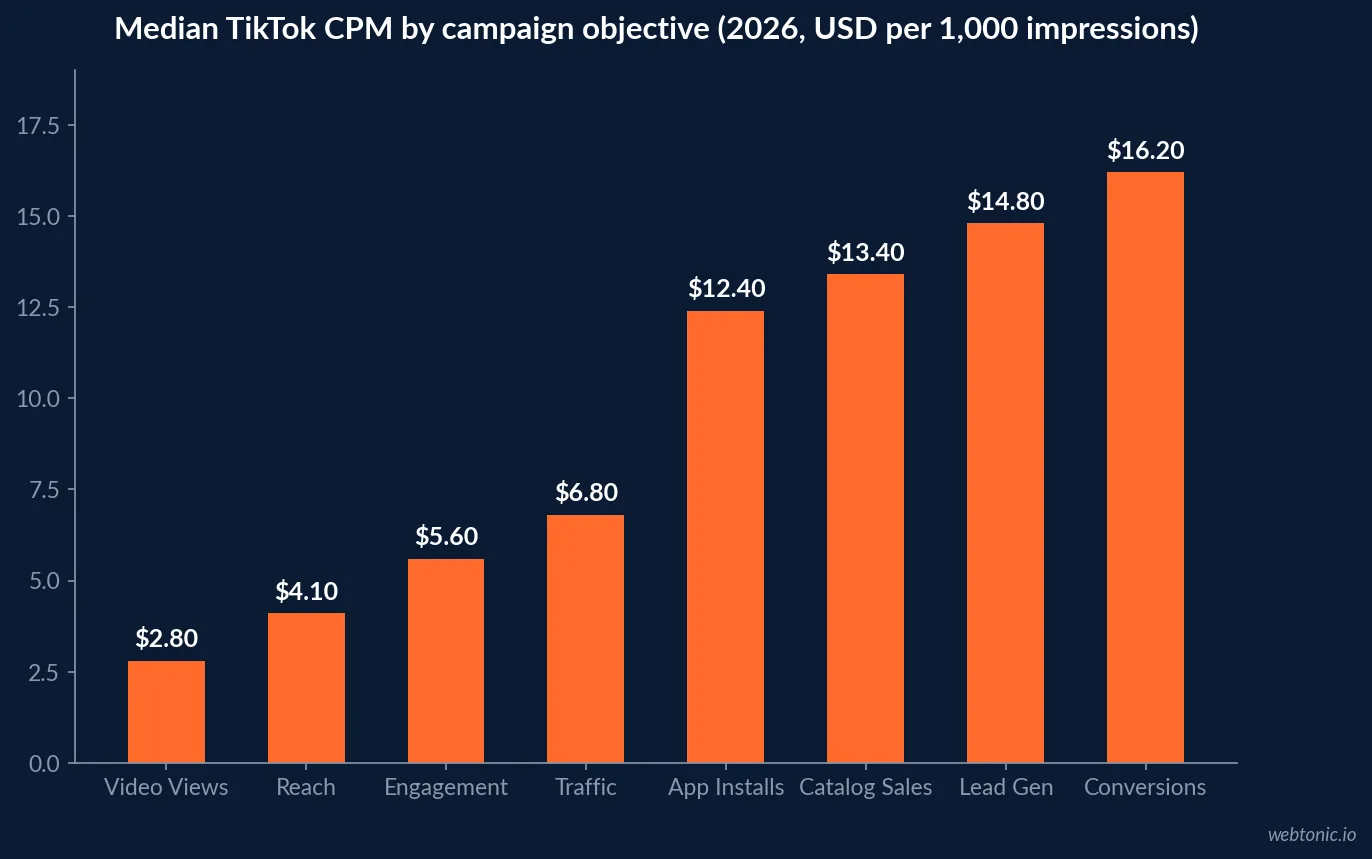
- Median CPM runs $4.10 for Reach to $16.20 for Conversions.
- Video Views is the cheapest objective at $2.80 CPM.
- TikTok CPMs are roughly 30–40% below matched Meta inventory.
- Median TikTok CTR is 1.18%, about 38% above Meta.
- Spark Ads hit 1.62% CTR versus 0.84% for standard in-feed.
- Spark Ads cost $0.47 per click versus $0.78.
- Spark video completion is 28.4% versus 16.1%.
- Median US local-services CPA on TikTok is $27.80.
- Local-services CPA IQR is $14.20–$48.60.
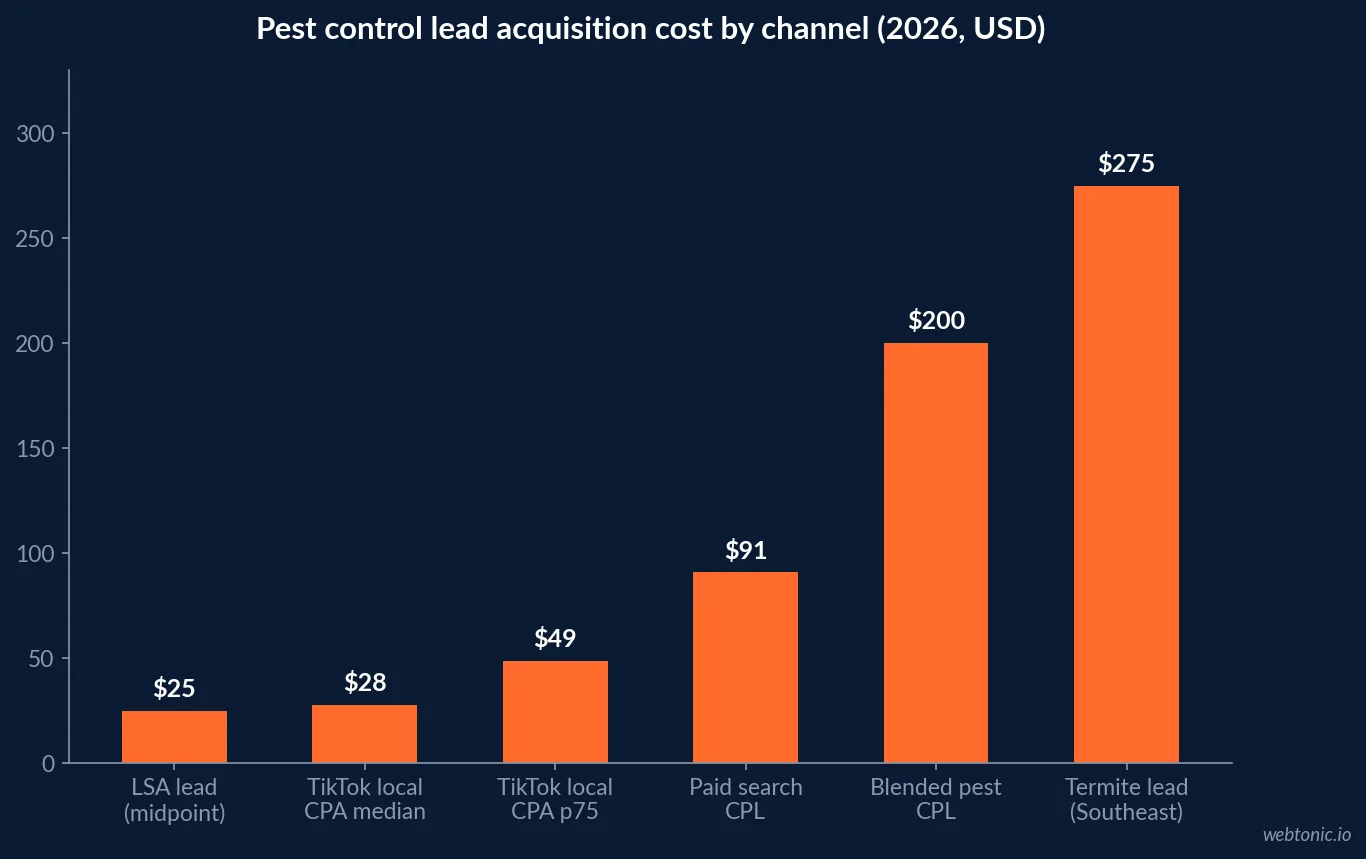
- Pest control cost per lead is $150–250 nationally.
- Local Services Ads deliver pest leads at $20–30.
- Organic SEO converts pest traffic at 14.6%.
- Home-services search CPL averaged $90.92, up 10.51%.
- TikTok has 1.04 billion monthly active users worldwide.
- 136 million Americans use TikTok monthly; 82.2 million daily.
- 33% of US adults have used TikTok; 59% of 18–29s.
- US adults average 52 minutes a day in the app.
- 21% of marketers rank short-form video as their highest-ROI format.
- Q2 carries 26.4% of annual pest control revenue.
- The average homeowner calls only 1.3 businesses before booking.
What TikTok Actually Charges in 2026
The useful pest control question is not “what does TikTok cost” but “what does TikTok cost for the objective a service business can actually use”. An aggregate of 3,127 campaigns from 548 advertisers spending $18.7 million between February and May 2026 puts median CPM at $4.10 for Reach, $6.80 for Traffic and $16.20 for Conversions, with median CPC at $0.62. Local services made up 13% of that dataset, which is unusually high for a TikTok benchmark study.
| TikTok objective | Median CPM | 25th–75th percentile | Read for a pest control account |
|---|---|---|---|
| Video Views | $2.80 | $1.40–$5.10 | Cheapest way to buy brand recall in a service area |
| Reach | $4.10 | $2.40–$6.80 | About 40% below matched Meta inventory |
| Engagement | $5.60 | $3.40–$8.90 | Useful only if comments are answered fast |
| Traffic | $6.80 | $4.20–$10.40 | The realistic workhorse objective |
| Catalog Sales | $13.40 | $7.80–$21.40 | Irrelevant — no product feed in pest control |
| App Installs | $12.40 | $7.40–$19.40 | Only for multi-branch operators with an app |
| Lead Generation | $14.80 | $8.40–$23.60 | Cheap impressions, lead quality is the limit |
| Conversions | $16.20 | $9.40–$26.10 | Needs volume most local accounts cannot feed |
Two credible CPC benchmarks circulate for 2026 and they differ by scope rather than by fact. The campaign-level aggregate above measures every placement and objective and lands on $0.62. A home-services-focused analysis citing in-feed placements only reports an average CPC of $1.02 with a practical range of $0.30–$1.50 and CPMs around $4.80. Budget against the higher figure and treat the lower one as the ceiling of what disciplined creative can reach.
Clicks and Click-Through Rates: TikTok’s Real Advantage
TikTok’s median CTR of 1.18% sits roughly 38% above matched Meta placements and ahead of Snapchat at 1.04%. For a pest control operator the attractive cell is the Traffic objective, where median CPC drops to $0.51. The Conversions objective costs $0.94 per click because the auction filter is tighter.
| Metric | Median | 25th–75th percentile | Note |
|---|---|---|---|
| CPC, all objectives | $0.62 | $0.38–$1.04 | Cheapest mainstream social click in 2026 |
| CPC, Traffic objective | $0.51 | $0.32–$0.84 | Best value for driving site sessions |
| CPC, Conversions objective | $0.94 | $0.58–$1.62 | Tighter auction filter |
| CTR, all objectives | 1.18% | 0.74%–1.86% | About 38% above Meta |
| CTR, Spark Ads | 1.62% | 1.04%–2.48% | Biggest single lever on the platform |
| CTR, standard in-feed | 0.84% | 0.52%–1.34% | Acceptable, clearly weaker |
Cheap clicks are only useful if the landing experience holds them. Pest control landing-page research finds 53% of users abandon a page that takes more than three seconds to load, each extra form field costs roughly 4% of completions, and the 4–6 field range is the practical sweet spot. A $0.51 click into a five-second page is an expensive click.
Spark Ads: The Format Gap Nobody Budgets For
Spark Ads run an existing organic post — yours or a creator’s — as paid inventory, keeping the handle, comments and native feel. The performance delta is the largest single variable in TikTok cost data, and it is partly self-selection: teams that run Spark Ads tend to have better creative discipline. Even inside accounts running both formats in the same period, Spark still beats standard in-feed by roughly 1.5x on CTR and 1.25x on CPA.
| Metric | Spark Ads | Standard in-feed | Spark advantage |
|---|---|---|---|
| Median CTR | 1.62% | 0.84% | 1.92x |
| Median CPC | $0.47 | $0.78 | 1.66x cheaper |
| Median CPM | $6.20 | $7.40 | 1.19x cheaper |
| Median CPA (commerce) | $12.40 | $17.20 | 1.39x cheaper |
| Video completion rate | 28.4% | 16.1% | 1.76x higher |
| Share of campaigns | 47% | 53% | Adoption still under half |
For pest control the implication is operational, not creative: post the treatment footage organically first, let the algorithm sort it, then put money behind the videos that already earned watch time. That is a different workflow to the one most agencies run on Meta Ads, where creative is built for the ad account rather than the feed.
The Lead Math: $27.80 CPA Against a $150–250 Pest Lead
This is where TikTok either justifies itself or does not. Regional 2026 benchmarks put the national pest control cost per lead at $150–250, with Google Local Services Ads at $20–30 per lead, organic SEO converting at 14.6%, termite leads justifying $200–350 and mosquito leads as low as $40–70. Against that, TikTok’s median US local-services CPA of $27.80 looks excellent — until you check what is being counted.
| Channel | 2026 cost per lead or CPA | Intent quality | Where it fits |
|---|---|---|---|
| Google Local Services Ads | $20–30 | Emergency, ready to book | Always-on core |
| TikTok, local services median CPA | $27.80 | Interrupted, unqualified | Demand creation |
| TikTok, local services IQR | $14.20–$48.60 | Highly creative-dependent | Test budget only |
| Organic SEO | Time and content cost | High, 14.6% conversion | Compounding asset |
| Home-services paid search | $90.92 average | High, keyword-matched | Scaled acquisition |
| Pest control national blended CPL | $150–250 | Mixed | Board-level benchmark |
| Southeast termite leads | $200–350 | Very high ticket | Margin justifies the price |
| Mosquito treatment leads | $40–70 | Seasonal, price-led | Volume filler |
The $27.80 figure is a platform-attributed soft conversion in a mostly commerce dataset, not a booked pest control job. Multiply it by a realistic lead-to-job rate and TikTok stops looking like a cheaper Local Services Ads. It starts looking like what it is: an inexpensive way to build recognition ahead of the moment a homeowner searches. Measurement discipline is the whole game here, which is why we push clients toward tracked-call attribution through data intelligence before they scale any social channel.
Audience: Big Reach, Wrong Moment
TikTok reports 1.04 billion monthly active users worldwide, 136 million monthly and 82.2 million daily in the US, with 33% of US adults having used the platform and 59% of 18–29 year olds. US adults average 52 minutes a day in the app. North America accounts for 122.4 million monthly users, or 11.8% of the global base.
The mismatch is life stage, not size. Pest control revenue concentrates in homeowners, and TikTok’s heaviest usage still skews young and urban with a majority of watch time in entertainment categories. Targeting a service radius on TikTok is possible but blunt, so the platform works best for recognisable, repeatable formats rather than tight geographic precision.
The Formats That Travel in Home Services
Home-services video analysis reports 21% of marketers rank short-form video as their highest-ROI content format, 78% of users prefer short video to learn about a service, and a single pressure-washing account passed 5 million views on one video with zero ad spend. Pest control has the same visual advantage: infestations are dramatic, treatments are visible, and technicians explain things buyers are afraid to ask.
| Content format | Why it works on TikTok | Production cost | Use as paid? |
|---|---|---|---|
| Before-and-after treatment | Visible transformation, no narration needed | Phone footage | Yes, Spark |
| Technician walkthrough | Defuses fear of being overcharged | One take, 60 seconds | Yes, Spark |
| Pest identification tips | Matches self-diagnosis searches | Low | Occasionally |
| Seasonal swarm warnings | Rides Q2 urgency | Low | Yes, timed to April–May |
| Staged studio ads | Reads as an ad, gets skipped | High | No |
Two mechanics decide whether views become calls: name the city in the caption so location signals fire, and put the phone number and service area in the bio on every post. The average homeowner calls only 1.3 businesses before deciding, so being recognised is most of the work.
Seasonality: Spend Where the Revenue Is
Pest demand is a biological calendar, not a marketing preference. Q2 captures 26.4% of annual revenue, running about 20% above Q1 and concentrating in the second through fourth weeks of April and the first three weeks of May. Search CPCs in the same window climb 40–60% in competitive metros, which is exactly when a $0.51 TikTok click is worth having in the mix.
| Period | Demand signal | TikTok role | Budget posture |
|---|---|---|---|
| January–February | Winter trough, rodent exclusion | Build content library | Organic only |
| March | Shoulder season, contracts signed | Awareness for annual plans | Ramp to 5% of paid |
| April–May | Peak swarm, 26.4% of annual revenue in Q2 | Reach and recall ahead of search | Full test budget |
| June–August | Mosquito and scorpion demand | Seasonal offer amplification | Hold |
| September–December | Rodent season, retention | Retargeting and reviews | Taper |
A Defensible 30-Day TikTok Test
Treat TikTok as a capped experiment with a measurement plan, not a channel migration. Cap it at 5% of paid budget, run a Traffic or Video Views objective, publish organically first and amplify only proven posts through Spark. Judge it on tracked calls and booked jobs rather than platform conversions, and give it the $100 minimum spend and five consecutive delivery days the auction needs to produce signal.
- Publish 12–16 organic videos before spending anything.
- Amplify the top 2–3 posts as Spark Ads at $20/day.
- Keep videos under 15 seconds — longer creative is the most common cause of CPAs at 2–3x the median.
- Shoot vertical only; repurposed horizontal creative is the second most common cause.
- Route every click to a page with 4–6 form fields and a sub-three-second mobile load.
- Compare cost per tracked call against your Local Services Ads baseline of $20–30, not against CPC.
If the test clears, the scaling path is more creative volume rather than higher bids — the discipline we apply across growth marketing engagements. If it does not, you have learned it for the price of a fortnight of search spend. Either outcome is worth more than an untested assumption, and we are happy to review the numbers with you.
Frequently Asked Questions
How much do TikTok ads cost for a pest control company in 2026?
Expect a median cost per click around $0.62 across objectives, with an interquartile range of $0.38 to $1.04, and CPMs from $4.10 for Reach to $16.20 for Conversions. A second benchmark set built on in-feed placements only reports $1.02 average CPC and $4.80 CPM, so plan a budget between $0.60 and $1.10 per click and read cost per lead, not cost per click.
Is TikTok cheaper than Google Ads for pest control leads?
Per click, dramatically. Home-services search leads averaged $90.92 in the most recent LocaliQ analysis of more than 3,200 campaigns, up 10.51% year over year, while TikTok in-feed clicks average about $1.02. Per booked job the gap narrows: TikTok’s median US local-services CPA is $27.80 for a soft conversion, and pest control national cost per lead sits at $150–250 with Local Services Ads at $20–30.
What is the best TikTok ad format for a pest control business?
Spark Ads — paid amplification of a real organic post. Aggregate data across 3,127 campaigns shows Spark Ads deliver 1.62% CTR versus 0.84% for standard in-feed ads (1.92x), a $0.47 CPC versus $0.78, and 28.4% video completion versus 16.1%. Before-and-after treatment footage and technician walkthroughs are the formats that travel.
Does TikTok work for emergency pest control demand?
Not directly. TikTok is an interruption channel: it creates demand rather than capturing it, and pest emergencies convert on search and phone calls. Q2 alone carries 26.4% of annual pest control revenue and the average homeowner calls only 1.3 businesses before deciding, so TikTok’s job is to be the brand they already recognise when the swarm shows up.
What TikTok budget should a pest control operator start with?
TikTok enforces a $20/day ad-group and $50/day campaign minimum, but the auction needs at least $100 of spend and five consecutive delivery days to produce a usable signal. A defensible first test is 5% of paid budget over 30 days on a Traffic or Video Views objective, measured on tracked calls rather than platform conversions.
Sources
AdLiftr — TikTok Ads Cost Benchmarks 2026
Digital Applied — TikTok Ads Benchmarks 2026
PipelineOn — Short-Form Video for Home Service Contractors
Cube Creative — Pest Control Cost Per Lead 2026
Cube Creative — Pest Control Landing Page Optimization
Backlinko — TikTok Statistics 2026
SocialPilot — TikTok Statistics
Hook Agency — TikTok Benchmarks for Contractors