Table of contents
Pest control websites convert better than any other trade — 12–15% of visitors into a tracked call or form — which makes every technical defect more expensive here than almost anywhere else in home services.
Key Takeaways
- Pest control and plumbing lead the trades at 12–15% site conversion.
- The median contractor site converts only 2–4% of visitors.
- The top 6% of contractor sites reach 8–12% on identical traffic.
- Mobile is 71% of home-services website visits.
- Each extra second of mobile load costs about 7% of conversions.
- A five-second mobile load loses roughly 35% of leads versus one second.
- 42% of websites pass all three Core Web Vitals in HTTP Archive data.
- CrUX origin data shows 51.3% passing on mobile, up from 43.2%.
- Desktop pass rate is 67.8% versus mobile at 51.3%.
- Individually: CLS 74%, INP 65%, LCP 58%.
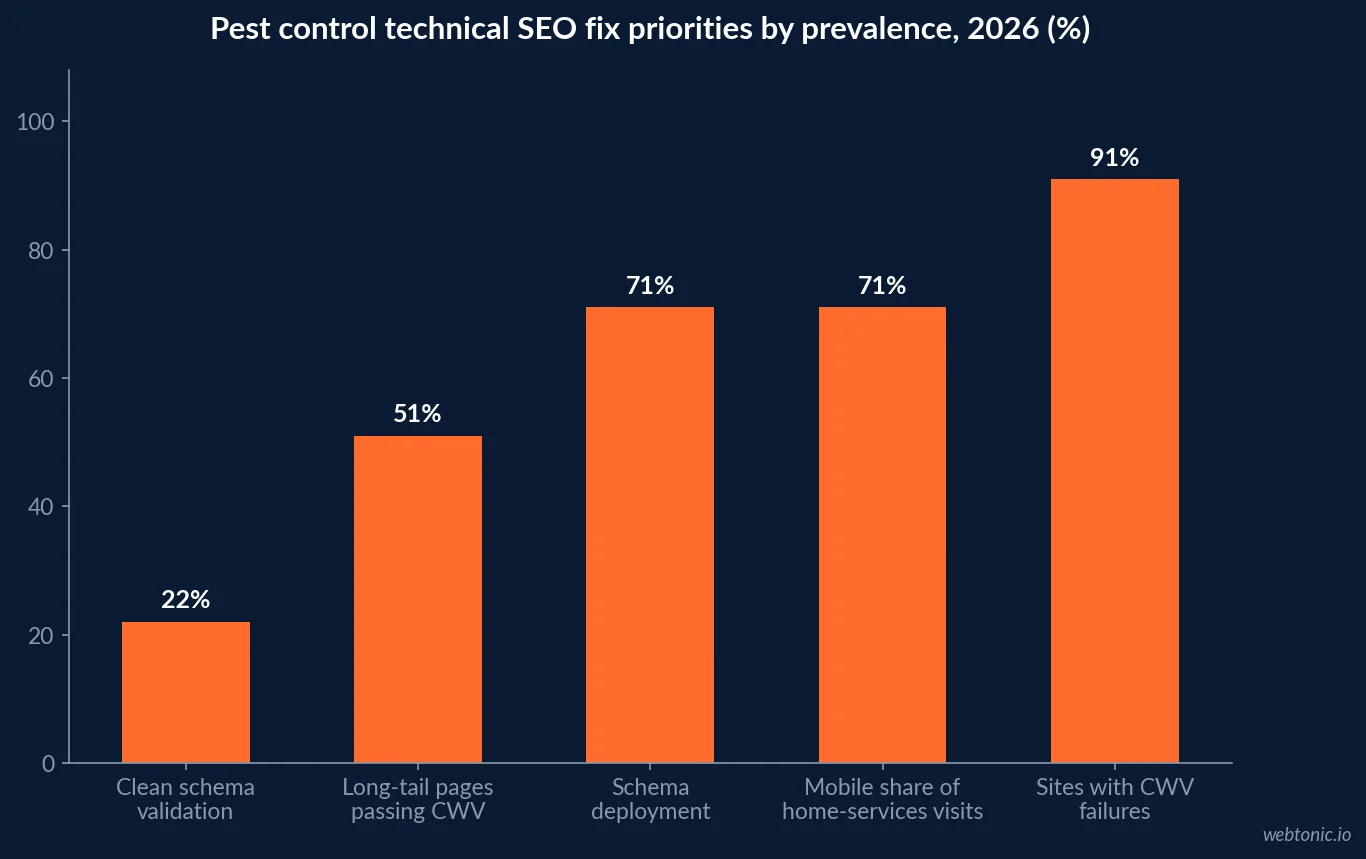
- Core Web Vitals failures appear on 91% of audited sites.
- Long-tail pages pass CWV at 51% versus 84% for homepages.
- Median mobile LCP is 3.8s against 2.1s on desktop.
- Top-10 Google results load in a median 1.65 seconds.
- 95.6% of top-10 pages use HTTPS.
- 71% of sites deploy schema but only 22% validate cleanly.
- Valid schema correlates +0.34 with AI-search citation rate.
- Article plus BreadcrumbList schema produces a +47% citation lift.
- Missing required properties cause 38% of schema errors.
- 68–70% of pest control inquiries start on a smartphone.
- 76–88% of local smartphone searchers act within 24 hours.
- Phone calls close at 46%, with 37% converting on the first call.
Pest Control Has the Best Conversion Rate in the Trades — and the Most to Lose
Most technical SEO arguments in home services stall because nobody prices the downside. The median contractor website converts 2–4% of visitors while the top 6% reach 8–12% on identical traffic, and plumbing and pest control lead all trades at 12–15% site conversion because of emergency-driven demand and short decision cycles. That same analysis puts mobile at 71% of home-services visits and the cost of latency at roughly 7% of conversions per additional second.
| Conversion benchmark | 2026 figure | Implication for pest control |
|---|---|---|
| Median contractor site conversion | 2–4% | Most sites waste 96–98% of traffic |
| Top 6% of contractor sites | 8–12% | Execution gap, not traffic gap |
| Plumbing and pest control | 12–15% | Highest ceiling of any trade |
| Construction and remodeling | 3.65–7% | Longer buying cycle |
| General contracting average | 2.61% | Baseline for comparison |
| Phone call close rate | 46% | Speed to answer beats site polish |
| First-call close share | 37% | Click-to-call must be instant |
| Mobile share of visits | 71% | Mobile render is the product |
Run the arithmetic on a site doing 3,000 monthly visits at 12%: that is 360 inquiries. A three-second mobile load instead of one shaves roughly 14% of them — about 50 lost inquiries a month before a single ranking changes.
Core Web Vitals: Two Datasets, One Conclusion
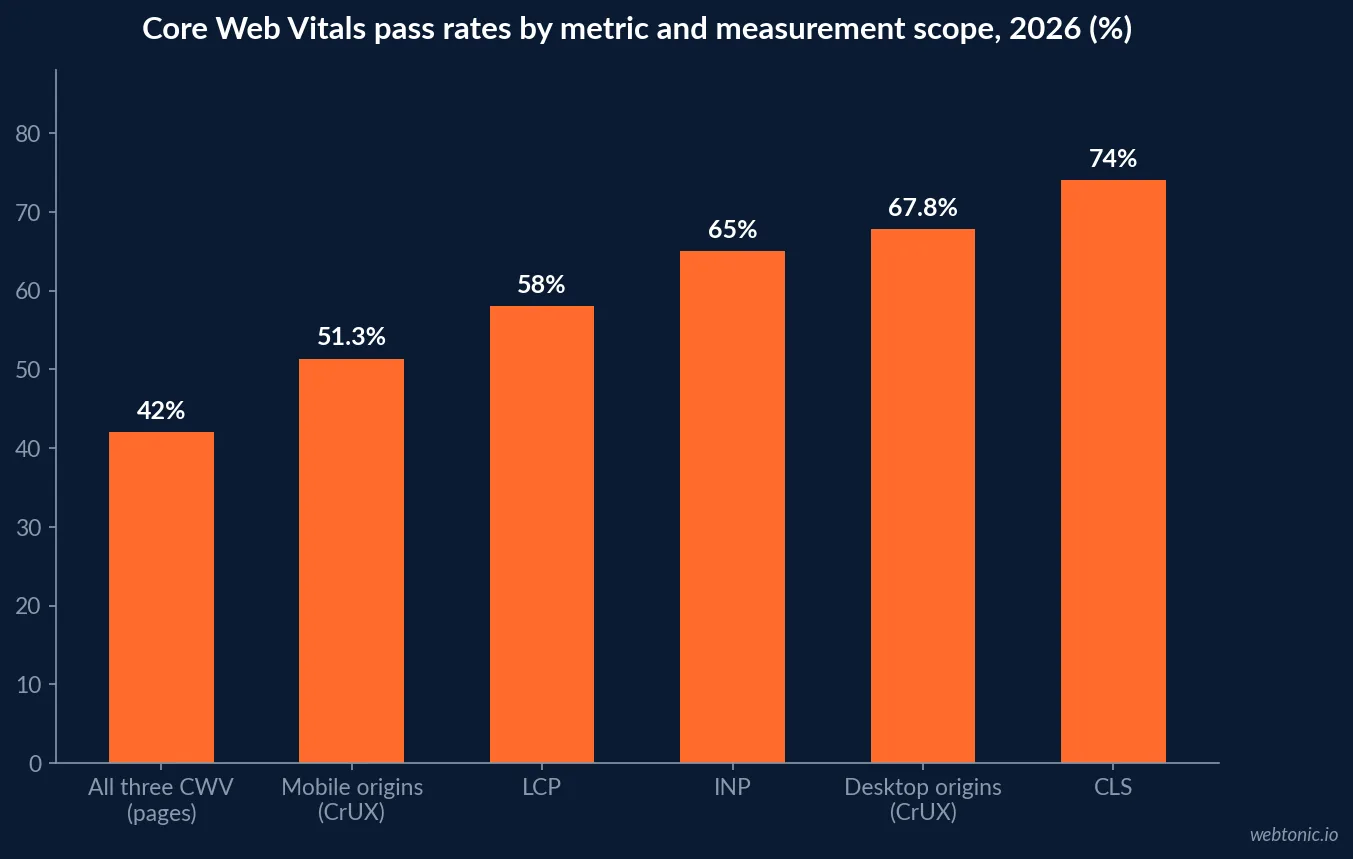
The headline pass rate depends on what is being counted. HTTP Archive and Chrome UX Report analysis reports 42% of websites passing all three Core Web Vitals, with CLS at 74%, INP at 65% and LCP at 58%, and a median top-10 load time of 1.65 seconds. Origin-level CrUX data for June 2026 puts 51.3% of origins passing on mobile, up from 43.2% a year earlier, and 67.8% on desktop. The difference is scope — page-level crawls versus traffic-weighted origins — not contradiction.
| Measurement | Scope of what is counted | Pass rate |
|---|---|---|
| All three CWV, HTTP Archive / CrUX pages | Crawled pages across the web | 42% |
| All three CWV, CrUX origins (mobile) | Traffic-eligible origins | 51.3% |
| All three CWV, CrUX origins (desktop) | Traffic-eligible origins | 67.8% |
| CLS only | Crawled pages | 74% |
| INP only | Crawled pages | 65% |
| LCP only | Crawled pages | 58% |
| Homepages in aggregate crawl data | Site entry pages | 84% |
| Long-tail pages in aggregate crawl data | Deep service and blog pages | 51% |
The long-tail gap is the pest control problem specifically. Aggregate crawl data ranks Core Web Vitals failures as the most common issue found, present on 91% of sites and affecting 34% of URLs, with homepages passing at 84% against 51% for long-tail pages. City pages and pest-type service pages are long-tail pages, and they are where local rankings are won.
Mobile-First Is Not a Recommendation for This Trade
Pest control demand arrives on a phone, mid-panic. Roughly 68–70% of pest control and home service inquiries originate from smartphones and an estimated 76–88% of local smartphone searchers contact or visit a business within 24 hours, in a $26.1 billion US market split across about 32,700 firms.
| Mobile technical fact | 2026 figure | Fix priority |
|---|---|---|
| Mobile-first indexing coverage | 100% of sites since July 2024 | Audit the mobile render only |
| Median mobile LCP | 3.8 seconds | Preload hero image, use a CDN |
| Median desktop LCP | 2.1 seconds | Desktop hides the real problem |
| Mobile TTFB median | 1.4 seconds | Hosting and caching first |
| Average page weight | 2.3 MB (images 48%) | Convert to WebP or AVIF |
| Bounce at 3-second load | +32% versus 1 second | Speed is a lead metric |
| Sites missing viewport tag | Treated as not mobile-friendly | One-line fix, large loss |
| Tap targets under 48px | Reported on 23% of scanned sites | Click-to-call button sizing |
Next-generation image formats alone cut file size 30–50% without visible quality loss, and a CDN reduces average TTFB by about 52% while improving LCP roughly 33%. Neither requires a redesign, which is why they belong ahead of any visual refresh in the queue.
Schema: Deployed Almost Everywhere, Valid Almost Nowhere
Structured data has become the cheapest technical lever with a measurable AI-search payoff. A 5,000-site audit across eight CMS platforms found 71% of sites deploy at least one schema type while only 22% pass the Rich Results Test cleanly across every emitted type — a 49-point gap — with a +0.34 Pearson correlation between clean validation and AI-search citation rate. Article plus BreadcrumbList together produced a +47% citation lift.
| Schema finding | Figure | Pest control action |
|---|---|---|
| Sites deploying at least one type | 71% | Deployment is table stakes |
| Sites passing Rich Results cleanly | 22% | Validate every template |
| Sites in the deploy-but-broken middle | 49% | Where most local sites sit |
| Correlation with AI citation rate | +0.34 Pearson r | Answer-engine visibility lever |
| Article + BreadcrumbList citation lift | +47% | Apply to pest guides |
| Missing required properties | 38% of error pages | Most common single defect |
| Invalid ISO-8601 dates | 24% of errors | Automate date output |
| Wrong @type for page content | 12% of errors | Service, not Product, pages |
| WordPress adoption rate | 78% | Plugins emit a broken baseline |
For a service-area exterminator the useful stack is narrow: LocalBusiness or PestControlService with full NAP and service area, Service entities per pest type, FAQPage on the pages that answer buyer questions, BreadcrumbList across the city-page hierarchy, and Article on guides. Research into the local schema gap finds the same pattern: local sites emit a plugin default and never validate it.
Crawling, Indexing and the City-Page Trap
Pest control SEO strategies almost always produce page volume: one page per city, one per pest, one per service. That is a crawl-budget and duplication problem before it is a content problem. Sector SEO guidance is explicit that location and service pages must carry genuinely distinct content rather than templated swaps, and pest control benchmark data shows operators with optimised profiles and location-specific service pages consistently outperforming competitors relying on a single homepage, with first-page rankings taking 3–5 months in low-competition markets and 5–8 months in mid-competition ones.
| Indexing signal | Benchmark | What to check on a pest control site |
|---|---|---|
| Pages not indexed, enterprise sites | 26% | Coverage report by page template |
| Pages not indexed, small sites | 4% | Thin city pages are the usual cause |
| Sites with an XML sitemap | 67% | Split sitemaps by template |
| HTTPS in Google top 10 | 95.6% | Non-negotiable baseline |
| Responsive sites | 92% | Retire any m-dot subdomain |
| CWV pass, long-tail pages | 51% | Audit city pages, not the homepage |
| Ranking timeline, low competition | 3–5 months | Launch before the spring peak |
| Ranking timeline, mid competition | 5–8 months | Plan budget accordingly |
Seasonality changes the sequencing. Winter months run at 30–60% of peak-season volume, and demand rises from March, so technical work completed in January is compounding by June. The same phasing logic drives how we schedule data intelligence and site-health work for seasonal businesses.
The Fix Order That Pays Fastest
Technical audits typically return a hundred findings in no useful order. Ranked by the published impact figures rather than by tool severity, the queue for a pest control site is short and unambiguous.
| Priority | Fix | Evidence | Effort |
|---|---|---|---|
| 1 | Mobile LCP under 2.5s on city pages | 7% of conversions per second | Medium |
| 2 | CDN plus caching for TTFB | TTFB −52%, LCP +33% | Low |
| 3 | WebP or AVIF conversion | 30–50% smaller files, images are 48% of weight | Low |
| 4 | Validate existing schema | Only 22% of sites pass cleanly | Low |
| 5 | Add Article + BreadcrumbList to guides | +47% AI citation lift | Low |
| 6 | Differentiate city and pest pages | 26% non-indexed on large sites | High |
| 7 | Fix tap targets and click-to-call | 23% of sites flagged; calls close at 46% | Low |
| 8 | Repair INP on script-heavy pages | INP passes on only 65% of pages | Medium |
Items two, three, four and five are days of work, not a rebuild, and together they address the majority of the measurable loss. That order matters more than tooling choice — the same prioritisation discipline we bring to paid search work, where the landing experience decides whether the click was worth buying.
Map Pack, Organic and Where the Calls Come From
Technical work has to serve the surface that actually generates calls. Local search analysis consistently finds map pack placement drives a disproportionate share of contacts relative to blue-link organic rankings for service-area businesses — and map pack eligibility depends on entity clarity, consistent NAP and a fast mobile landing experience, all technical concerns.
- Fix the mobile render first. 71% of visits and 7% of conversions per second is the highest-value queue item.
- Audit long-tail templates, not the homepage. 51% versus 84% CWV pass rates.
- Validate schema rather than adding more. Only 22% of sites pass cleanly.
- Compress and convert images. Images are 48% of a 2.3 MB average page.
- Make click-to-call the primary action. Calls close at 46%.
- Differentiate city pages. Thin duplicates drive the 26% non-indexed rate on large sites.
- Ship before March. Winter volume is 30–60% of peak.
If you want the same treatment applied to your own templates, our growth marketing team scopes technical work against booked jobs rather than audit scores, and you can get in touch for a template-level review.
Frequently Asked Questions
Does site speed affect pest control lead volume?
Directly. Mobile is 71% of home-services website visits, and research puts the cost at roughly 7% of conversions for every additional second of mobile load time — so a five-second load loses about 35% of leads versus a one-second load on identical traffic. With pest control site conversion at 12–15%, that is the most expensive technical debt in the trade.
What percentage of sites pass Core Web Vitals in 2026?
Between 42% and 51.3% depending on the dataset and scope: HTTP Archive and Chrome UX Report analyses report 42% of websites passing all three metrics, while origin-level CrUX data for June 2026 shows 51.3% of origins passing on mobile, up from 43.2% a year earlier, and 67.8% on desktop. Individually, CLS passes at 74%, INP at 65% and LCP at 58%.
Is schema markup worth it for a pest control website?
Yes, and validity matters more than volume. A 5,000-site audit found 71% of sites deploy at least one schema type but only 22% pass Google’s Rich Results Test cleanly across every type they emit — a 49-point gap. Valid schema correlates +0.34 with AI-search citation rate, and Article plus BreadcrumbList produces a +47% citation lift.
How mobile-heavy is pest control search?
Roughly 68–70% of pest control and home service inquiries originate on smartphones, and 76–88% of local smartphone searchers contact or visit a business within 24 hours. Google has run 100% mobile-first indexing since July 2024, so the mobile render is the only version that gets indexed.
What technical issues are most common on service-business websites?
Aggregate crawl data ranks Core Web Vitals failures first, present on 91% of sites and affecting 34% of crawled URLs. Long-tail pages pass CWV at just 51% versus 84% for homepages — which is precisely where city and pest-type service pages live.
Sources
Searchlab — Technical SEO Statistics 2026
JustAnalytics — Core Web Vitals Statistics 2026
Crawlix — Top Technical SEO Issues 2026
Digital Applied — Schema Markup Adoption Audit
Garrett Handley — Contractor Website Conversion 2026
Authority Specialist — Pest Control SEO Statistics
Ignite Digital — State of Search for Pest Control 2026
PipelineOn — Pest Control SEO Guide
Atlantis Web — Local SEO Schema Gap
Dagmar Marketing — Map Pack vs Organic