



Table of contents
The average pest control company spends 6.6% of revenue on marketing — but growth-oriented operators investing 10–15% achieve a 6x–7x return on every dollar. With Google Ads CPCs in home services climbing 22.6% year-over-year to $6.88 and AI Overviews reshaping search, the digital marketing playbook is shifting fast. These are the benchmarks and channel economics that separate operators who are growing from those who are guessing.
Key Takeaways
- Growth-oriented pest control companies invest 10–15% of revenue in marketing and achieve 6x–7x returns — the industry average is 6.6% (NPMA / PCO Bookkeepers 2025, 246 companies).
- Organic search delivers the lowest CPL at $59 — versus $91 for Google Ads and $53 for LSA (Coalmarch 2026 Benchmark, $11M spend tracked).
- Multi-channel campaigns increase conversions by 3.1x compared to single-channel approaches (MarketingLTB).
- 74% of pest control revenue is recurring — customer lifetime value of $1,620–$3,000+ makes even a $91 CPL profitable (NPMA/BaaDigi).
- AI Overviews caused a 61% drop in organic CTR when present — brands cited in AI answers earn 35% more organic clicks (Coalmarch 2026).
- 81% of pest control customers search on mobile devices — mobile-first site speed and click-to-call are non-negotiable.
Pest Control Digital Marketing Benchmarks at a Glance
| Metric | Benchmark | Source |
|---|---|---|
| Industry avg. marketing spend (% of revenue) | 6.6% | NPMA / PCO Bookkeepers 2025 |
| Growth-stage marketing spend | 10–15% | Cube Creative / NPMA |
| Top-performer ROI (revenue per $1 spent) | 6x–7x | Cube Creative |
| Google Ads CPL — pest control | $90.92 | WordStream / LocaliQ 2025 |
| LSA CPL — general pest | $15–$28 | Blue Grid Media 2026 |
| Organic SEO CPL | $59.33 | Coalmarch 2026 Benchmark |
| Facebook Ads CPL | ~$35 | AQuality Pest case study |
| Paid-search conversion rate | 7.33% | WordStream / LocaliQ 2025 |
| Landing page conversion rate | 6–12% | MarketingLTB 2026 |
| Customer lifetime value (recurring) | $1,620–$3,000+ | BaaDigi / NPMA |
| Recurring revenue share | 74% | NPMA / PCO Bookkeepers |
| Operating profit margin | 15% | NPMA / PCO Bookkeepers |
Cost per Lead by Marketing Channel
Channel economics vary dramatically for pest control companies. Coalmarch's 2026 Benchmark Report, based on over $11 million in tracked marketing spend across hundreds of pest and lawn companies, shows organic search remaining the most cost-efficient channel despite declining session volumes. The data represents companies ranging from $500,000 to $20 million in annual revenue with $150 million in combined revenue.
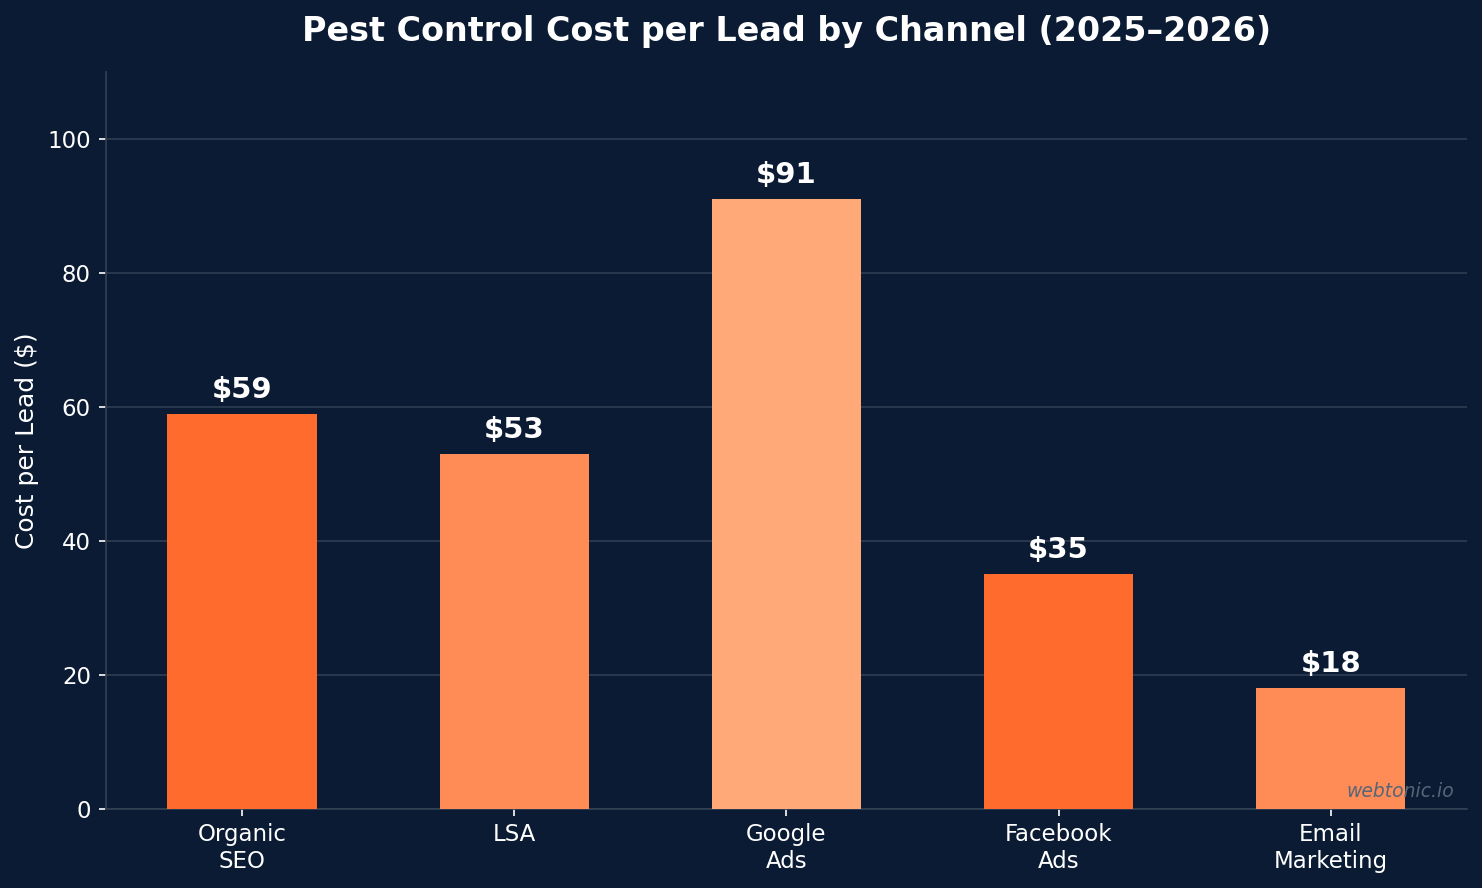
The CPL gap between Google Ads at $91 and LSA at $53 reflects different conversion mechanics. LSA drives direct phone calls from high-intent searchers who see star ratings and "Google Guaranteed" badges — no website visit required. Google Ads requires a click, a landing page visit, and a form fill or call, adding friction at every stage. But Google Ads offers broader targeting control and the ability to drive brand awareness alongside lead generation, making it essential for operators building long-term market position.
Channel Performance Deep Dive
| Channel | CPL | Close Rate | Avg. Ticket | Best For |
|---|---|---|---|---|
| Google Ads (Search) | $90.92 | 8–15% | $225–$1,500 | High-intent capture, brand terms |
| Local Services Ads | $15–$55 | 38–45% | $225–$750 | Emergency and reactive calls |
| Organic SEO | $59.33 | 14–22% | Full range | Sustained pipeline, local authority |
| Facebook / Meta Ads | ~$35 | Varies | $225–$400 | Awareness, seasonal pushes |
| Email Marketing | ~$18 | 22% open rate | Recurring | Retention, upsell, reactivation |
Cost-per-lead rose across most paid pest control channels in 2025, reflecting a more competitive environment and higher platform costs. Google Ads saw the largest increase as higher CPCs and broader automated matching made it more expensive to stay visible. LSA CPL also climbed year-over-year, continuing the steady upward trend as more pest providers rely on the platform for urgent, problem-driven leads. Organic search remained the most cost-efficient channel by a wide margin — even with fewer total sessions, visitors were more intentional and more likely to convert.
Marketing Investment by Company Size
Marketing spend as a percentage of revenue scales with growth ambition, not just company size. The NPMA baseline of 6.6% represents the industry average across 246 companies, but operators spending less than 5% are mathematically unable to outpace natural customer churn. The companies that capture market share invest 10–15% and achieve returns that justify every dollar.
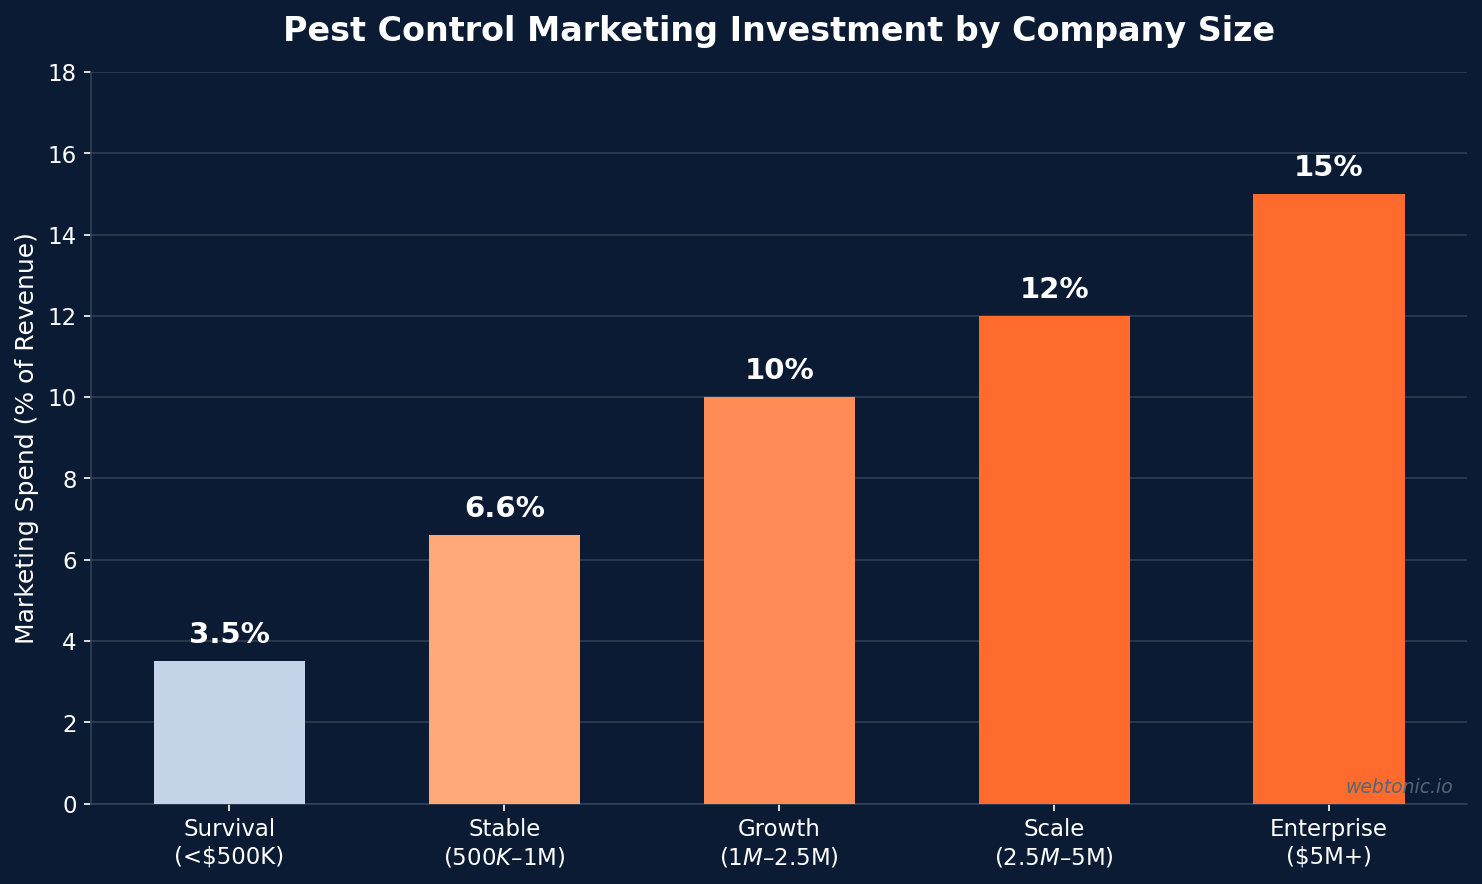
The top-performer efficiency ratio of 6x–7x means every $1 invested generates $5–$7 in revenue. That return requires deliberate channel allocation, proper attribution infrastructure, and the operational capacity to convert leads into long-term recurring customers rather than one-time service calls. Companies achieving 6x–7x typically have call tracking, CRM lead routing, and technician upsell training all working together as a system.
AI Overviews and the Changing Search Landscape
Google's AI Overviews have fundamentally changed visibility economics for pest control companies. According to the Coalmarch 2026 report, AI Overviews caused a 61% drop in organic click-through rates and a 68% drop in paid clicks when present. Even searches without AI Overviews saw fewer clicks as user behavior shifted toward expecting instant answers at the top of the search results page.
The counterbalance: brands cited in AI Overviews earn 35% more organic clicks and 91% more paid clicks compared to non-cited competitors. This creates a two-tier system where pest control companies with strong brand authority and structured content benefit from the new format while smaller operators lose visibility. Building authority through expert content, local citations, and consistent branding becomes a competitive moat rather than a nice-to-have marketing investment.
Why Multi-Channel Outperforms Single-Channel by 3.1x
Multi-channel pest control campaigns increase conversions by 3.1x and integrated strategies outperform single-channel approaches by 3–5x according to MarketingLTB's analysis. The reason is behavioral: 74% of customers compare at least three providers before booking, and the average pest control customer needs 2.5 touchpoints before converting to a paying client.
A homeowner searching "termite treatment near me" might see an LSA listing, visit the website through organic search, receive a retargeting ad on Facebook, and finally call after reading a Google review. Each channel plays a different role in the decision journey. Companies running only paid ads miss the 48% of leads that come from organic traffic, while companies relying solely on SEO miss the 35% that come from paid channels. The operators who dominate their local markets run both in parallel, letting each channel reinforce the others throughout the decision cycle.
The most effective multi-channel operators also use SMS campaigns, which show a 45% response rate in pest control — significantly higher than email's 22% open rate. SMS works particularly well for appointment confirmations, seasonal reminders, and re-engagement of lapsed recurring customers who cancelled within the last 12 months.
Customer Economics: Why the Math Works
Pest control is a recurring-revenue machine. With 74% of revenue coming from recurring contracts, 15% operating margins, and customers worth $1,620–$3,000+ over their lifetime, even expensive acquisition channels pay back quickly when retention holds above 70%.
| Service Type | Avg. Job Value | LSA CPL | CLV (Recurring) |
|---|---|---|---|
| General Pest | $225 | $15–$28 | $1,620 (3-year) |
| Rodent Control | $400 | $22–$40 | $2,000+ |
| Bed Bug Treatment | $750 | $25–$45 | $1,500 (one-time) |
| Termite Treatment | $1,500 | $35–$55 | $3,000+ (5-year) |
| Commercial Contract | $2,000+ | $40–$55 | $30,000+ |
Mobile Search and Local SEO Performance
81% of pest control customers search on mobile devices, and 54% of pest control queries include location keywords like "near me" or a specific city name. This makes mobile site speed, click-to-call buttons above the fold, and local search optimization non-negotiable. 68% of pest control leads originate from local search results, confirming that local pack visibility, GBP optimization, and review volume are among the highest-ROI investments.
Organic SEO leads close at 14–22%, compared to 8–15% for PPC leads, because organic visitors tend to be further along in their decision process. They have already compared options, read reviews, and arrived at the operator's website through a search that matched their specific need. This higher close rate, combined with the lower CPL of $59 versus $91 for paid search, makes organic SEO the most profitable channel for pest control companies willing to invest for six to twelve months before seeing compounding returns.
Digital Marketing Best Practices for Pest Control
- Allocate 10–15% of revenue to marketing if your goal is growth. The 6.6% industry average maintains the status quo — it doesn't build market share against competitors investing more aggressively.
- Build a multi-channel presence across LSA, Google Ads, organic SEO, and at least one social channel. Single-channel dependence caps your conversion ceiling at 3.1x below integrated campaigns.
- Invest in call tracking and attribution — the $30–$50 per month minimum stack pays for itself within 30 days by identifying which channels actually generate booked jobs.
- Optimize for mobile-first — 81% of pest control searches happen on mobile. Click-to-call buttons, fast load times, and mobile-optimized forms are non-negotiable table stakes.
- Focus on retention, not just acquisition — with 74% recurring revenue and 70–90% retention for top performers, reducing churn by 5% is often worth more than a 20% increase in new leads.
- Prepare for AI search — structured content, FAQ schema, and authoritative brand presence increase the odds of being cited in AI Overviews, which drive 35% more organic clicks.
Frequently Asked Questions
How much should a pest control company spend on digital marketing?
The industry average is 6.6% of revenue according to the NPMA/PCO Bookkeepers 2025 study of 246 companies. Growth-oriented companies invest 10–15%. For a $2M pest control business, that means $132,000–$300,000 annually. Companies spending below 5% typically cannot outpace natural customer churn and will see their customer base shrink over time.
What is the average cost per lead for pest control?
It depends on the channel: Google Ads averages $90.92, Local Services Ads range from $15–$55 depending on service type, organic SEO averages $59.33, and Facebook Ads can deliver leads in the $28–$46 range with optimized creative. The blended CPL for most multi-channel operators falls between $50 and $100.
Which marketing channel has the best ROI for pest control?
Organic SEO offers the lowest long-term CPL at $59.33 and a 14–22% close rate. LSA provides the best cost-to-close ratio with $15–$55 CPL and 38–45% booking rates. The highest overall ROI comes from running both alongside paid search and social — multi-channel campaigns convert 3.1x more than single-channel approaches.
How are AI Overviews affecting pest control marketing?
AI Overviews reduced organic click-through rates by 61% and paid clicks by 68% when they appear in search results. However, brands cited in AI-generated summaries earn 35% more organic clicks and 91% more paid clicks. The shift rewards companies with authoritative, structured content that AI systems reference.
What is the customer lifetime value in pest control?
Residential customers on recurring quarterly plans are worth $1,620 over three years at approximately $540 per year. Five-year residential relationships approach $3,000. Commercial pest control contracts frequently exceed $30,000 in lifetime value. With 74% of pest control revenue being recurring, the customer acquisition cost is quickly amortized by the ongoing revenue stream.
Sources
Cube Creative — Pest Control Marketing Spend by Company Size
Coalmarch — 2026 Pest Control Marketing Benchmark Report
BaaDigi — Pest Control Marketing Benchmarks 2026
MarketingLTB — Pest Control Marketing Statistics 2026 (93+ Stats)
PCT Online — NPMA/PCO Bookkeepers 2025 Pest Control Cost Study
PipelineOn — Home Service Marketing Benchmarks 2026
WordStream / LocaliQ — Google Ads Industry Benchmarks


