



Table of contents

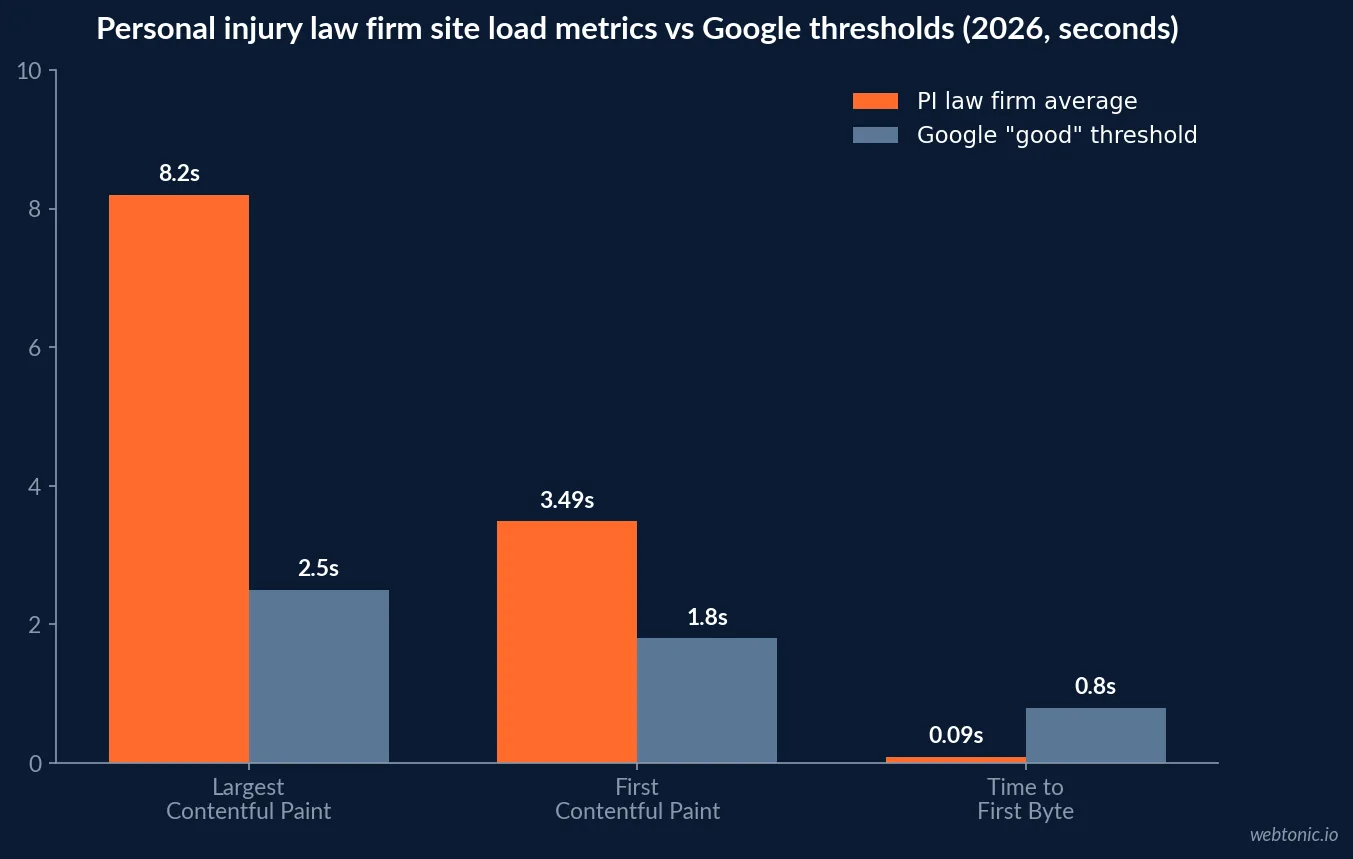
The average personal injury law firm website takes 8.2 seconds to render its main content — 5.7 seconds past Google’s threshold. The surprise in the 2026 data is that this is barely hurting rankings, and badly hurting revenue.
Key Takeaways
- Average LCP across 233 US personal injury lawyer sites: 8.20 seconds versus a 2.5-second threshold.
- Average PageSpeed performance score for PI sites: 61/100; SEO score 92, accessibility 87.
- 66% of PI law firm sites score below 70 on PageSpeed; only 11.5% score 90+.
- Average First Contentful Paint is 3.49s (threshold 1.8s); CLS is fine at 0.08.
- Slow main content is the top issue, present on 71.8% of PI sites.
- 48.3% of PI sites carry broken links; 27.4% have no sitemap and 22.2% no robots.txt.
- 93.6% of PI sites use SSL — meaning 15 of 233 still trigger a browser warning.
- 83.8% publish JSON-LD structured data, but 55% of law firm homepages lack LegalService or Attorney schema.
- 82.8% of law firm homepages omit city or state from the title tag — the single most common gap.
- 43.7% of law firm homepages carry no attorney-advertising disclaimer.
- A study of 1,750 ranking data points found no meaningful link between PageSpeed and position.
- Nearly two-thirds of pages ranking first fail Google’s LCP standard; average score was 64.9/100.
- Globally, 51.3% of origins pass all three Core Web Vitals on mobile, up from 43.2% a year earlier.
- 68.01% of searches now end without a click, and AI Overviews cut top-result CTR by 58%.
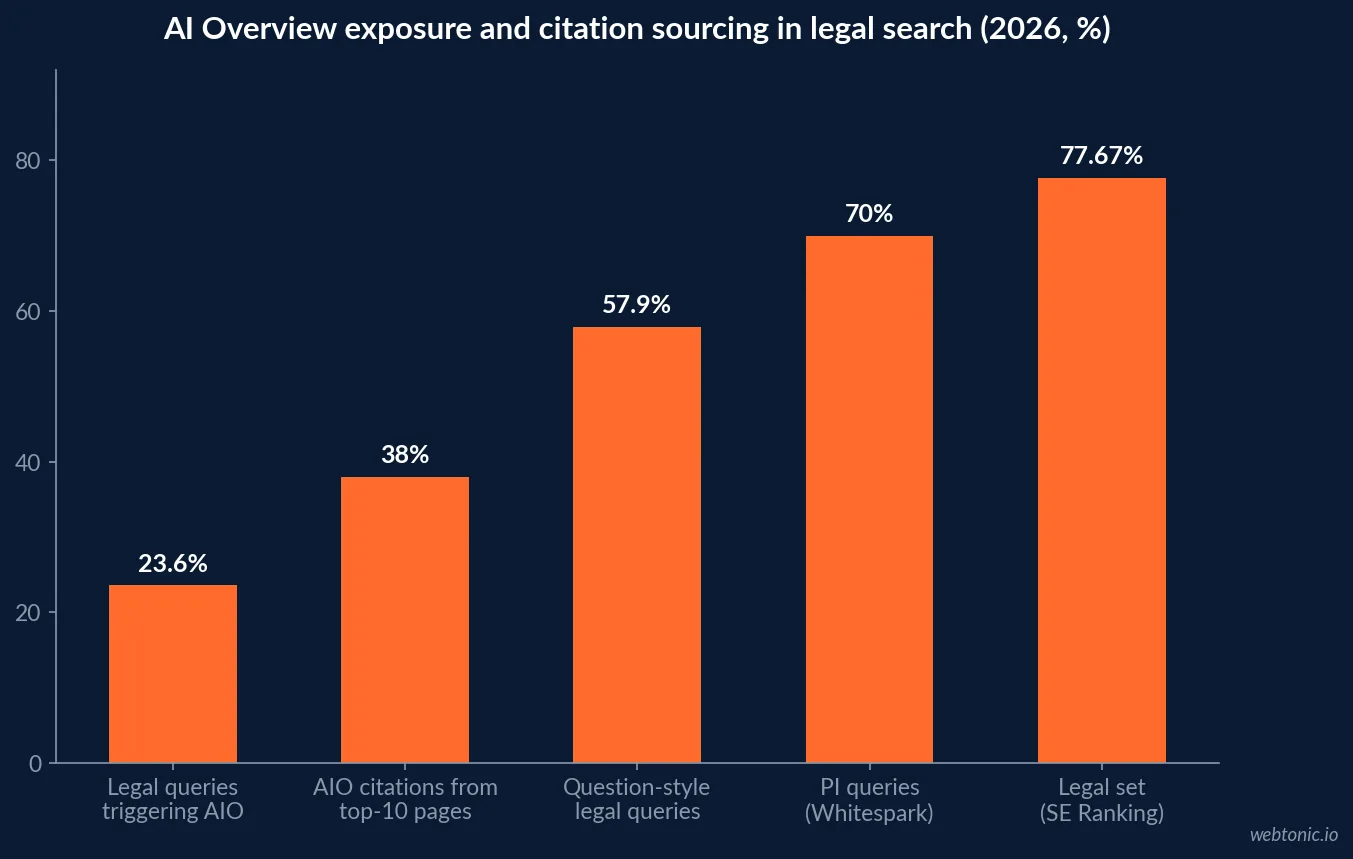
- Legal queries trigger AI Overviews on 23.6% of searches and 57.9% of question-style queries.
- Only 38% of AI Overview citations come from pages ranking in Google’s top 10.
- Anthropic’s crawler fetched 2,299 pages for every referral it sent back.
- PI sites convert organic visitors to consultation requests at 3–8%; every second over three seconds costs about 7% of conversions.
What a PI Law Firm Site Actually Measures
A July 2026 diagnostic crawl of 233 US personal injury lawyer websites gives the cleanest vertical baseline available. The pattern is not marginal underperformance — it is a market-wide rendering problem.
| Metric | PI law firm average | Google threshold | Verdict |
|---|---|---|---|
| Largest Contentful Paint | 8.20s | 2.50s | 3.3x over |
| First Contentful Paint | 3.49s | 1.80s | Nearly 2x over |
| Cumulative Layout Shift | 0.08 | 0.10 | Passing |
| Time to First Byte | 0.09s | 0.80s | Excellent — servers are not the issue |
| PageSpeed performance score | 61/100 | 90+ | Needs work |
| PageSpeed SEO score | 92/100 | 90+ | On-page basics are handled |
| Sites with SSL | 93.6% | 100% | 15 sites still warn users |
The TTFB number is the diagnostic tell. At 0.09 seconds, hosting and server response are excellent — which means the 8.20-second LCP is caused by what happens after the HTML arrives: hero video, chat widgets, tracking scripts, sliders and render-blocking JavaScript. This is a front-end weight problem, not a hosting problem, and it is why "move to a faster host" rarely changes anything.
The Distribution Matters More Than the Average
Averages hide whether a market has a handful of broken outliers or a long tail. In personal injury, it is the long tail: 66% of sites score below 70.
| PageSpeed tier | Score range | Share of PI sites |
|---|---|---|
| Critical | 0–49 | 33.6% |
| Needs work | 50–69 | 32.8% |
| Decent | 70–89 | 22.1% |
| Good | 90–100 | 11.5% |
Two-thirds of the market is in the bottom half of Google’s own scale. Broader law firm data runs slightly worse: the same methodology applied to 678 general law firm sites measured an average LCP of 9.3 seconds, and independent audit practice puts LCP above 4 seconds on roughly two-thirds of audited firm sites. Being at the vertical average is not a defence; it just means the whole vertical is slow.
The Uncomfortable Finding: Speed Is Not Why You Are Not Ranking
The best-evidenced 2026 study on this question ran 350 live Google searches across 50 US cities, captured the top five organic results, and pushed all 1,328 unique ranking URLs through PageSpeed Insights — 1,750 data points across 11 keywords. The relationship between PageSpeed and position was, in practical terms, nonexistent.
| Finding | Figure | Implication |
|---|---|---|
| Pages at position 1 failing Google’s LCP standard | ~2 in 3 | LCP is not a ranking gate |
| Average PageSpeed score across all ranking results | 64.9/100 | “Needs improvement” still ranks |
| Top-five pages scoring below 50 | More than 1 in 5 | Broken-fast is not required to rank |
| Average LCP across the 1,750 results | Over 8 seconds | Matches the vertical baseline |
| Cities with the lowest scores | 6 of the bottom 10 in California | Heaviest sites, most competitive markets |
| What top pages share instead | Authority, content depth, brand demand | Where budget should go |
The California paradox in that dataset is the most useful part: Los Angeles, Sacramento, San Jose, Fresno, San Diego and San Francisco cluster at the bottom on speed and dominate their markets anyway, because the firms there run heavy, video-rich, chat-widget-laden sites on top of enormous authority. Meanwhile the fastest markets — Nashville, Memphis, Oklahoma City, Indianapolis — are the ones where speed confers the least advantage.
That does not make speed work worthless; it relocates the return. PI firm sites convert organic visitors to consultation requests at 3–8%, and every second of load time above three seconds costs roughly 7% of conversions. On a practice where a single signed case can be worth five figures in fees, that is the real argument — a conversion argument, not a ranking argument.
The Technical Debt That Does Move Rankings
While firms buy speed audits, the mechanically fixable issues sit untouched. Ranked by frequency across the 233-site PI sample and a parallel audit of 238 graded law firm homepages:
| Issue | Share of sites affected | Why it matters |
|---|---|---|
| City/state missing from homepage title | 82.8% | Kills local relevance on the highest-value query set |
| Slow main content (LCP) | 71.8% | Conversion loss, not ranking loss |
| Duplicate title tags | 64.5% | Cannibalisation across practice-area pages |
| No LegalService / Attorney schema | 55% | No rich results, weaker entity signals |
| Broken links | 48.3% | Wasted crawl, dead-end user journeys |
| No attorney-advertising disclaimer | 43.7% | Compliance exposure, not just SEO |
| No sitemap.xml | 27.4% | Slower discovery of new practice pages |
| No robots.txt | 22.2% | No crawl control at all |
Aggregate crawl research across verticals reaches the same conclusion about priority: soft 404s carry the highest crawl-budget impact and are mechanically fixable, and canonical-chain conflicts resolve into 20–35% indexation-coverage improvements within 60 days. Indexation is the constraint that actually stops pages from ranking; a page that is not indexed cannot be slow enough to matter.
How PI Firms Compare to the Web at Large
Context helps calibrate how bad 61/100 really is. As of mid-2026, 51.3% of origins pass all three Core Web Vitals on mobile, up from 43.2% a year earlier, and desktop pass rates sit near 56% per compiled technical SEO benchmarks.
| Benchmark | All sites | Personal injury law |
|---|---|---|
| Passing all three CWV on mobile | 51.3% | Well below — 66% score under 70 on PageSpeed |
| Average LCP | Improving year over year | 8.20s (9.3s across all law firms) |
| Structured data deployed | ~71% deploy, ~22% valid | 83.8% deploy JSON-LD, 45% use legal schema |
| HTTPS adoption | Near-universal | 93.6% |
| Sites with no robots.txt | Uncommon | 22.2% |
So personal injury is a laggard vertical on rendering and a leader on the cheap on-page basics (SEO score 92/100). That combination is exactly what you would expect from a market that buys plugins and content but not engineering time.
The 2026 Twist: Technical SEO Is Now an AI Visibility Problem
Zero-click behaviour has changed what technical work is for. 68.01% of searches now end without a click and AI Overviews reduce top-result CTR by 58%, while Anthropic’s crawler fetched 2,299 pages for every referral it sent back. Legal is one of the most AI-Overview-saturated categories: 23.6% of legal queries and 57.9% of question-style legal queries trigger AI Overviews, with SE Ranking measuring 77.67% on its legal set and Whitespark reporting roughly 70% on personal injury queries specifically.
Three technical consequences follow, and none of them are speed:
- Server-rendered HTML is now table stakes. AI crawlers generally do not execute JavaScript, so a practice-area page whose content is injected client-side can be invisible in AI answers while ranking normally in Google.
- Top-10 rankings no longer guarantee citation. Only 38% of AI Overview citations come from pages ranking in the top 10, so entity clarity and direct on-page answers matter independently of position.
- llms.txt is not the answer yet. Across a 90-day crawler log window, only 408 direct fetches of llms.txt were recorded across the major AI crawlers, per law firm AI visibility research — negligible. Fix rendering and schema instead.
A Defensible Technical Priority Order
| Priority | Work | Expected return |
|---|---|---|
| 1 | Indexation audit: sitemap, robots.txt, canonicals, soft 404s | 20–35% coverage gain in 60 days |
| 2 | Server-side rendering of practice-area and location content | Eligibility for AI citation |
| 3 | Unique titles with city/state; kill duplicate templates | Local relevance on the 82.8% gap |
| 4 | LegalService + Attorney + FAQ schema, validated | Rich results, entity clarity |
| 5 | LCP work: images, third-party scripts, chat widgets | ~7% conversion per second saved |
| 6 | Broken-link and redirect cleanup | Crawl efficiency, user journeys |
Sequenced this way, the speed project stops being sold as an SEO gamble and starts being budgeted as a conversion-rate project with a measurable payback. For the ranking and content side of the same programme, see our personal injury law SEO statistics, the local layer in our personal injury law local SEO statistics, the conversion side in our landing page statistics, and our data intelligence approach to measuring any of it.
Frequently Asked Questions
How slow is the average personal injury law firm website?
Slow enough to lose visitors, and much slower than Google's threshold. A July 2026 diagnostic of 233 US personal injury lawyer sites measured average Largest Contentful Paint at 8.20 seconds against a 2.5-second "good" threshold, an average PageSpeed score of 61/100, and 66% of sites scoring below 70.
Do Core Web Vitals actually affect personal injury rankings?
Far less than agencies claim. A study of 1,750 ranking data points across 350 live searches in 50 US cities found effectively no relationship between PageSpeed score and position: nearly two-thirds of pages holding position one fail Google's own LCP standard, and the average score across all results was 64.9/100. Speed is a conversion investment, not a ranking lever.
What technical SEO problems are most common on PI law firm sites?
Slow main content on 71.8% of sites, duplicate title tags on 64.5%, broken links on 48.3%, no sitemap on 27.4% and no robots.txt on 22.2%. Separately, 82.8% of law firm homepages omit city or state from the title tag and 55% publish no LegalService or Attorney schema.
Does technical SEO matter for AI search visibility?
More than it did for classic SEO. Legal queries trigger AI Overviews at one of the highest rates of any industry — 23.6% of legal queries and 57.9% of question-style queries per Ahrefs data, with SE Ranking measuring 77.67% on its legal query set — and AI crawlers generally do not execute JavaScript, so client-side rendered content can be invisible to them even when Googlebot indexes it.
What should a PI firm fix first?
Indexation and rendering before speed. Confirm the pages you care about are indexed, that content is in the HTML rather than injected by JavaScript, that titles are unique and carry the city, and that LegalService plus FAQ schema is valid. Then treat LCP as a conversion project: every second above three seconds costs roughly 7% of conversions.
Sources
Personal injury lawyer website benchmarks (233 sites, July 2026)
The need for speed? Not for law firm rankings (1,750 result study)
Law firm website statistics 2026 (238 graded homepages)
PI lawyer SEO benchmarks 2026
Audit your law firm website in 60 minutes
Core Web Vitals statistics 2026: pass rates and business impact
Technical SEO statistics 2026
The 2026 SEO benchmarks report: crawl ratios, CWV and CTR after AI Overviews
Top technical SEO issues found in 2026 (aggregate crawl data)
AI visibility benchmarks for law firms in 2026
The law firm AI visibility stack 2026


