Table of contents

Managing partners at analytics-enabled firms now open their dashboard 25 times a month, up from 14 six months earlier. In a contingency practice, though, most of the KPIs on those screens were designed for billable hours. Here is what the 2026 data says a personal injury dashboard should actually contain.
Key Takeaways
- Dashboard usage at analytics-enabled law firms grew nearly 80% in the second half of 2025.
- The average managing partner checks their dashboard 25 times per month, up from 14.
- Dashboard software is a $7.88 billion market in 2026, growing at a 14.5% CAGR.
- The wider business intelligence market is put at $31.97 billion for 2026.
- Around 30% of organisations still report broken reporting from pipeline and metric-definition problems.
- Average law firm utilization is 38% — just 3.0 billable hours in an eight-hour day.
- Average realization is 88%; collection realization at top firms hit 95.4% in FY 2025.
- Am Law 100 billing realization was 81.5% in FY 2025, so even elite firms write off nearly a fifth.
- Median total lockup is 93 days — 43 in unbilled work and 32 in unpaid invoices.
- A 5% realization improvement can equal a 20% profitability improvement.
- Raising one attorney from 37% to 50% utilization adds roughly 260 billable hours a year.
- PI firms should track 8–12 curated KPIs and close the books monthly.
- Median end-to-end lead-to-signed-case rate is 24%; PI firms average 7–14%.
- Top-quartile PI firms sign 25–40% of leads — a gap worth more than any bid change.
- Law firms run a 28% missed-call rate, the metric most often missing from dashboards.
- Soft-tissue matters settle in 3–6 months; surgical cases take 12–24 months.
- Blended PI cost per signed case in practitioner scorecards lands near $2,750.
- Firms using intake CRM software report 47% more lead conversions.
Reporting Became a Weekly Habit in 2026
The behavioural shift is documented rather than anecdotal. Analysis of law firm dashboard usage found engagement at analytics-enabled firms grew nearly 80% in the second half of 2025, with the average managing partner opening a dashboard 25 times a month against 14 six months earlier. The old rhythm — a financial pack landing on the fifteenth, describing last month — is being replaced by something closer to a scoreboard.
| Reporting behaviour | 2026 data point | What it implies |
|---|---|---|
| Dashboard usage growth, H2 2025 | ~80% | Reporting shifted from monthly to weekly |
| Managing partner dashboard opens per month | 25 | Data now supports operational decisions |
| Previous rate, six months earlier | 14 | Habit formed inside two quarters |
| Dashboard software market, 2026 | $7.88B | Tooling is commoditised |
| Business intelligence market, 2026 | $31.97B | Spend is moving to continuous reporting |
| Organisations reporting broken reporting | ~30% | Metric definitions, not software, are the blocker |
Market sizing supports the same conclusion. Dashboard software is projected to grow from $6.88 billion in 2025 to $7.88 billion in 2026 at a 14.5% CAGR, while roughly 30% of organisations say their reporting is still unreliable because of data-pipeline issues and inconsistent metric definitions, per 2026 business intelligence industry data. Buying a dashboard is easy; agreeing on what a signed case is remains the hard part.
Why Standard Law Firm KPIs Do Not Fit a Contingency Practice
Most published legal KPI sets assume billable hours. They are still useful as capacity signals, but they cannot measure a contingency practice’s revenue.
| Hourly-firm KPI | 2026 benchmark | Relevance to a PI firm |
|---|---|---|
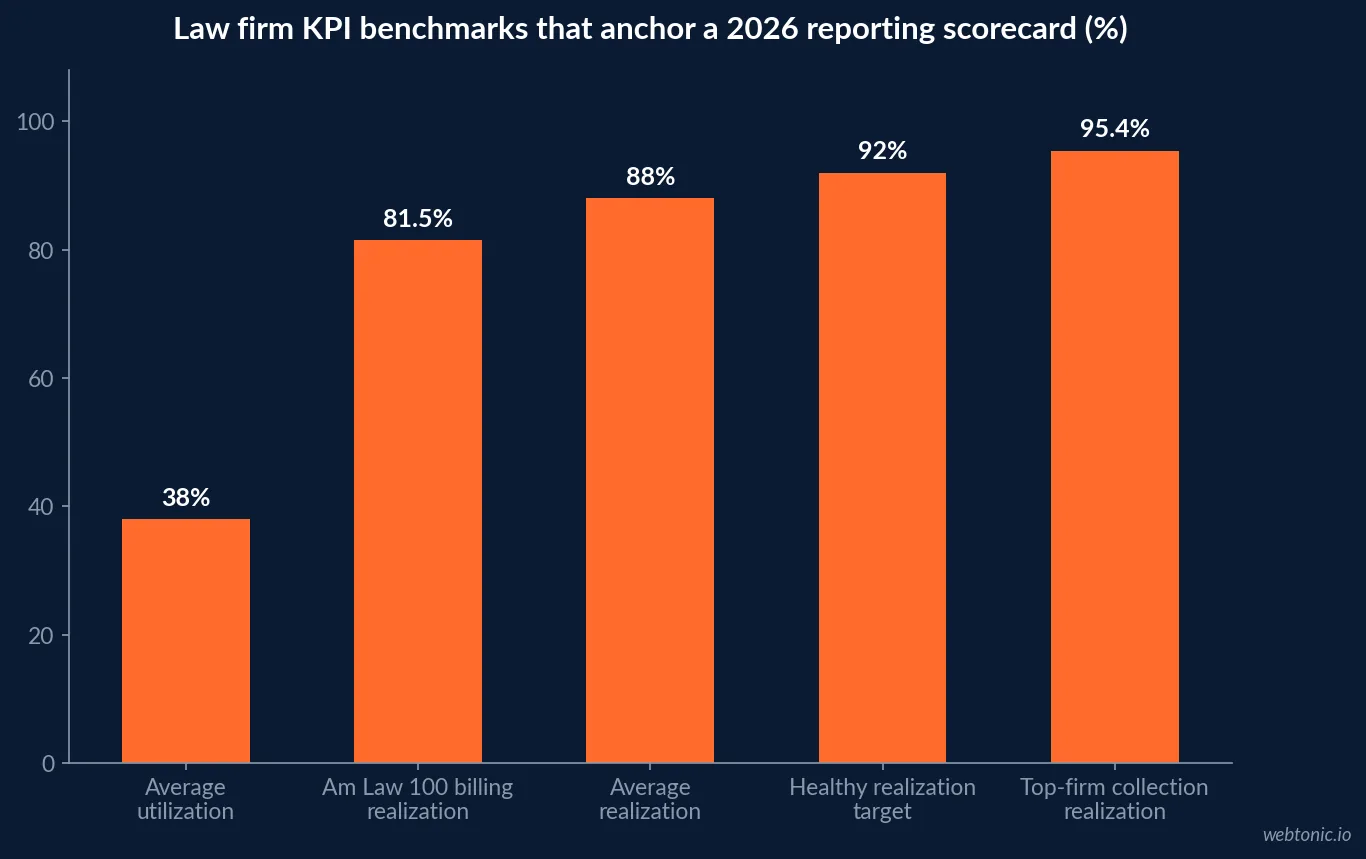
| Attorney utilization rate | 38% (3.0 billable hours/day) | Capacity signal only |
| Realization rate | 88% firm-wide | Not applicable to contingency fees |
| Am Law 100 billing realization | 81.5% (FY 2025) | Context for write-off discipline |
| Collection realization, top firms | 95.4% (FY 2025) | Relevant to fee and lien recovery |
| Median total lockup | 93 days | Directly relevant — cash tied up in open files |
| Profit per equity partner, Am Law 100 | $3.59M (+14.0%) | Peer context, not an operating metric |
The realization figures are worth keeping for one reason: leverage. Practitioner analysis notes that a 5% improvement in realization can equal a 20% improvement in profitability, and that raising a single attorney from 37% to 50% utilization adds roughly 260 billable hours a year. In a PI firm the equivalent leverage sits in settlement velocity and intake conversion, not in timekeeping — but the principle that small percentage moves on large denominators beat heroic new initiatives holds either way. Detailed benchmarks are published in 2026 law firm financial KPI guidance and in small-firm productivity benchmarks (utilization 36–40%, realization 88–92%, collection 92–97%).
The Personal Injury Scorecard: Eight to Twelve Rows
Guidance for plaintiff firms converges on a compact scorecard rather than a metric warehouse. The rows below combine marketing, intake and case production so a single review answers the only two questions that matter: are we buying cases profitably, and can we carry the ones we sign?
| Scorecard row | Formula or source | 2026 reference point |
|---|---|---|
| Signed cases per month | CRM retainers executed | 8+ for a mid-size local firm |
| Cost per signed case (blended) | (Marketing + intake cost) ÷ retainers | ~$2,750 practitioner blended |
| Cost per signed case by channel | Channel spend ÷ CRM-verified cases | $2,485 LSA – $2,971 Google Ads |
| Lead → signed case rate | Retainers ÷ total leads | 7–14% average, 25–40% top quartile |
| Call answer rate | Answered ÷ inbound calls | 85%+ target; 28% industry miss rate |
| Speed to first contact | Median CRM timestamp delta | Under 5 minutes |
| Expected fee per signed case | Case type × historic fee average | Tracked by case type, not blended |
| Case cycle time | Intake date → settlement disbursed | 3–6 months soft tissue, 12–24 surgical |
| Active caseload per attorney / paralegal | Open files ÷ timekeepers | Capacity ceiling before quality drops |
| Referral concentration | Share of cases from top 3 referrers | Above 60% is concentration risk |
Two of those rows are the ones most often missing. Call answer rate belongs on a marketing dashboard because law firms run a 28% missed-call rate, and referral concentration belongs there because a firm drawing 60% of cases from two or three referring attorneys has a single point of failure no ad budget can offset, as PI marketing KPI analysis points out.
Case Production Metrics Marketing Dashboards Usually Omit
A PI firm can hit every marketing target and still stall on cash. The metrics below are production-side but belong in the same review, because they determine whether more signed cases are an asset or a liability.
| Production metric | Why it belongs on the dashboard | Warning sign |
|---|---|---|
| Average case cycle time | Cash conversion and overhead per file | Jump from 9 to 14 months |
| Demand-to-settlement ratio | Negotiation and valuation quality | Falling ratio across a practice group |
| Time to distribution after settlement | Client experience and review velocity | Lien-heavy files pushing past 70 days |
| Active caseload per paralegal | Service quality and staff attrition | Rising while cycle time rises |
| Open-file value pipeline | Forward revenue visibility | Concentrated in a few large files |
| Referred-out case volume and fees | Unrecorded revenue and staffing gaps | Consistent referrals of one case type |
Settlement-side data makes the point concretely: a firm that knows its average time to distribution and how much longer subrogation-heavy files take can forecast cash instead of hoping, as settlement velocity analysis shows. Plaintiff-firm KPI guidance in eight metrics plaintiff firms should track in 2026 and PI-specific KPI lists reaches the same conclusion from the operations side.
Cohort Reporting Beats Monthly Snapshots
The structural problem with PI reporting is timing. Cases signed in January may not produce fee revenue until the following year, so a monthly marketing report compares this month’s spend against fees earned from cases bought 12 to 24 months ago. The fix is cohort reporting: group signed cases by the month they were signed, attach expected fee by case type, then reconcile as files resolve.
| Report view | Question it answers | Cadence |
|---|---|---|
| Monthly marketing snapshot | Are we generating enough qualified leads? | Weekly |
| Signed-case cohort by month | Are we buying cases at a sustainable cost? | Monthly |
| Expected-fee pipeline by case type | What revenue is already contracted? | Monthly |
| Realised fee per cohort | Which channels produced the best cases? | Quarterly, rolling 12 months |
| Capacity view (caseload per timekeeper) | Can we absorb more volume? | Monthly |
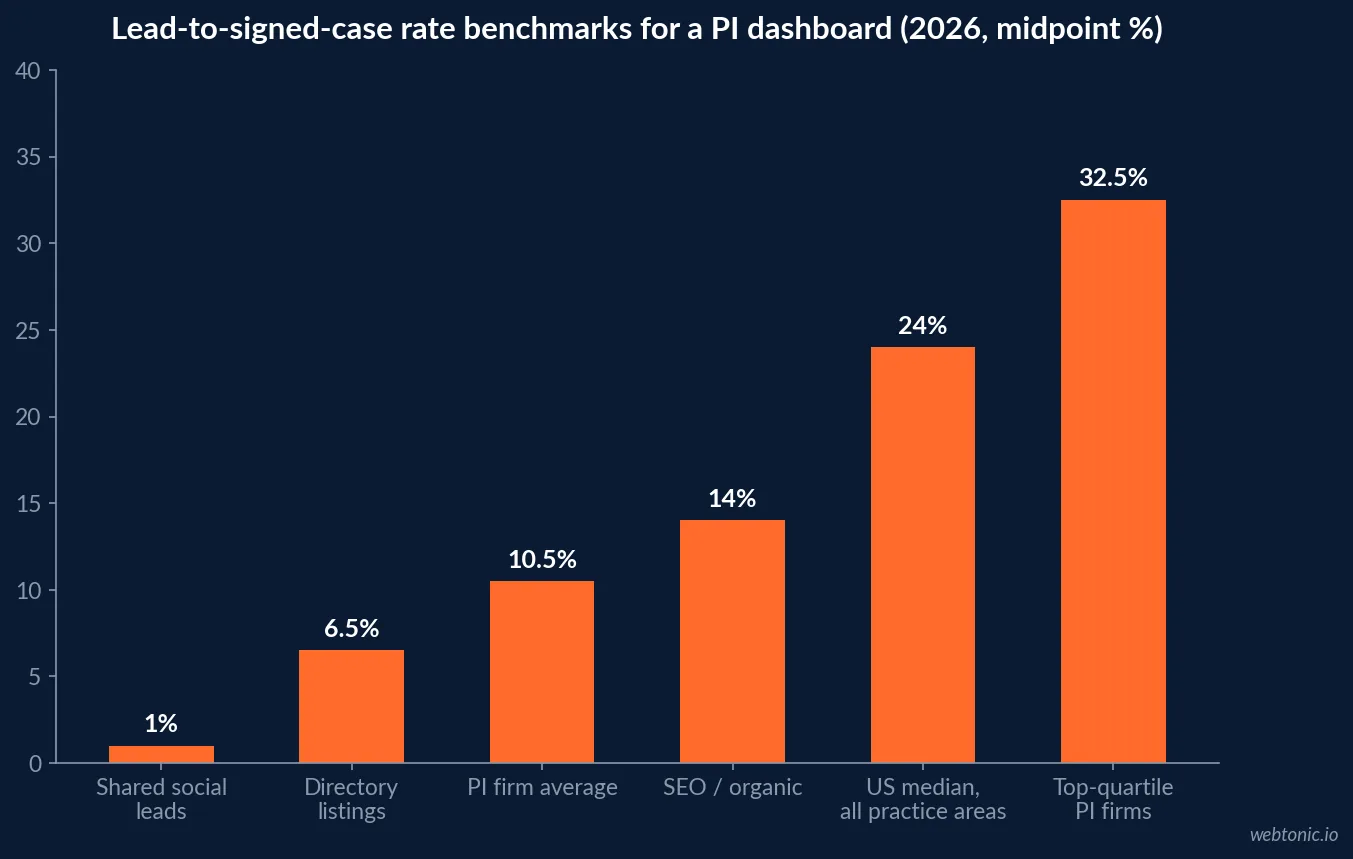
Plotting those rates on the same axis is what makes a dashboard argument-proof: the median US firm signs 24% of leads end to end, the average PI firm sits at 7–14%, and top-quartile PI firms reach 25–40%. Moving from the average to the top quartile roughly halves cost per signed case without touching media spend, which is why intake rows belong on the marketing scorecard rather than in an operations report nobody opens.
Cohorts also settle the perennial channel argument. Referral cases sign at 25–45% while shared social leads sign at 0.5–1.5%, so any view that mixes them dilutes both. The measurement plumbing behind that is covered in our personal injury law analytics statistics, and the paid-channel benchmarks these cohorts are compared against in our personal injury law Google Ads statistics.
Legal Analytics Maturity: Tools Installed, Decisions Unchanged
A 2026 mid-market survey of legal analytics maturity found the recurring pattern: firms buy legal-specific BI platforms and then use them for tactical reporting on billable hours and matter economics rather than strategic decisions, per legal analytics maturity research. The dashboard exists; the decision rights do not move.
- Define before you build. A signed case, a qualified lead and a marketing cost need one written definition each, or two dashboards will disagree by 30%.
- Cap the metric count. Curate 8–12 KPIs and close the books monthly; anything more becomes decoration.
- Put a target next to every number. A 72% answer rate means nothing without the 85% benchmark beside it.
- Assign an owner per row. Intake owns speed to contact; marketing owns cost per signed case; operations owns cycle time.
- Review weekly, decide monthly. The 25-opens-per-month pattern only pays off if a decision follows.
That sequence is how we build reporting in our data intelligence engagements, and it is why the first deliverable is usually a one-page definition sheet rather than a visual. For firms rebuilding the acquisition side at the same time, our personal injury law digital marketing statistics covers the channel benchmarks these dashboards report against.
Frequently Asked Questions
What KPIs belong on a personal injury law firm dashboard?
Eight to twelve, no more. For a contingency practice the core set is signed cases, cost per signed case by channel, call answer rate, speed to first contact, lead-to-signed rate, average expected fee per case, case cycle time and active caseload per attorney and paralegal. Firms that curate that many and close the books monthly outperform firms tracking forty metrics nobody reads.
How often do law firm leaders actually check a dashboard?
Far more than they did. Dashboard usage at analytics-enabled firms grew nearly 80% in the second half of 2025, and the average managing partner now opens their dashboard 25 times per month, up from 14 six months earlier. Reporting has shifted from a monthly PDF to a weekly habit.
Do hourly-firm KPIs like utilization apply to personal injury firms?
Only as capacity signals. Utilization averages 38% and realization 88% across law firms, but a contingency practice earns on settled fees, not invoiced hours. The PI equivalents are expected fee per case, case cycle time, demand-to-settlement ratio and caseload per timekeeper.
What is the most common personal injury reporting mistake?
Reporting leads instead of fees. Because a matter can take 3 to 24 months to resolve, a monthly dashboard that stops at lead volume shows activity while the fee cohort behind it is still open. Signed cases should be reported by cohort with expected fee attached, then reconciled when the settlement check clears.
How big is the dashboard and BI software market in 2026?
Dashboard software is projected at $7.88 billion in 2026, up from $6.88 billion in 2025, a 14.5% CAGR, while the wider business intelligence market is put at $31.97 billion for 2026. The tooling is not the constraint — roughly 30% of organisations still report broken reporting because of pipeline issues and inconsistent metric definitions.
Sources
Law firm KPI dashboards: the shift to real-time decision making
Law firm financial KPIs list: 2026 tracking guide
Most important productivity metrics for small law firms 2026
Law firm profitability benchmarks 2026
Dashboard software global market report 2026
Business intelligence industry statistics 2026
Personal injury firm marketing KPIs
Cost per signed case: personal injury firm guide
8 metrics plaintiff firms should track in 2026
Personal injury law firm KPIs
What settlement velocity data tells a PI firm
Analytics maturity in legal services: 2026 mid-market survey