



Table of contents
Restoration companies that connect call tracking to job management software can attribute revenue per marketing channel for the first time — yet fewer than half have made that connection. Here are the analytics benchmarks, technology adoption rates, and data infrastructure insights defining restoration business intelligence in 2026.
Key Takeaways
- 66% of restoration contractors use Xactimate as their primary estimating and pricing tool (Cleanfax 2026 Survey)
- 70–80% of restoration leads arrive by phone, making call tracking the highest-priority analytics layer (Tygart Media)
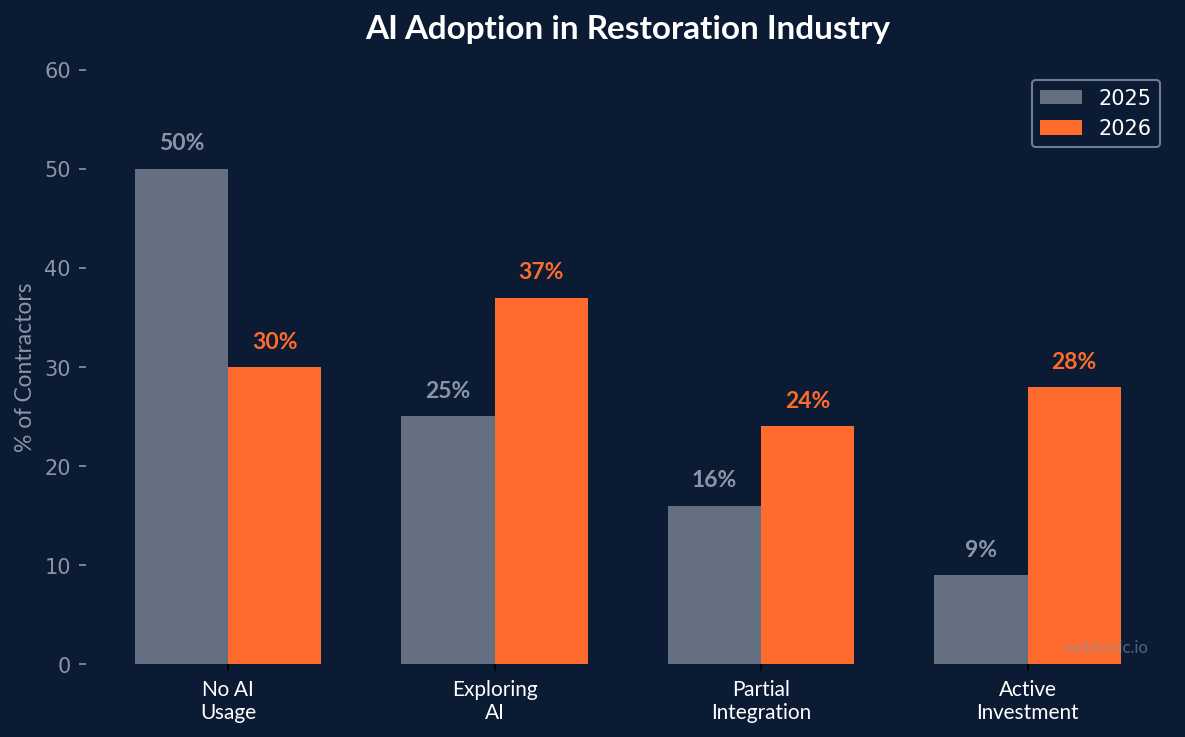
- 37% of contractors are exploring AI solutions and 24% report partial integration — up from 50% with no AI adoption in 2025 (Cleanfax)
- 62,582 restoration firms operate in the U.S. across a $7.2 billion domestic market (Proof)
- 52% of respondents name water damage restoration as their most profitable service — up from 47% in 2025 (Cleanfax)
- Insurance-funded projects represent 58.97% of all restoration spending globally (Fortune Business Insights)
- $45.2 billion global disaster restoration market in 2026, projected to reach $58.5 billion by 2031 at 5.28% CAGR
Restoration Analytics Benchmarks at a Glance
| Metric | Benchmark | Source |
|---|---|---|
| Xactimate adoption rate | 66% of contractors | Cleanfax 2026 |
| CotalityTM adoption rate | 17% of contractors | Cleanfax 2026 |
| Leads arriving by phone | 70–80% | Tygart Media |
| AI partial integration | 24% of firms | Cleanfax 2026 |
| Employee turnover under 10% | 52% of respondents | Cleanfax 2026 |
| Insurance payment wait (3–8 weeks) | Majority of firms | Cleanfax 2026 |
| US restoration market size | $7.2 billion | IBISWorld / Proof |
| Global market size (2026) | $45.2 billion | Mordor Intelligence |
Technology Adoption in the Restoration Industry
The 2026 Cleanfax Restoration Benchmarking Survey — drawing primarily from owners and corporate management (79% of respondents) — shows an industry rapidly professionalizing its tech stack. Xactimate remains the dominant estimating platform at 66%, while CotalityTM has gained 17% adoption as contractors evaluate alternatives. The shift from skepticism to experimentation with AI is particularly striking: only 30% of contractors report no AI usage in 2026, down sharply from 50% the prior year.
Contractors are deploying AI primarily for marketing content generation, estimate drafting, report writing, administrative efficiency, and SOP development. Cost perception has evolved accordingly — 28% now describe AI as a worthwhile investment they're actively funding, compared to just 9% who still consider it too expensive. For companies managing data intelligence workflows, these adoption curves suggest a tipping point where analytics-first operations become the competitive norm rather than the exception.
The Three-System Martech Stack for Restoration
According to Tygart Media, every restoration company needs exactly three systems working in coordination: a CRM, call tracking, and attribution. Everything else is optional until these three produce clean, connected data.
| System | Role in Restoration | Key Benchmark |
|---|---|---|
| CRM | Single source of truth for every customer interaction — first contact to final invoice | HubSpot powers 45.8% of B2B martech stacks; Salesforce holds 42% market share |
| Call Tracking | Attribute phone leads (70–80% of volume) to their marketing source | CallRail dominant in trades; ServiceTitan integration connects source to job revenue |
| Attribution | Determine which touchpoints deserve credit across multi-step customer journeys | Without attribution, companies credit the last touchpoint (often GBP) and misallocate budget |
The CallRail–ServiceTitan integration is the most significant martech development for the restoration industry in recent years. Before this connection, companies could track cost per lead but not cost per acquired job. A marketing channel might generate 50 leads at varying quality — the integration reveals which leads converted to actual jobs and the revenue they produced, transforming marketing from a cost center into a measured profit driver.
For restoration companies under $10 million in revenue, HubSpot's free CRM tier typically provides more functionality than most firms will use in the first year. The primary role of a CRM in restoration isn't pipeline management (though that matters for commercial accounts) — it's creating a single, reliable record of every customer interaction from first contact to final invoice. Companies that connect this data to their Google Ads campaigns can measure true cost per acquired job rather than relying on cost-per-lead metrics that ignore quality differences between channels.
Insurance Payment Cycles and Cash Flow Analytics
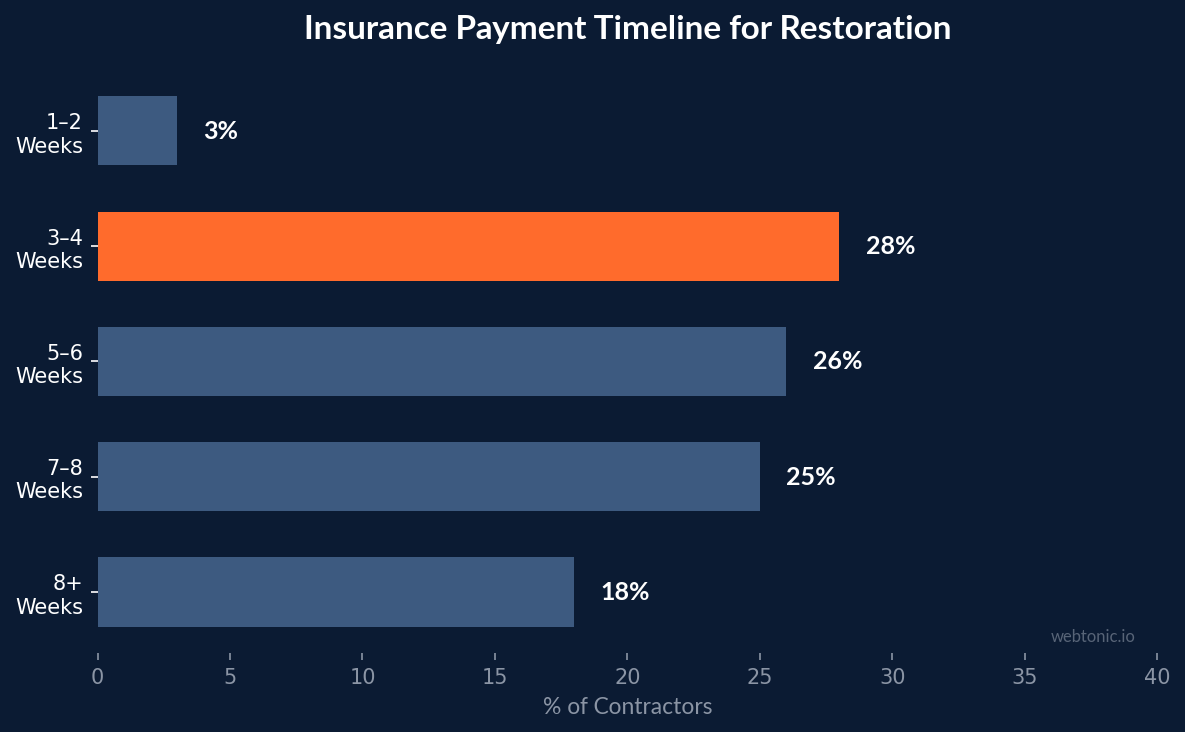
Cash flow scored a 4.36 weighted average (out of 5) as a top concern in the 2026 Cleanfax survey, and the payment timing data explains why. Only 3% of respondents receive insurance payment within one to two weeks. The majority wait three to eight weeks, and over 18% wait more than eight weeks. For an industry where insurance-funded projects represent 58.97% of all spending globally (Fortune Business Insights), these payment delays create cascading analytics challenges.
Contractors describe a pattern of delayed payments, reduced scopes, and pressure tactics from insurance carriers. Companies with robust analytics systems track days-to-payment by carrier, enabling data-driven decisions about which insurance programs to prioritize and where to push back on scope reductions. The firms managing this data systematically report better margin preservation than those operating without payment analytics.
Market Size and Growth Forecasting
The global disaster restoration services market is valued at $45.2 billion in 2026 and is projected to reach $58.46 billion by 2031, growing at a 5.28% CAGR (Fortune Business Insights). Within the United States specifically, the property-restoration niche — covering water, fire, mold, and storm damage — generates roughly $7.2 billion in annual revenue across approximately 62,582 firms employing 115,280 people (Proof).
| Segment | 2026 Data Point | Growth Signal |
|---|---|---|
| Water damage restoration | 38.56% revenue share (largest service type) | IoT leak detection driving proactive service contracts |
| Residential applications | 55.67% of 2025 spending | Aging housing stock sustains demand baseline |
| Commercial & industrial | Projected 6.15% CAGR through 2031 | Fastest-growing application segment |
| North America | 40.56% global market share | Mature insurance infrastructure supports claims volume |
| Asia Pacific | Fastest-growing region | Urbanization and climate exposure accelerating demand |
| Public-sector projects | Growing sub-segment | Projected 5.98% CAGR through 2031 |
A critical data note from Proof: the broader "remediation and environmental cleanup" category (NAICS 562910) totals approximately $27 billion, but that includes Superfund, asbestos, and hazmat operations. The property-restoration market is roughly $7.2 billion — a distinction that matters when benchmarking revenue targets or calculating market penetration.
Workforce and Operational KPIs
Labor concerns scored a 4.55 weighted average in the Cleanfax survey — statistically tied with margin pressure as the industry's top worry. However, retention metrics are improving: 52% of respondents report annual turnover under 10%, up from 46% in 2025. Starting wages have shifted upward, with the most common range now $20–$21.99 per hour.
The construction trades — which restoration draws from — need an estimated 349,000 net new workers in 2026 just to keep pace, with retirement now the dominant driver of the shortage (Proof). Companies investing in culture and retention programs are seeing measurable results, and those tracking turnover data can quantify the ROI of their people investments.
Insurance Claims Data and Damage Frequency
Understanding claims analytics is essential for restoration companies forecasting demand. According to Insurance Information Institute data compiled by Proof:
- Water damage and freezing affects approximately 1 in 67 homes per year, with an average claim severity of $15,400
- Fire and lightning affects roughly 1 in 430 homes per year but carries the highest average severity at $88,170
- Wind and hail is the most frequent cause at 1 in 36 homes per year, averaging $14,747 per claim
- Water damage accounted for 22.6% of all homeowners insurance losses in 2023
- US insured catastrophe losses hit $115.6 billion in 2024 — near-record levels
For restoration companies building growth marketing strategies, these frequency and severity patterns directly inform geographic targeting, seasonal budgeting, and service line investment decisions.
Profitability by Service Line
Water damage restoration remains the clear profit leader, cited by 52% of respondents as their most profitable service — up from 47% in 2025. Mold remediation ranked second at 19%. This concentration creates both an opportunity and a risk: companies that track revenue analytics by service line can identify diversification opportunities before market shifts erode their primary revenue stream.
| Service Line | Most Profitable (%) | Trend vs. 2025 |
|---|---|---|
| Water damage restoration | 52% | ↑ from 47% |
| Mold remediation | 19% | Stable |
| Fire & smoke restoration | ~15% | Stable |
| Storm damage & specialty | ~14% | Growing (5.78% CAGR projected) |
Regional and Global Analytics Trends
North America holds 40.56% of the global restoration market share, driven by mature insurance infrastructure and high claims volume. Asia Pacific is the fastest-growing region, with urbanization and increased climate exposure accelerating demand for both restoration services and the analytics infrastructure to manage them. Companies expanding into commercial and industrial segments — projected to grow at 6.15% CAGR through 2031 — need analytics systems capable of tracking longer sales cycles, multi-site operations, and program-based pricing.
Within the United States, catastrophe data is reshaping how restoration companies plan geographically. The Proof 2026 report highlights that US insured catastrophe losses hit $115.6 billion in 2024 following $108.6 billion in 2022 and $93.3 billion in 2021. Roughly 5.6% of insured homes file a claim in an average year. Companies that layer NOAA weather data, FEMA disaster declarations, and insurance claims frequency into their analytics dashboards can predict demand surges before they hit — a competitive advantage over firms that rely on reactive dispatching alone. For businesses evaluating their Google Ads strategy, these patterns also inform geographic bid adjustments and seasonal budget allocation.
Frequently Asked Questions
What analytics tools do most restoration companies use?
Xactimate leads at 66% adoption for estimating and pricing, while CotalityTM holds 17% share. For marketing analytics, the critical stack is a CRM (HubSpot or Salesforce), call tracking (typically CallRail), and attribution software. The CallRail–ServiceTitan integration is particularly valuable for connecting marketing spend to job-level revenue data.
How fast is AI being adopted in the restoration industry?
AI adoption accelerated sharply between 2025 and 2026. The percentage of contractors reporting no AI usage dropped from 50% to approximately 30%, with 37% now exploring solutions and 24% reporting partial integration. Primary use cases include marketing content, estimate drafting, report writing, and SOP development.
What is the average insurance payment timeline for restoration work?
The majority of restoration contractors wait three to eight weeks for insurance payment. Only 3% receive payment within one to two weeks, and over 18% wait more than eight weeks. This payment lag is a primary driver of cash flow challenges industry-wide.
How large is the U.S. disaster restoration market?
The U.S. property-restoration niche — covering water, fire, mold, and storm damage — generates approximately $7.2 billion in annual revenue across 62,582 firms. The broader global market is valued at $45.2 billion in 2026. Note: the $27 billion "remediation" NAICS figure often cited includes Superfund, asbestos, and hazmat work beyond property restoration.
What KPIs should restoration companies track?
Essential KPIs include cost per lead by channel, cost per acquired job, days-to-payment by insurance carrier, job-level margin, employee turnover rate, and close rate by lead source. Companies with connected CRM–call tracking–attribution systems can measure all of these; those without typically over-credit the last touchpoint (often Google Business Profile) and misallocate budget.
Sources
cleanfax.com/2026-restoration-survey
proofco.ai/state-of-restoration
tygartmedia.com – Restoration Martech Stack
fortunebusinessinsights.com – Disaster Recovery Market
marketingltb.com – Restoration Marketing Statistics
dataintelo.com – Disaster Restoration Services Market
restorationindustry.org


