



Table of contents

Marketing headcount growth fell 50% year on year while marketing budgets grew 1.7%. Team design in 2026 is therefore a reallocation exercise, not a hiring plan. Here are the published benchmarks for sizing, shaping and staffing a marketing team.
Key Takeaways
- Marketing budgets are 9.0% of revenue and 9.6% of total firm budgets.
- Marketing spend grew just 1.7% year on year.
- Marketing headcount growth fell 50% year on year.
- Training is down to 3.8% of marketing spend, from 5.8%.
- Hiring the right people self-rates 3.7 out of 7 - the weakest capability.
- No martech capability self-rates above 5 out of 7.
- AI capability gaps are the top barrier at 35.7%.
- Resourcing barriers follow at 22.3% and architecture at 19.1%.
- Hybrid structures lead B2B at 35%; projects 28%, retainers 24%, freelancers 12%.
- Capability emphasis splits 59.5% build, 38.5% partner, 1.9% buy.
- 33.6% of digital marketing activity is delivered externally.
- High Growth firms spend 12.0% of revenue on marketing against 5.0%.
- AI use rose from 13.1% to 24.2% of marketing activities.
- 52% of top-performing organisations call content governance mature.
Size the envelope before the org chart
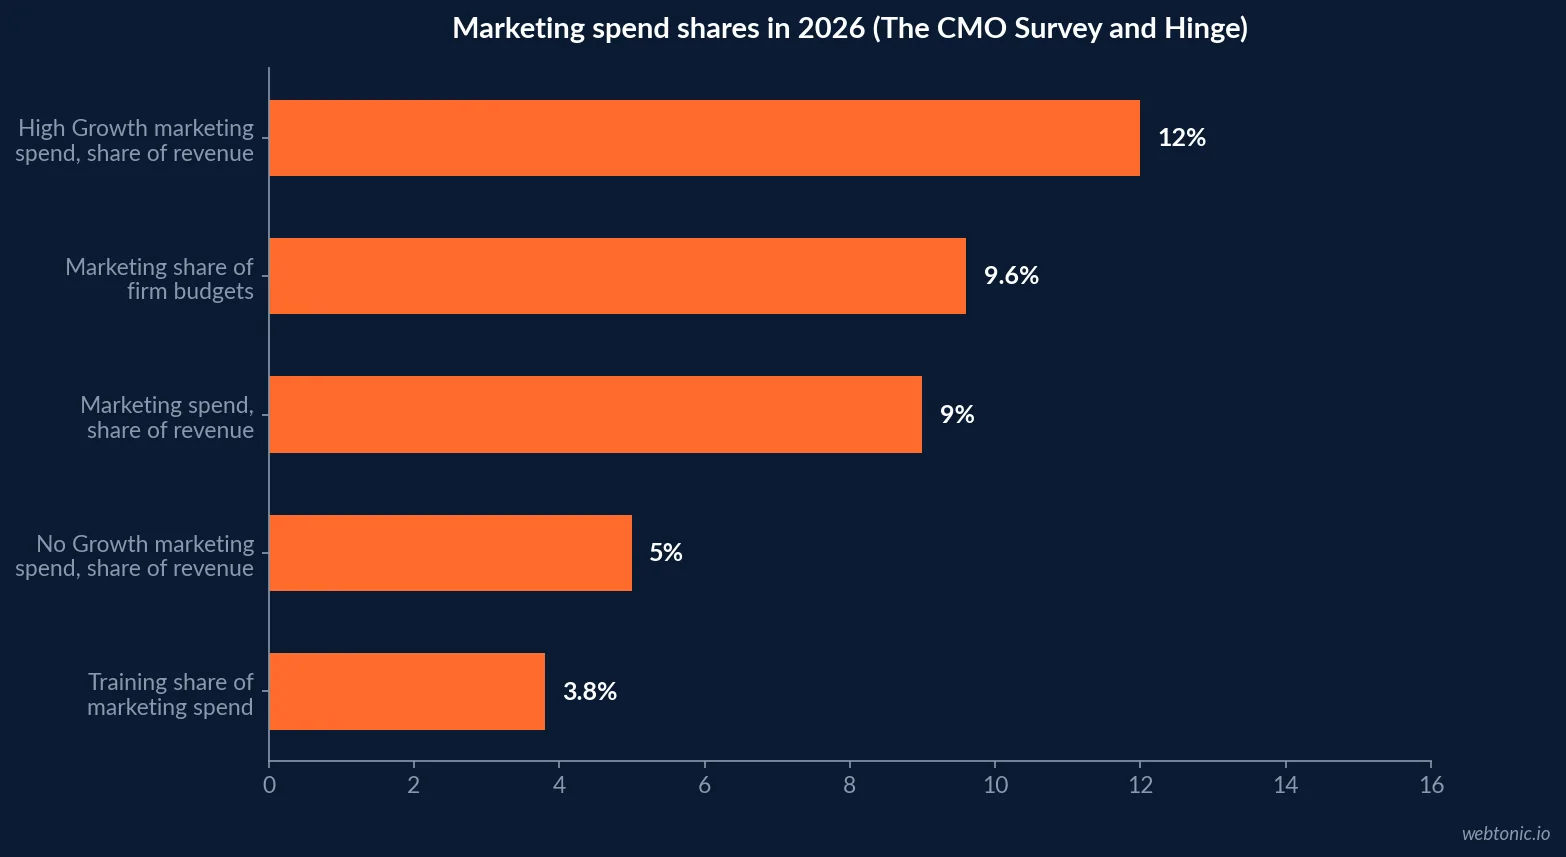
The CMO Survey 2026 reports marketing budgets at 9.0% of revenue and 9.6% of total firm budgets, spend growth of 1.7% and headcount growth down 50% year on year. Hinge Research Institute's 2026 High Growth Study adds the cohort spread: 12.0% of revenue among High Growth firms against 5.0% among No Growth firms, with median growth at 9.9%, the lowest since 2018.
Read together, these set the constraint every 2026 org design has to respect: the envelope is roughly flat, so any new capability has to be funded by stopping something. Teams that present a structure without naming what it replaces do not get it approved.
| Budget benchmark | 2026 figure | Use in team planning |
|---|---|---|
| Marketing as share of revenue | 9.0% | The total envelope for people and media |
| Marketing as share of firm budgets | 9.6% | Peer comparison across functions |
| Year-on-year spend growth | 1.7% | Plan for reallocation, not increase |
| Headcount growth | Down 50% | Expect roles to be traded, not added |
| High Growth cohort spend | 12.0% of revenue | The investment level of the top cohort |
| No Growth cohort spend | 5.0% of revenue | The under-investment marker |
The barriers are capability, not headcount
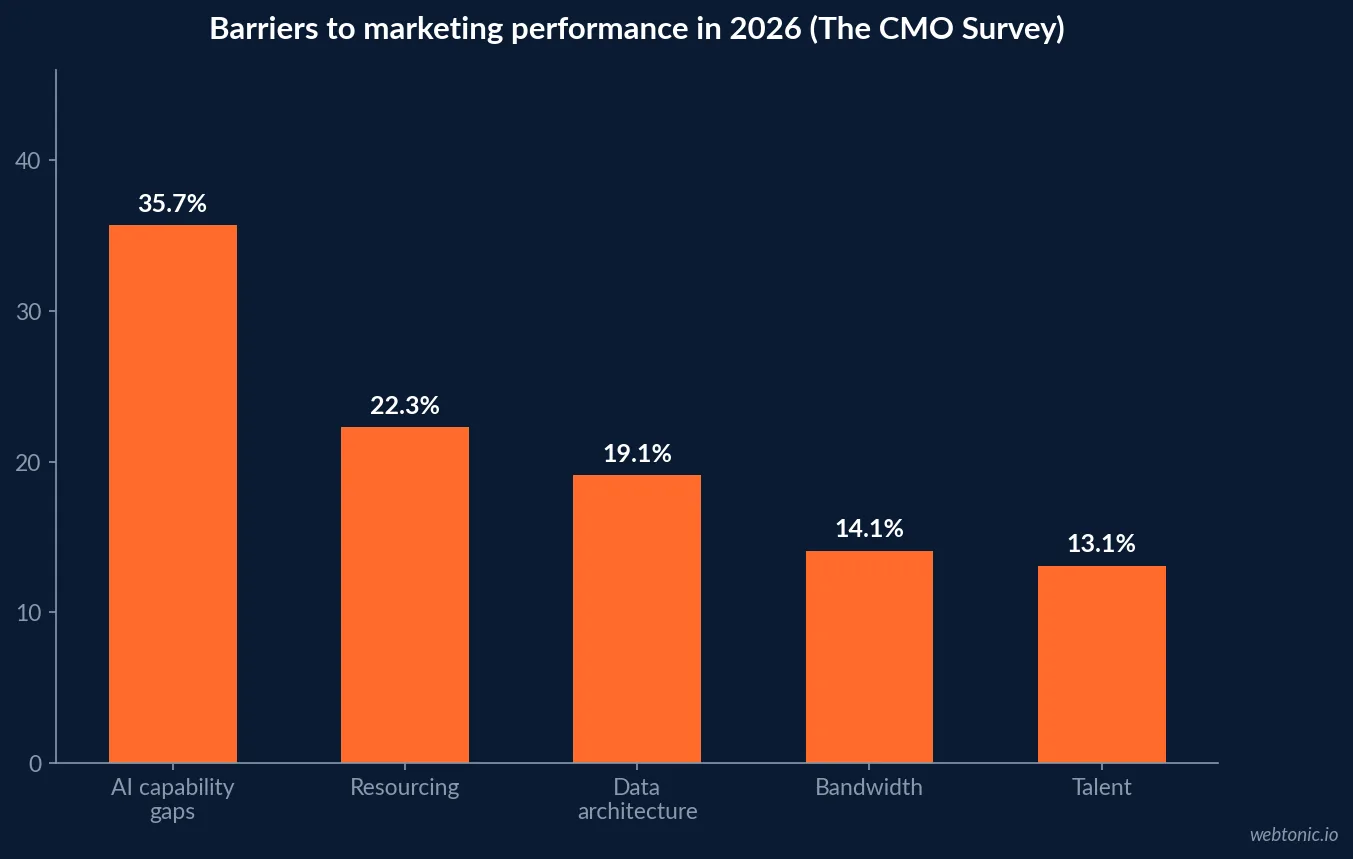
The same survey ranks the barriers marketers report: AI capability gaps at 35.7%, resourcing at 22.3%, architecture at 19.1%, bandwidth at 14.1% and talent at 13.1%. Note the order - the largest blocker is a skills gap inside the existing team rather than an absence of people.
That reframes the hiring plan. Where the gap is capability, training or a fractional specialist closes it faster and more cheaply than a permanent requisition that takes a quarter to approve and another to fill.
| Barrier | Share of marketers | Fastest structural fix |
|---|---|---|
| AI capability gaps | 35.7% | Training plus one specialist owner |
| Resourcing | 22.3% | Reallocation from a stopped activity |
| Data and system architecture | 19.1% | Project engagement with an owner named |
| Bandwidth | 14.1% | Surge capacity on retainer |
| Talent | 13.1% | Hire only after the scope is proven |
Self-rated capability: hiring is the weakest link
On the CMO Survey's 1-to-7 scale, marketers rate vendor selection 4.9, tactical use of data 4.8, systems integration 4.8, generating technology ROI 4.5, demonstrating that ROI 4.2, training 3.9 and hiring the right people 3.7. No capability scores above 5, and the ratings are flat against 2024.
Two implications for team structure. First, if hiring is the lowest-rated capability, an org design that leans on many new hires is betting on the thing the function does worst. Second, because demonstrating return rates 4.2, the measurement seat should be filled before the campaign seats - the case for our data intelligence practice.
| Capability | Self-rating out of 7 | Structural consequence |
|---|---|---|
| Selecting vendors | 4.9 | Tool choice is not the constraint |
| Using data tactically | 4.8 | Analysts exist; decisions lag |
| Integrating systems | 4.8 | Budget for reconciliation work |
| Generating technology ROI | 4.5 | Returns real, attribution weak |
| Demonstrating that ROI | 4.2 | Fill the measurement seat first |
| Training people | 3.9 | Under-funded at 3.8% of spend |
| Hiring the right people | 3.7 | Do not build a plan that depends on it |
The bench: what to own and what to rent
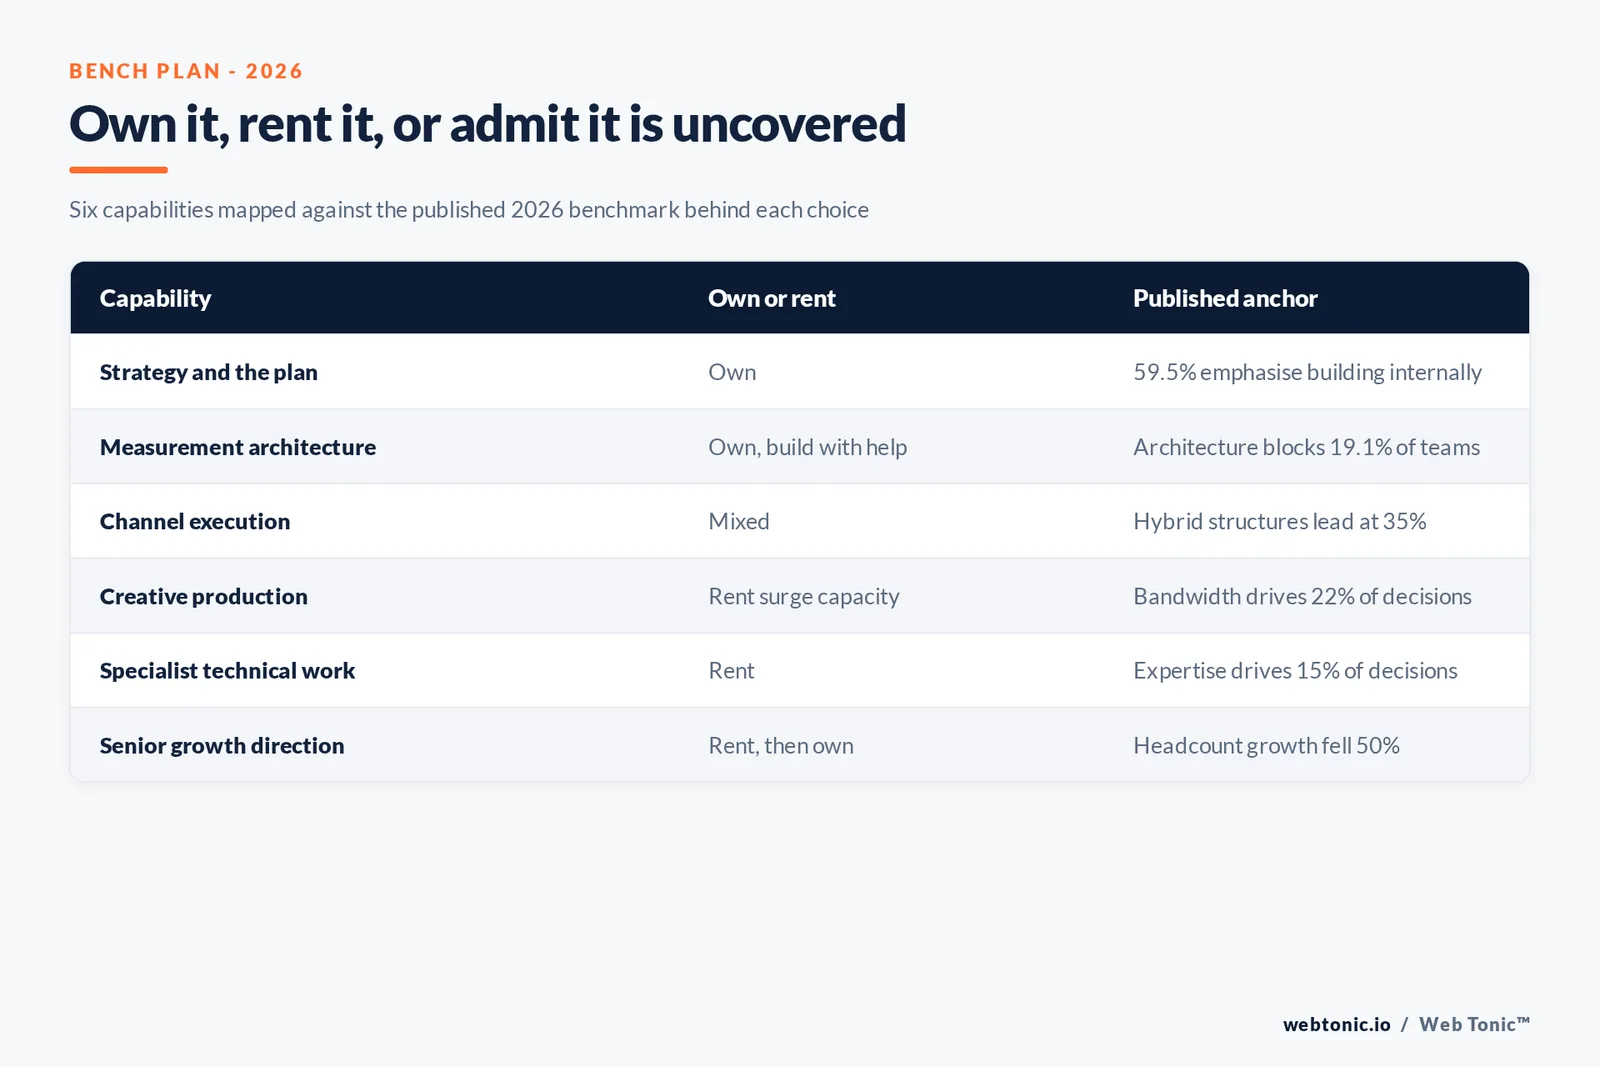
Sagefrog's 2026 B2B Marketing Mix Report reports the working mix as hybrid 35%, project 28%, retainer 24% and freelancers 12%, with the reasons ranked bandwidth 22%, speed 18%, expertise 15% and cost efficiency 13%. The CMO Survey puts capability emphasis at 59.5% build, 38.5% partner and 1.9% buy - agencies 15.5%, consultancies 12.7%, other partners 10.4% - with 33.6% of digital activity delivered externally.
The dominant structure is explicitly mixed. A defensible 2026 bench plan therefore names, per capability, whether it is owned, rented on retainer, bought as a project, or deliberately not covered - and that last category is the one most org charts hide.
| Capability | Own or rent | Why | Published anchor |
|---|---|---|---|
| Strategy and the plan | Own | Continuity and decision rights | 59.5% emphasise building |
| Measurement architecture | Own, build with help | Cross-system work is project-shaped | Architecture blocks 19.1% |
| Channel execution | Mixed | Speed of iteration matters | Hybrid leads at 35% |
| Creative production | Rent surge capacity | Volume is spiky | Bandwidth drives 22% |
| Specialist technical work | Rent | Depth is cheaper rented | Expertise drives 15% |
| Senior growth direction | Rent, then own | Scope must be proven first | Freelancers and fractional 12% |
Training is being cut while the toolset turns over
The CMO Survey reports training at 3.8% of marketing spend, down from 5.8%, at the same time as AI's share of marketing activities rose from 13.1% to 24.2% and generative AI from 7.0% to 22.4% - a 220% increase, with 55.9% projected within three years and 41.5% now working on generative engine optimisation. Applications concentrate in content creation 73.9%, personalisation 65.4%, automation 48.9%, analysis 46.3% and targeting 45.2%.
HubSpot's State of Marketing reports 61% of marketers calling this the biggest disruption in 20 years, with 80% using AI for content and 75% for media production. A team plan that adds tools without a training line is accumulating a capability debt at the exact moment the largest reported barrier is an AI capability gap.
| Adoption measure | Prior reading | 2026 | Team-design response |
|---|---|---|---|
| AI share of marketing activities | 13.1% | 24.2% | Name an owner per use case |
| Generative AI share | 7.0% | 22.4% | Fund training before tools |
| Projected AI share in three years | - | 55.9% | Plan roles that survive it |
| Generative engine optimisation work | - | 41.5% | Assign it, do not distribute it |
| Training share of spend | 5.8% | 3.8% | The line to restore first |
Governance beats headcount
The Content Marketing Institute's 2026 B2B research reports 97% of organisations having a content strategy, effectiveness improved significantly for 13% and somewhat for 48%, flat for 30%, and challenges ranked prompting action 40%, resources 39%, measurement 33%, quality content 28%, differentiation 24%, the buyer journey 23%, collaboration 21%, audience needs 20% and the plan itself 16%. Among top performers, 52% describe their governance as mature.
Collaboration at 21% and prompting action at 40% are structural symptoms, not staffing ones. Adding people to a team without an owner per workflow usually raises the collaboration cost rather than the output - which is why the cheapest 2026 structural change is a documented decision rhythm.
The KPIs that make a structure defensible
Structure is judged by whether it moves an outcome. Benchmarkit's CY-2025 study supplies the efficiency anchor: median CAC payback of 16 months, improved from 18, with the strong quartile at 10 months and the weak quartile at 24. Pair that with the 9.0% of revenue envelope and a capability-coverage count, and a team plan becomes arguable on evidence.
Keep the list short enough to review monthly. Most org scorecards fail because they measure activity per person instead of output per unit of budget - the same discipline we apply when judging whether a channel deserves more money, as in our analysis of paid social returns. For paid search staffing specifically, see how we structure managed search programmes, or bring us your current org chart.
| Team KPI | How to measure it | Published benchmark to compare against |
|---|---|---|
| Budget discipline | Marketing spend as share of revenue | 9.0% overall, 12.0% High Growth |
| Acquisition efficiency | CAC payback in months | 16 median, 10 strong quartile |
| Capability coverage | Capabilities owned, rented or uncovered | 59.5% build, 38.5% partner |
| External dependency | Share of activity delivered outside | 33.6% of digital activity |
| Capability investment | Training as share of spend | 3.8%, down from 5.8% |
| Governance maturity | Owners and cadence documented | 52% of top performers |
A staged plan for a flat-budget year
With spend growing 1.7% and headcount growth down 50%, the realistic sequence is to fix measurement, then reallocate, then add capability - and only then add people. Each stage pays for the next: trustworthy numbers make reallocation arguable, reallocation frees budget, and freed budget funds the training line that 3.8% of spend no longer covers.
Stage the plan across quarters rather than presenting it as one restructure. Teams that present a full reorganisation in a flat-budget year usually get none of it approved, while a staged plan tied to CAC payback and the 9.0% of revenue envelope gets the first stage funded - and the first stage is the one that makes the rest provable.
Related reading
- Marketing Team Structure Statistics: Adoption and Tooling
- Marketing Operations Consulting Statistics: Benchmarks and KPIs
- Marketing KPI Scorecard Statistics: Benchmarks and KPIs
- Marketing Strategy Consulting services at Web Tonic
Frequently Asked Questions
How big should a marketing team be in 2026?
Size the budget first, then the team inside it. The CMO Survey 2026 puts marketing budgets at 9.0% of revenue and 9.6% of total firm budgets, with spend growing just 1.7% and headcount growth down 50% year on year. Hinge Research Institute shows the cohort spread: High Growth firms spend 12.0% of revenue on marketing against 5.0% for No Growth firms. A team plan that assumes headcount growth rather than reallocation will not be approved on those numbers.
What is the right in-house versus agency mix?
Hybrid, on the published evidence. Sagefrog's 2026 B2B Marketing Mix Report reports hybrid structures at 35%, project engagements at 28%, retainers at 24% and freelancers at 12%. The CMO Survey puts capability emphasis at 59.5% build, 38.5% partner and 1.9% buy, with 33.6% of digital activity delivered externally. The practical rule the data supports: own the plan and the measurement internally, rent depth and surge capacity.
Which capability gap should a hiring plan close first?
Measurement and, uncomfortably, hiring itself. On the CMO Survey's 1-to-7 self-rating scale, hiring the right people scores 3.7 - the weakest capability measured - with training at 3.9, demonstrating technology ROI at 4.2 and generating it at 4.5. No capability scores above 5, and the ratings are flat against 2024. A team that cannot demonstrate return will lose the budget argument regardless of how it is structured.
How much should a team spend on training?
More than most do. The CMO Survey 2026 reports training at 3.8% of marketing spend, down from 5.8%, while AI's share of marketing activities rose from 13.1% to 24.2% and generative AI from 7.0% to 22.4% - a 220% increase in a year, with 55.9% projected within three years. Cutting training while the toolset turns over that quickly is the structural risk in most 2026 org plans.
What KPIs prove a team structure is working?
Three that survive scrutiny: output per unit of budget, time-to-decision on reallocation, and capability coverage against the plan. Anchor them to published benchmarks - marketing at 9.0% of revenue, CAC payback at a 16-month median per Benchmarkit's CY-2025 study, and content governance maturity claimed by 52% of top-performing organisations in the Content Marketing Institute's 2026 research. Structure is only defensible when it moves one of those.
Sources
The CMO Survey - Highlights and Insights Report 2026
Hinge Research Institute - 2026 High Growth Study
Sagefrog - 2026 B2B Marketing Mix Report
Content Marketing Institute - B2B Content Marketing Trends 2026
Benchmarkit - CY-2025 B2B SaaS Performance Metrics Benchmarks
HubSpot - State of Marketing


