



Table of contents
Marketers rate their own ability to demonstrate ROI at 4.2 out of 7, and that score has not moved since 2024. Strategy advice has no attribution model, so here is how to build a payback case from numbers you already own.
Key Takeaways
- Demonstrating ROI from technology scores 4.2 out of 7, flat since 2024.
- Generating that ROI scores 4.5; no capability clears 5 out of 7.
- Median CAC payback is 16 months, improved from 18 - an 11% gain.
- The first quartile recovers in 10 months, the fourth in 24.
- Fastest-growing companies pay back in 10 months against 18 for slower growers.
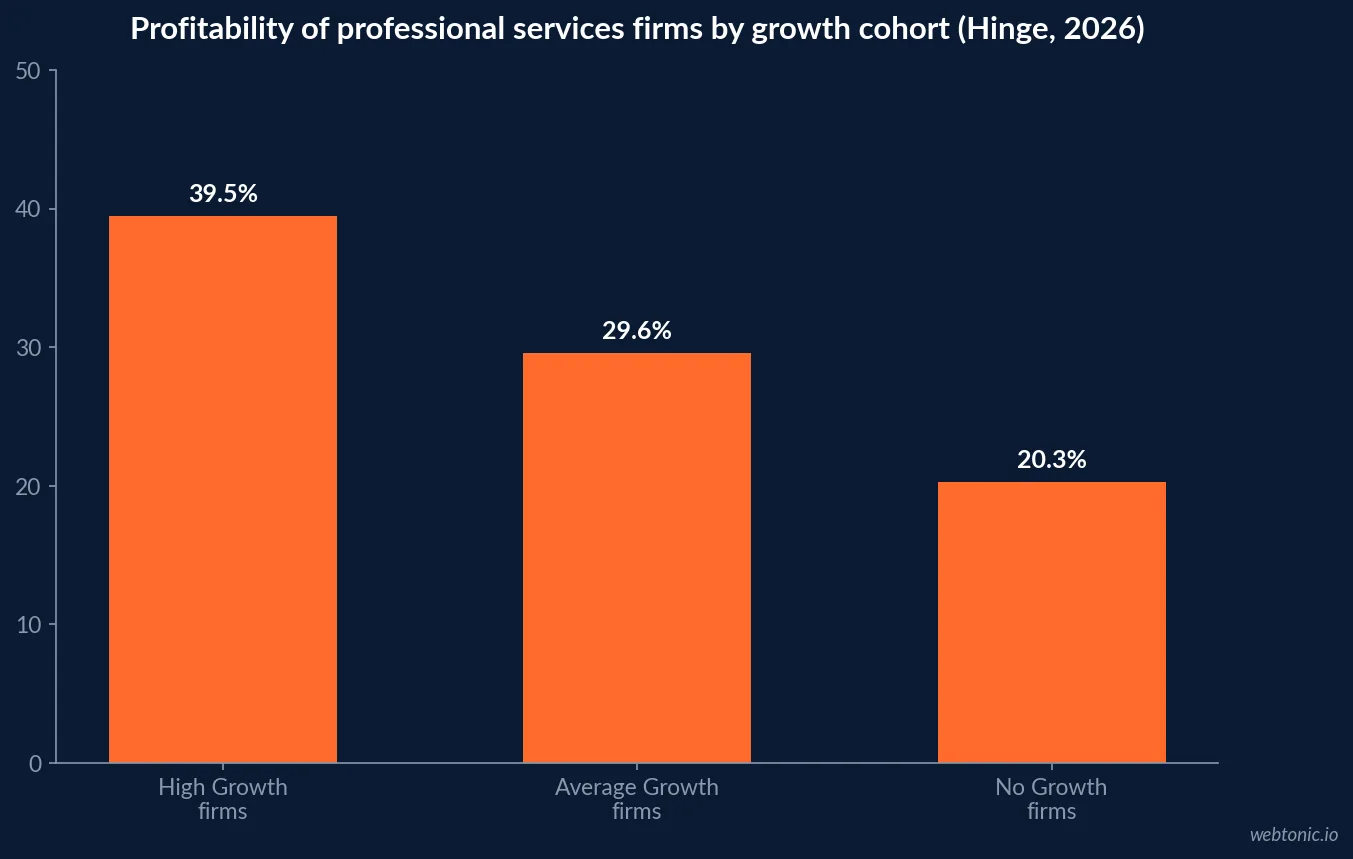
- High Growth services firms post 39.5% profitability against 20.3%.
- Median professional services growth is 9.9%, the lowest since 2018.
- High Growth firms spend 12.0% of revenue on marketing against 5.0%.
- Marketing budgets sit at 9.0% of revenue with 1.7% spend growth.
- 56.4% of growth spending goes to existing market penetration.
- 33% of B2B marketers name measuring effectiveness a top-three challenge.
- 68% of marketing time goes to the present, 32% to the future.
Start with the payback benchmark that exists
Benchmarkit's calendar-2025 study puts median customer acquisition cost payback at 16 months, improved from 18 - an 11% year-over-year gain - with a first quartile of 10 months, a fourth quartile of 24 and a top quartile at six months or less. The fastest-growing companies recover in 10 months against 18 for slower growers.
Why this matters for advisory work: it sets the clock. If your own payback is around the market median, a strategy engagement judged at the end of a single quarter is being judged before the economics can respond. The population here is B2B software, so use it as a reference point rather than a target inherited wholesale.
| Payback reference | Months | Use in an advisory business case |
|---|---|---|
| Top quartile | 6 or fewer | Aggressive target, rarely the starting point |
| First quartile | 10 | Achievable with efficient acquisition |
| Median | 16 | Default judging window |
| Fourth quartile | 24 | Review the model, not the campaign |
| Fastest-growing cohort | 10 | Against 18 for slower growers |
The four inputs that make a payback case defensible
Advice does not appear in an attribution report, so the calculation has to be assembled manually. Total cost is the fee plus the internal hours consumed - and those hours are not free, given that The CMO Survey shows 68% of marketing time going to managing the present against 32% preparing for the future. Blended gross margin comes from finance. Cost divided by margin gives the revenue the advice must influence. The decision window is the sales cycle plus reporting lag.
Run honestly, this usually produces a smaller number than expected, which is the point: a USD 40,000 engagement at a 60% blended margin needs to influence roughly USD 67,000 of revenue to break even, not a transformation.
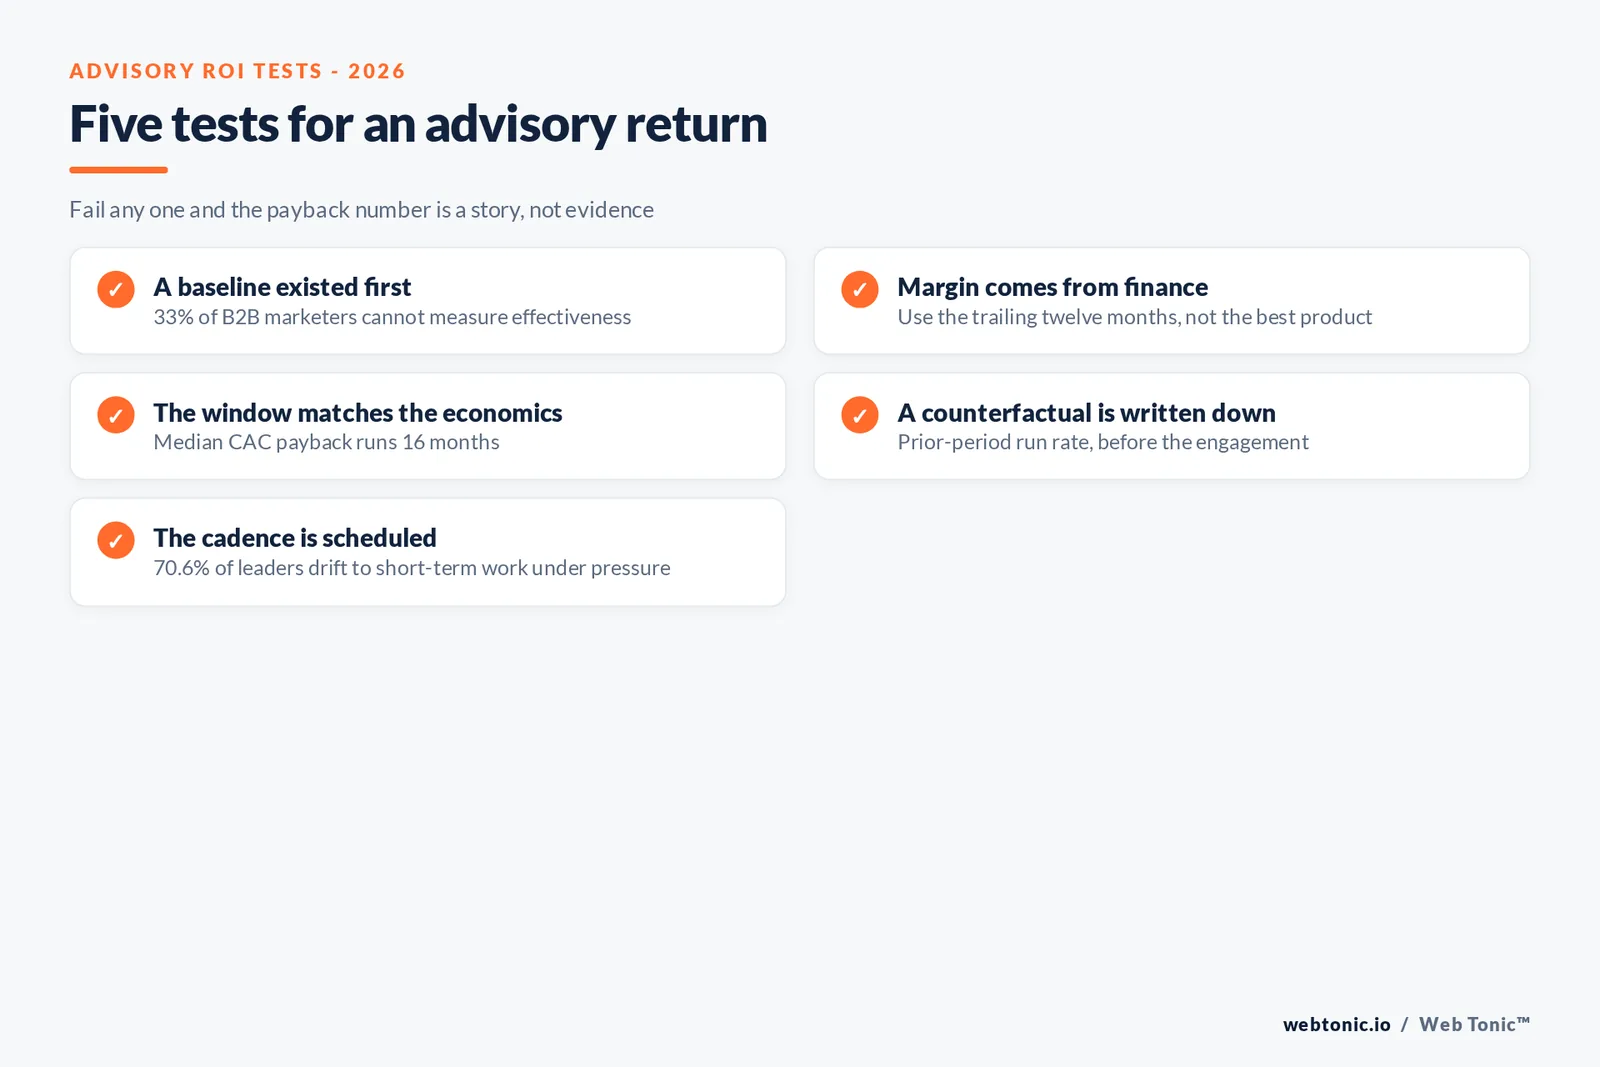
| Input | Where it comes from | Common error |
|---|---|---|
| Total engagement cost | Fee plus internal hours | Ignoring the team's time |
| Blended gross margin | Trailing twelve months in finance | Using the best product's margin |
| Revenue to influence | Cost divided by margin | Comparing fee to revenue, not margin |
| Decision window | Sales cycle plus reporting lag | Judging inside one quarter |
| Counterfactual | Prior-period run rate | Crediting the advice with the trend |
Why the proof is hard, in the teams' own ratings
The same survey rates marketing technology capabilities on a seven-point scale. Generating ROI from technology scores 4.5 and demonstrating it 4.2, with training at 3.9 and hiring at 3.7; no capability reaches 5, and the set is flat against 2024. On the content side, CMI's 2026 B2B research puts measuring effectiveness at 33% of top-three challenges, behind prompting action at 40% and resource constraints at 39%.
This is the honest reason so many strategy engagements end without a number attached: the baseline never existed. Establishing it is unglamorous work, and it is the first thing we insist on in measurement engagements before anyone promises a return.
What the outcome data actually shows
Hinge's High Growth Study 2026 reports median growth of 9.9%, the lowest since 2018, splitting into 36.6% for High Growth firms, 8.5% for Average Growth and -11.4% for No Growth firms, with profitability at 39.5%, 29.6% and 20.3%. High-growth firms allocate 12.0% of revenue to marketing against 5.0% and generate 39.5% of leads from referrals with 23.5% from outreach.
Two cautions. These are correlations from a cross-sectional survey, so faster-growing firms may simply be able to afford more marketing. And 16.8% of firms report merger or acquisition activity, which moves growth numbers for reasons unrelated to any marketing plan.
| Cohort | Median growth | Profitability | Marketing spend |
|---|---|---|---|
| High Growth firms | 36.6% | 39.5% | 12.0% of revenue |
| Average Growth firms | 8.5% | 29.6% | Between the extremes |
| No Growth firms | -11.4% | 20.3% | 5.0% of revenue |
| All firms (median) | 9.9% | Lowest since 2018 | 9.0% per The CMO Survey |
The budget reality any return has to clear
Returns are judged inside a constrained budget. The CMO Survey puts marketing budgets at 9.0% of revenue and 9.6% of company budgets with spend growth of only 1.7%, training at 3.8% of marketing spend against 5.8% pre-pandemic and headcount growth down more than 50%. Growth spending concentrates on existing market penetration at 56.4%, with product and service development at 22.9%, up from 19.2%, and new market development down to 14.1% from 17.0%.
Optimism about future budgets exists at the small end: Constant Contact's Q1 2026 small business research found 68% expecting marketing budgets to rise and 74% expecting to spend more time on marketing, with inflation the top concern at 41% against weak consumer spending at 19%.

| Budget constraint | 2026 figure | Effect on the ROI case |
|---|---|---|
| Marketing budget share of revenue | 9.0% | Ceiling on the investable base |
| Marketing spend growth | 1.7% | Gains must come from reallocation |
| Training share of spend | 3.8% | Limits what the team can absorb |
| Growth spend on penetration | 56.4% | Bias toward existing customers |
| Growth spend on new markets | 14.1% | Down from 17.0% - harder to fund |
Operating cadence as the hidden variable
Plans fail on follow-through more often than on analysis. The CMO Survey reports 70.6% of leaders shifting toward short-term impact under executive pressure and 47.1% returning to established strategies, while 71% call agility key to their organisation's success. A recommendation with no operating rhythm attached is competing with firefighting.
On formal systems, EOS Worldwide cites TrueSpace research, described as Gallup-validated and propensity-matched across 305 companies, finding companies running EOS with a professional implementer grew 2.8 times faster. That is vendor research about a vendor's own methodology - directionally interesting, not an independent benchmark. Read it as evidence that cadence matters, not that a specific system is required.
A reporting structure that survives scrutiny
Three horizons keep an engagement honest. In the first ninety days, report leading indicators the advice directly controls: decisions made, work stopped, budget reallocated. Between three and twelve months, report pipeline and cost movement against your own prior period. Beyond twelve months, report payback against the 16-month median and profitability against the cohort figures.
| Horizon | What to report | What not to claim |
|---|---|---|
| 0-90 days | Decisions taken, spend reallocated, baseline built | Revenue attribution |
| 3-12 months | Pipeline, blended CAC, channel mix versus prior period | Market-wide comparison |
| 12 months plus | CAC payback against a 16-month median, profitability | Causation from one input |
Where the value shows up first
Before revenue moves, three things change, and all of them are observable inside a quarter. The first is allocation: with growth spending 56.4% weighted to existing market penetration and marketing spend growing just 1.7%, most early value comes from stopping work rather than adding it. The second is measurement, since demonstrating ROI rates 4.2 out of 7 and a baseline is a prerequisite for every later claim. The third is cadence, given 47.1% of leaders default back to established strategies under pressure.
None of those three is a revenue number, and none should be reported as one. They are the leading indicators that a payback case will be provable twelve months later - the sequencing we apply in growth marketing engagements.
| Early value signal | Observable by | Evidence to keep |
|---|---|---|
| Work stopped or reallocated | Day 30 | Before and after budget split |
| Measurement baseline in place | Day 45 | Named metrics with 12 months of history |
| Decision log maintained | Day 60 | What was chosen and what was rejected |
| Review cadence running | Day 90 | Meeting record and scorecard versions |
| Blended CAC trend | Month 6 | Own prior period, not a market benchmark |
The short version
The return on marketing strategy consulting is calculable, but only against a baseline the buyer owns and a window that matches the economics. Build the four inputs, publish the counterfactual, and judge the engagement on the decisions it changed inside ninety days and on payback across a year. Anything faster is a story; anything vaguer is a deck. If you want that arithmetic run against your own numbers before you commission the work, get in touch, or read our channel-level ROI analysis for the same discipline applied to paid media.
Related reading
- AI Marketing Advisory Statistics: ROI and Payback
- Marketing Strategy Consulting: how to choose a provider
- Growth Consulting Statistics: ROI and Payback in 2026
- Marketing Strategy Consulting services at Web Tonic
Frequently Asked Questions
How do you calculate the ROI of a marketing strategy engagement?
With four inputs you already own. Total cost is the fee plus the internal hours the engagement consumes. Blended gross margin comes from the trailing twelve months in finance, not from your best product. Dividing cost by margin gives the revenue the advice has to influence to break even. The fourth input is the decision window - your sales cycle plus reporting lag - which should be judged against a market median CAC payback of 16 months. Advice has no attribution model, so the maths has to be built from numbers that already exist.
What is a realistic payback period?
Benchmarkit's calendar-2025 data puts median CAC payback at 16 months, improved from 18 - an 11% gain - with a first quartile of 10 months, a fourth quartile of 24 and a top quartile at six months or less. The fastest-growing companies in the sample recover acquisition cost in 10 months against 18 for slower growers. That population is B2B software, so treat it as a directional reference rather than a rule for every category.
Why is proving marketing ROI still so difficult?
Because teams rate themselves poorly at it. In The CMO Survey's 2026 data, generating ROI from marketing technology scores 4.5 out of 7 and demonstrating that ROI scores 4.2, with training at 3.9 and hiring at 3.7. None of those improved since 2024. On the content side, 33% of B2B marketers name measuring effectiveness as a top-three challenge. A strategy engagement that inherits an unmeasured baseline cannot produce a defensible payback number, which is why the measurement work usually has to come first.
What outcomes correlate with strategy discipline?
The clearest contrast comes from professional services. Hinge's High Growth Study 2026 reports median growth of 9.9%, the lowest since 2018, split into 36.6% for High Growth firms, 8.5% for Average Growth and -11.4% for No Growth firms, with profitability at 39.5%, 29.6% and 20.3% respectively. High-growth firms also spend 12.0% of revenue on marketing against 5.0%. These are correlations from a survey, not proof of causation - useful for setting expectations, not for guaranteeing outcomes.
Does running a formal operating system improve results?
Vendor-published research suggests it helps, and should be read with that bias in mind. EOS Worldwide cites TrueSpace research, described as Gallup-validated and propensity-matched across 305 companies, finding that companies running EOS with a professional implementer grew 2.8 times faster. It is vendor research on a vendor's methodology, so treat it as supporting evidence for operating cadence rather than an independent benchmark.
Sources
Benchmarkit - B2B SaaS Performance Metrics Benchmarks (CY-2025)
The CMO Survey - Highlights and Insights Report 2026
Hinge Research Institute - High Growth Study 2026
Content Marketing Institute - B2B Content and Marketing Trends 2026
Constant Contact - Small Business Now Report, Q1 2026
EOS Worldwide - TrueSpace research on EOS implementer growth
GoFractional - Fractional CMO Rates 2026


