Table of contents

A marketing KPI scorecard is bought either as a short build project or as a light monthly retainer, and the honest price range in 2026 is wide because "scorecard" covers everything from one weekly page to a governed BI stack. The cost that matters is the one you are already paying in manual reporting hours.
Key Takeaways
- Advisory-style scorecard work prices like senior consulting: $150–$500 an hour (average near $325), $1,500–$3,500 a day, or $2,500–$6,000 a month for a light advisory retainer.
- Full analytics and dashboard builds sit in a different band — mid-market BI projects at $15,000–$60,000 and enterprise programmes at $60,000–$200,000+, with specialist data rates of $200–$350 an hour.
- The cost of not doing it is measurable: 60 hours a month of manual reporting at a $40 internal hourly cost is $2,400 a month, or $28,800 a year, before decision delays.
- Agency-side, 3 hours of manual reporting per client per week across 8 clients at $60 an hour is about $75,000 a year of overhead.
- Reporting overhead is structural, not personal: in one tracked study, coordination took 32% of the week, tools 23% and dashboards 15%, leaving execution under 25%.
- Automation moves it — removing 70% of manual reporting effort is worth roughly $20,160 a year in the same worked example, and one commissioned study reported 366% three-year ROI on a BI platform rollout.
- The measurement layer underneath is usually the real gap: 43% of marketers still rely exclusively on last-touch attribution, and attribution tooling typically consumes 2–6% of marketing budget.
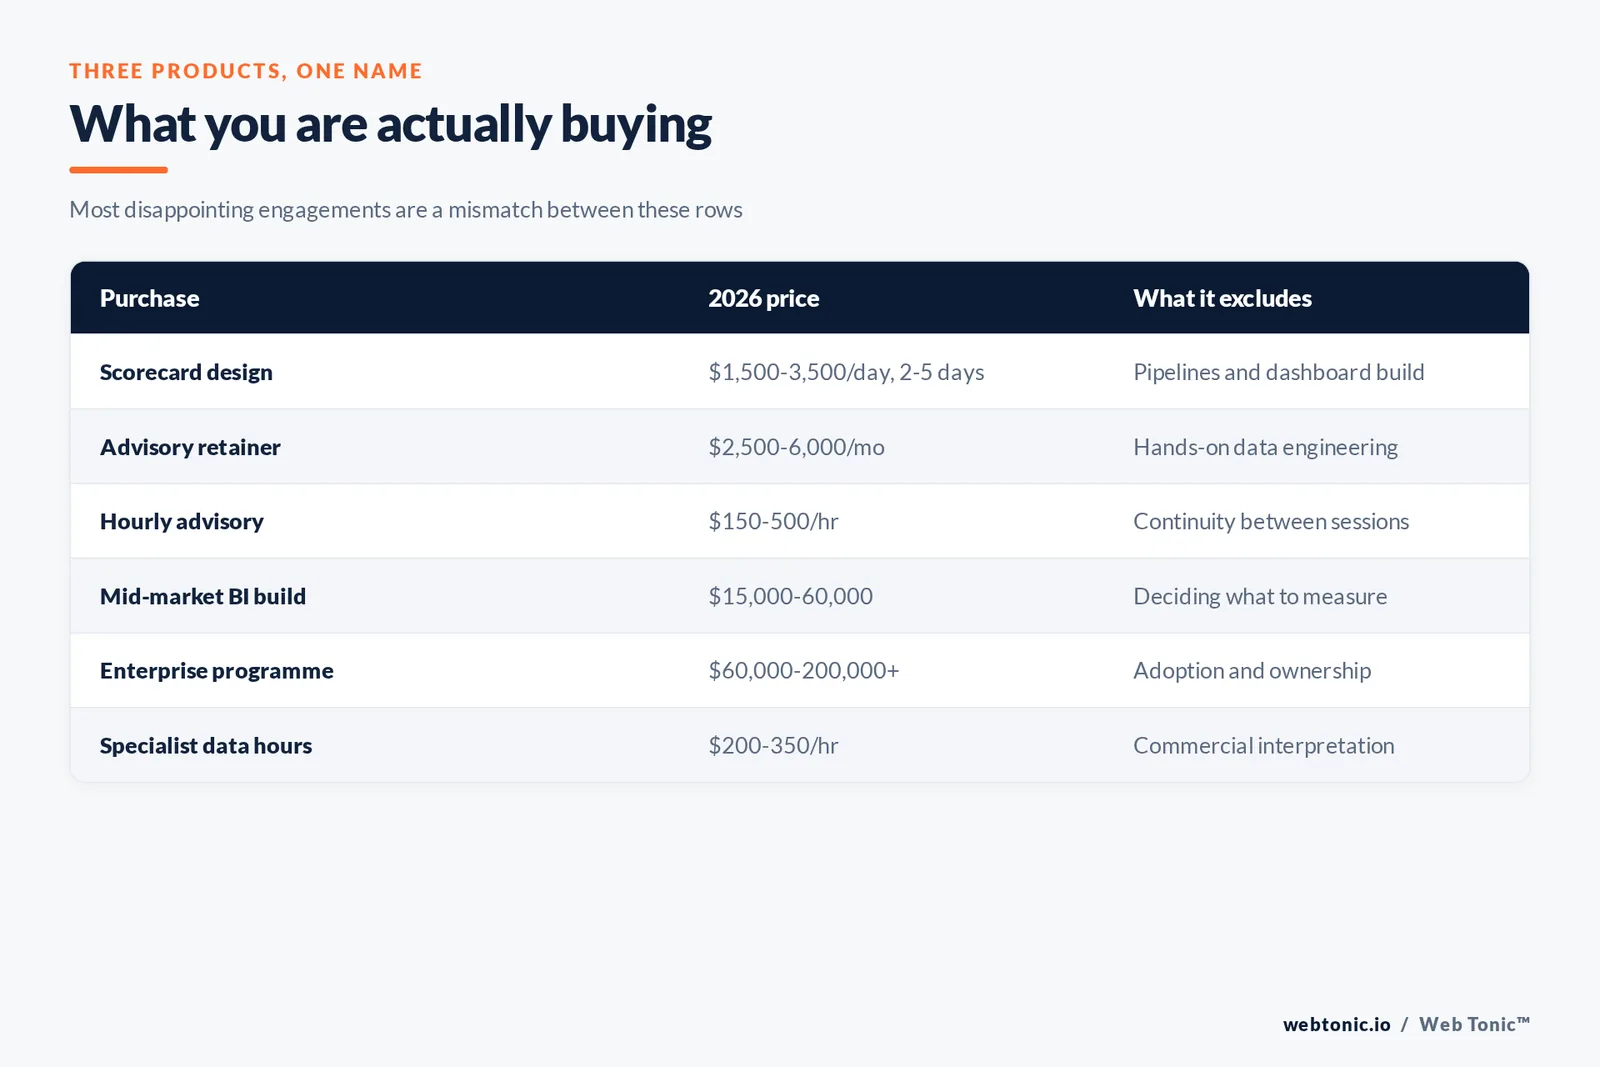
Three different things sold under one name
Before comparing prices, separate the products. The first is a scorecard design: choosing the five to fifteen numbers the business will run on, defining each one unambiguously, and setting the cadence for reviewing them. That is judgement work, priced in senior hours or days. The second is a reporting build: connecting sources, modelling the data and producing the dashboard, which is data-engineering work priced in project fees. The third is an ongoing review — someone chairing the weekly or monthly read and holding owners to the numbers, which is a retainer.
Most disappointing engagements are a mismatch between those three. A company buys a dashboard build when nobody has agreed which numbers matter, or buys advisory hours when the real blocker is that three systems do not reconcile. 2026 agency benchmark data is a useful reference point for what mature reporting cadences look like in practice, and it is worth reading before deciding which of the three you are actually short of.
| What you are buying | 2026 price | What it does not include |
|---|---|---|
| Scorecard design (project) | $1,500–$3,500 / day, 2–5 days | Building the pipelines or the dashboard |
| Advisory retainer | $2,500–$6,000 / mo | Hands-on data engineering |
| Hourly advisory | $150–$500 / hr | Continuity between sessions |
| SMB / mid-market BI build | $15,000–$60,000 | Deciding what the business should measure |
| Enterprise BI programme | $60,000–$200,000+ | Adoption; a governed stack still needs owners |
| Specialist data hours | $200–$350 / hr | Commercial interpretation of the numbers |
Where the build numbers come from
A 2026 analytics pricing guide bands dashboard and BI work by company scale: $15,000–$60,000 as a fixed-price project plus monthly support for small and mid-market builds, and $60,000–$200,000+ phased for enterprise warehouse, governance and predictive work. It also cites market rates for specialists — around $200–$350 an hour for big-data consulting, against in-house data scientist salaries of $54,000–$140,000 — and a marketplace range as low as $25–$49 an hour for generic analytics contractors, which is the band where quality becomes the buyer's problem.
The advisory side prices like any senior consulting: market fee data puts senior growth rates at $150–$500 an hour with an average near $325, 2026 rate data prices workshops and audits at $1,500–$3,500 a day, and mid-market benchmarks put advisory-only retainers at $2,500–$6,000 a month — the tier where someone chairs the review and pressure-tests the numbers without owning delivery.
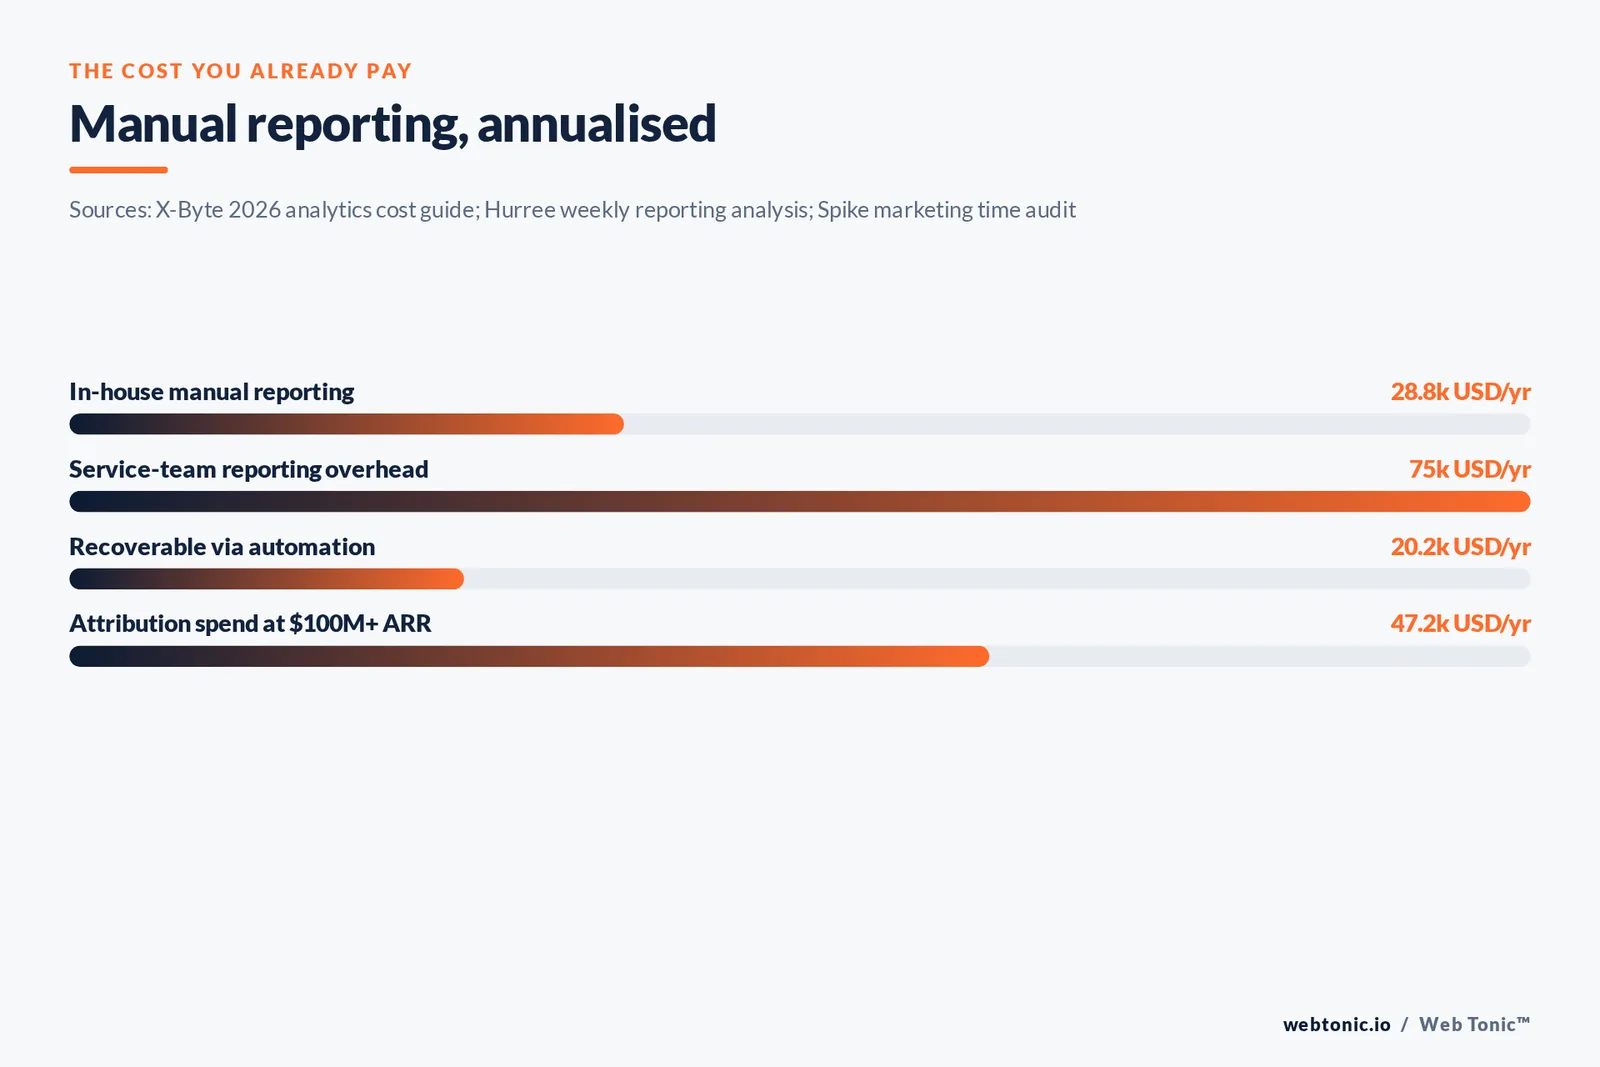
The cost you are already paying
Every company without a working scorecard pays for one in hours. The same pricing guide works the arithmetic: a team spending 60 hours a month preparing manual reports at an internal cost of $40 an hour is spending $2,400 a month, or $28,800 a year, and removing 70% of that effort is worth about $20,160 annually before counting faster decisions and fewer reporting errors. It also cites a commissioned study reporting 366% three-year ROI for organisations building a data culture on a mainstream BI platform.
Agency and in-house service teams see the same maths at larger scale. One analysis of weekly reporting models an account manager spending 3 hours per client per week across 8 clients — 24 hours a week — which at a conservative fully loaded $60 an hour is about $1,440 a week, or nearly $75,000 a year of reporting overhead. That is the number a scorecard engagement should be judged against, not the fee.
And the overhead is structural rather than a discipline problem. A tracked marketing time audit found the biggest sinks were coordination at 32% of the week, tool time at 23% and dashboard time at 15% — with participants unable to push execution time above 25% even when actively time-blocking.
| Hidden cost | Benchmark | Annualised |
|---|---|---|
| In-house manual reporting | 60 hrs/month at $40/hr | $28,800 |
| Service-team reporting | 3 hrs per client per week, 8 clients | About $75,000 |
| Automation upside | 70% of manual effort removed | About $20,160 |
| Dashboard time | 15% of the working week | Roughly 6 weeks a year per person |
| Attribution tooling | 2–6% of marketing budget | $47,200 average at $100M+ ARR |
| Wrong model | 43% use last-touch only | Misallocated budget, unbounded |
What drives your quote up
Four things. Source count: two platforms and a billing system is a small job; six platforms, a CRM, a product database and two legacy properties is a modelling project. Definition debt: if three teams define a qualified lead differently, the first phase is negotiation rather than engineering, and it cannot be skipped. Attribution state: 2026 attribution benchmarks report that 43% of marketers still rely exclusively on last-touch, that cookie-based identity resolution is losing 30–45% of data points, and that attribution spend runs 2–6% of marketing budget (averaging $47,200 a year at $100M+ ARR) — a scorecard sitting on a broken model produces confident wrong answers.
Operating cadence is the fourth and cheapest to fix. A scorecard without a standing review is a dashboard nobody opens. 2026 RevOps research quantifies what disciplined operations produce against teams without it: 23% higher forecast accuracy, 19% faster revenue growth, 15% higher win rates and 31% better data-quality scores — and reports dedicated RevOps adoption at 41% under $5M ARR rising to 96% above $100M. The cadence is what converts a report into those outcomes.
Buying it in the right order
The order matters more than the vendor. A build commissioned before the metric set is agreed will be rebuilt: sources get re-modelled every time a definition changes, and each change is billable. A design agreed before the build, by contrast, tends to shrink the engineering scope, because half the charts a team asks for turn out to be curiosity rather than decisions. Teams that reverse the order typically pay twice and wait twice as long.
Design before build. Two to five days of senior time to agree the metric set, the definitions and the cadence will change what the build has to do, and it routinely shrinks the build. Companies running EOS or a similar operating system already have the ritual — a weekly scorecard with owners and a short list of measurables — and in that case the engagement is mostly about choosing marketing's five to fifteen numbers and wiring them, not about inventing a process.
Then buy the smallest build that serves the design, with support priced separately, and put one named owner on the weekly read. If you want the sequence handled end to end, our marketing scorecard advisory covers design and cadence, data intelligence covers the modelling and automation underneath, and our services overview shows how the two connect. We quote the reporting layer against the hours it removes, and we do not present a number we cannot trace to a source.
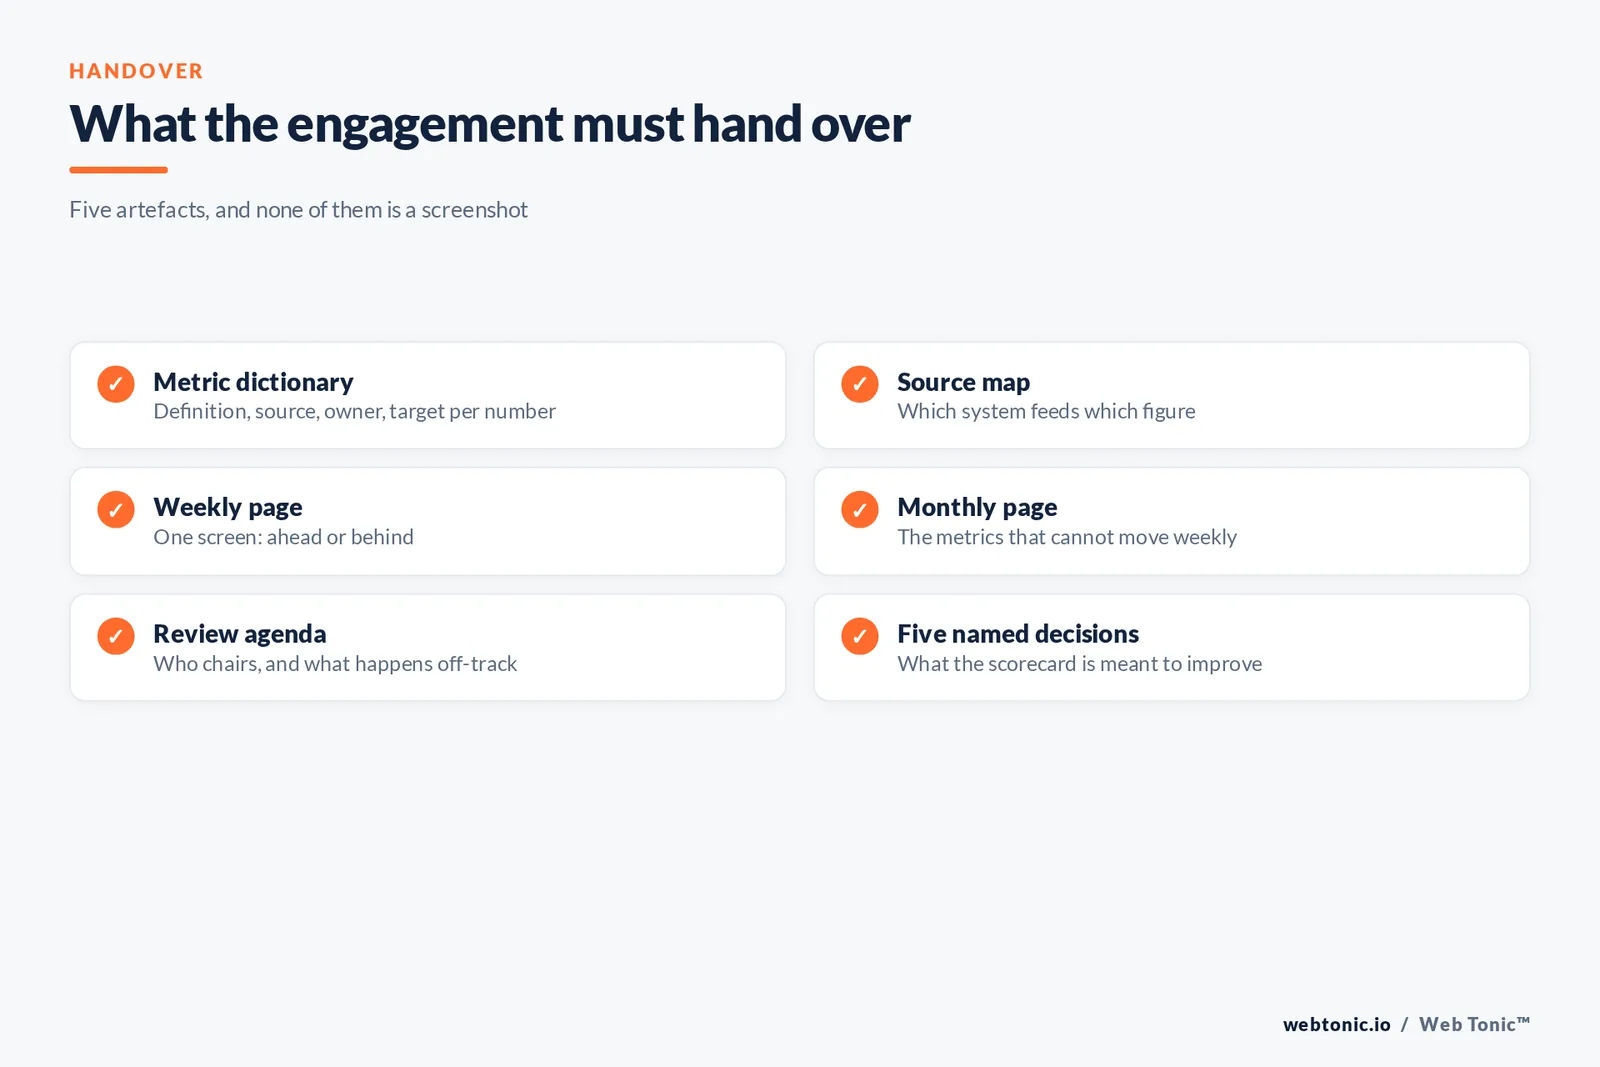
What a scorecard engagement should hand over
Five artefacts, and none of them is a screenshot. A metric dictionary: every number with a one-sentence definition, the system of record, the owner, and the target. A source map showing which platform feeds which figure and where two systems disagree by design. A weekly page that fits on one screen and answers whether the business is ahead or behind. A monthly page for the slower metrics that cannot honestly move week to week. And a review agenda: who chairs, how long, what happens when a number is off-track.
The dictionary is the piece teams skip and the piece that decides whether the scorecard survives. If a qualified lead has one written definition and a named owner, the weekly review is a decision meeting. If it does not, every review re-opens the definition, and within two months people revert to exporting their own numbers — which is exactly the 60-hours-a-month habit the project was meant to remove.
Where the money is usually wasted
Three patterns recur. Buying tooling before definitions: a platform licence does not resolve disagreement about what counts, and attribution tooling already runs 2–6% of marketing budget without touching the definition problem. Building thirty charts when the business runs on eight numbers, which raises the maintenance bill permanently and the decision quality not at all. And building a scorecard nobody owns, which is the most expensive version because the reporting hours continue in parallel with the dashboard's cost.
The corrective is uncomfortable but cheap: before commissioning anything, count the hours your team currently spends assembling numbers, and write down the five decisions the scorecard is supposed to improve. If those five decisions cannot be named, the engagement is not ready to start — and the diagnostic day that surfaces this is the highest-return hour in the whole project.
Which KPIs earn a place on the scorecard
A marketing scorecard that survives contact with a CFO carries four families of metric. Acquisition economics: CAC by channel, blended CAC and cost per qualified lead, each with the spend definition written down. Volume and quality: lead volume, qualified rate and the conversion rate at each stage, so a rise in leads with a falling qualified rate cannot read as progress. Retention and revenue: customer retention, expansion where the product supports it, and revenue per customer. Channel efficiency: return on ad spend or marketing ROI per channel, plus a simple spend-versus-output view that shows where the next dollar should go.
What does not belong is anything nobody will act on. Impressions, follower counts and raw traffic can live in a working dashboard for diagnosis, but on the weekly scorecard they crowd out decisions. The discipline that keeps budgets defensible is the same one that keeps the page short: one owner per number, one definition, and a target that makes the number either green or a conversation.

Frequently Asked Questions
What is a realistic budget for a small team?
Two to four days of design at $1,500–$3,500 a day, plus a small build at the bottom of the $15,000–$60,000 band — or considerably less if your sources are few and clean. Measure your current reporting hours first; that number frames everything.
Can we do this with a template?
You can start with one. Templates fail on definitions, not layout: the same metric name means different things in different systems, and reconciling that is the actual work.
Is a retainer necessary after the build?
Only for the review. A light advisory retainer at $2,500–$6,000 a month buys someone to chair the read and challenge the numbers; maintenance of pipelines is a separate, usually smaller line.
How many metrics should a scorecard carry?
Five to fifteen, each with one owner and one definition. Beyond that, attention fragments and the weekly review becomes a reading exercise rather than a decision meeting.
How soon does it pay back?
The hours case is immediate — removing 70% of a $28,800 annual reporting burden is visible in the first quarter. The decision-quality case shows up over two to three quarters. Read more in our resources or contact us.
Sources
Data analytics services cost and ROI guide 2026 · Why the weekly marketing report takes too long · Marketing time audit framework · Attribution benchmark report 2026 · RevOps report 2026 · Agency benchmarks 2026 · Growth consultant cost benchmarks · 2026 advisory rate data · 2026 mid-market pricing benchmark · EOS scorecard and operating system FAQ.