



Table of contents
Companies build 59.5% of their marketing work in-house, and professional services firms build 70.0% of it. Reporting is one of the functions least likely to leave the building - and one of the most commonly rented while it is being designed.
Key Takeaways
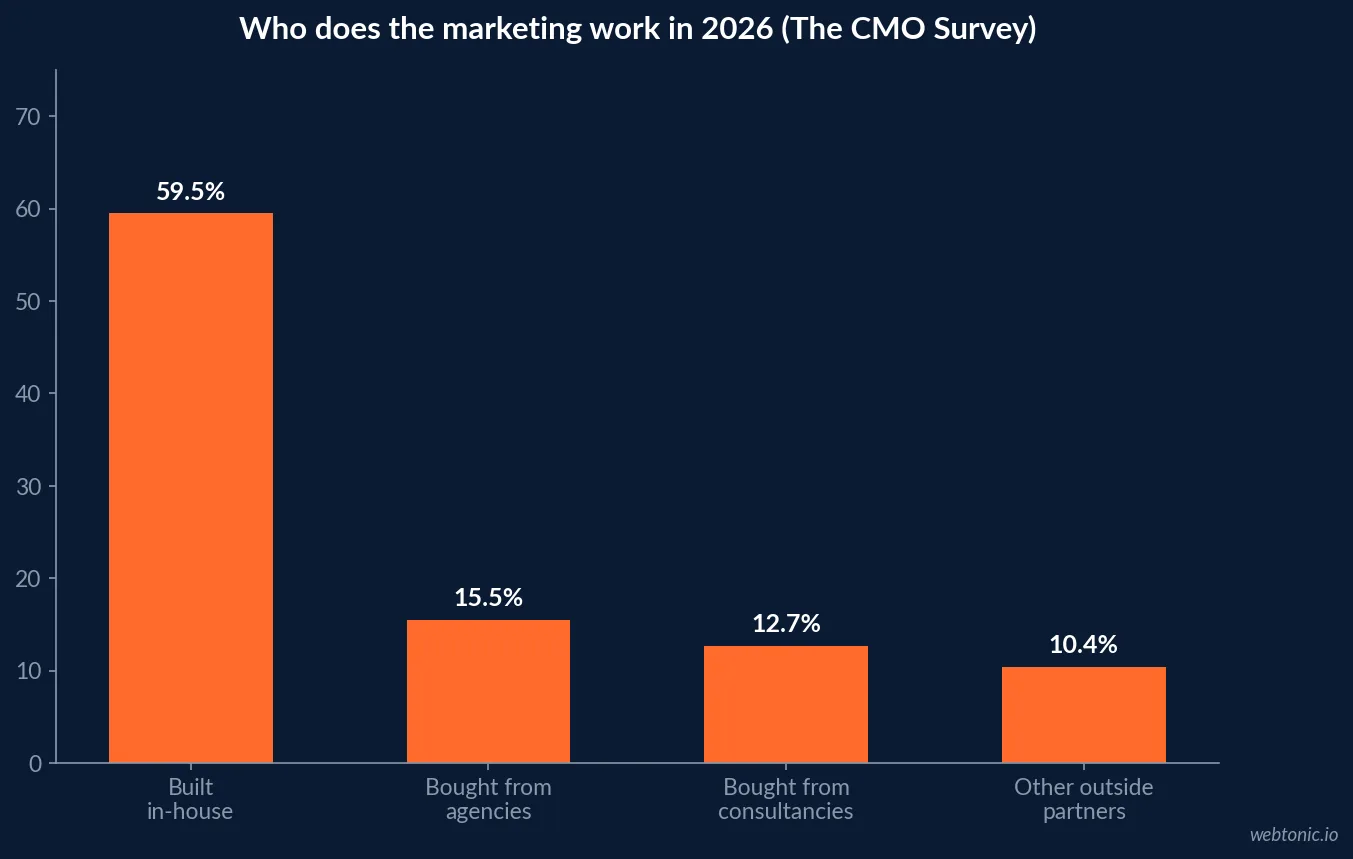
- 59.5% of marketing work is built in-house, 38.5% bought from partners.
- Agencies take 15.5%, consultancies 12.7% and other partners 10.4%.
- 66% of client firms keep at least 26% of work in-house.
- 60% now have some in-house agency capability, up from 40%.
- External delivery of digital activity runs at 33.6%.
- It is expected to reach 34.3% within two years.
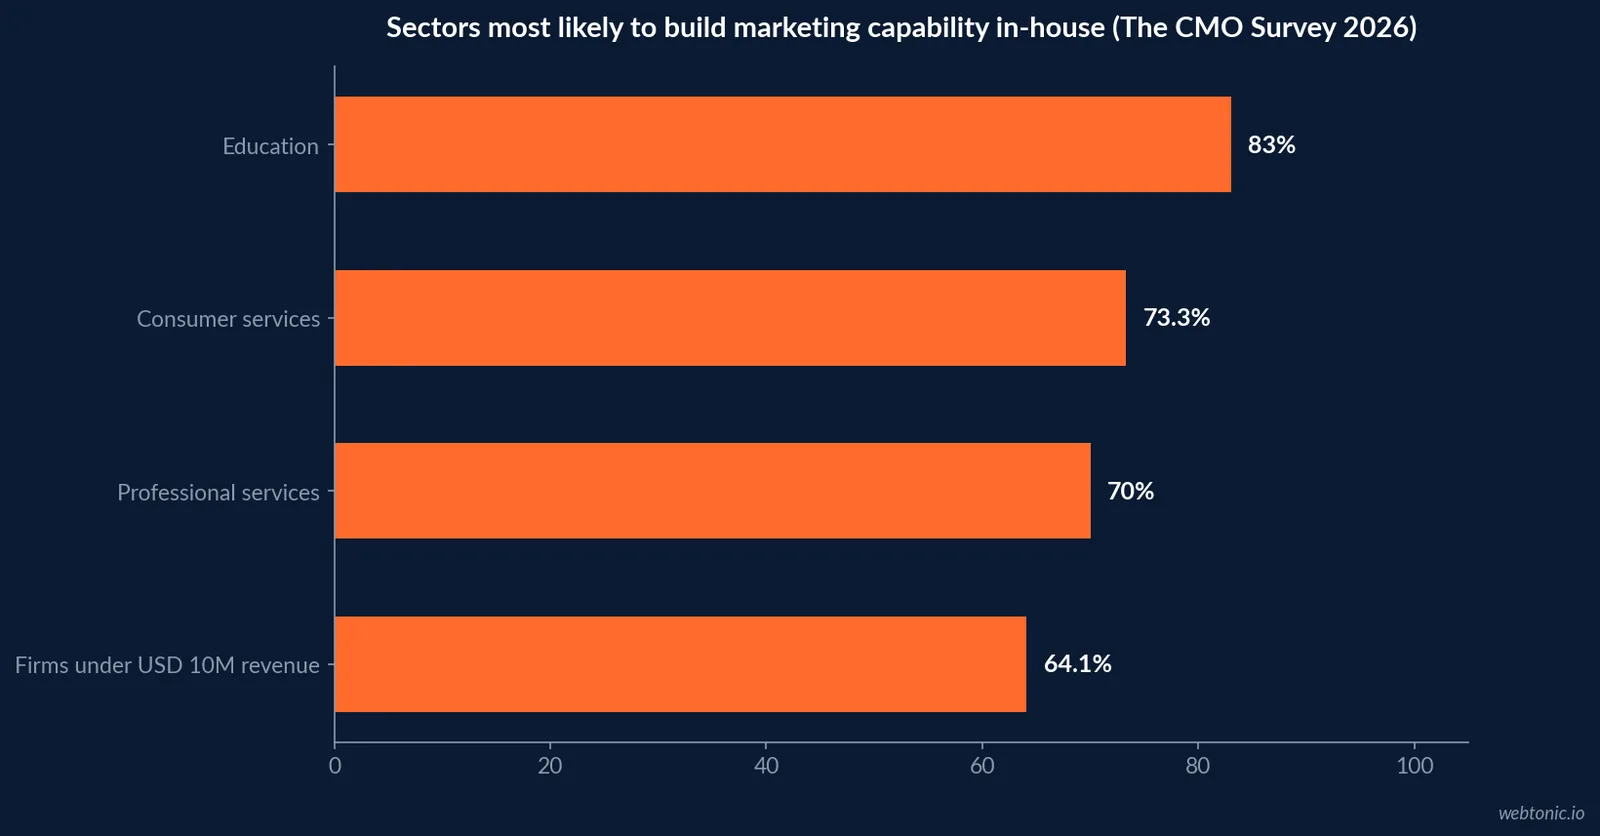
- Education builds 83.0% and consumer services 73.3%.
- Professional services firms build 70.0% in-house.
- Firms under USD 10M in revenue build 64.1%.
- Bandwidth drives 22% of outsourcing decisions, speed 18%.
- Expertise accounts for 15% and cost efficiency 13%.
- S&P 500 CMO tenure averages 4.1 years.
- 31% of large companies have no CMO at all.
- Senior mis-hires can cost up to 213% of salary.
- Fractional demand grew 149% year on year.
The build-versus-buy baseline
The CMO Survey 2026 splits marketing work 59.5% built in-house, 38.5% bought from partners and 1.9% other, with partner spend divided between agencies 15.5%, consultancies 12.7% and other partners 10.4%. In-house build was 57.9% in 2020, so the shift has been small and slow.
External delivery of digital activity sits at 33.6%, up from 31.6% in 2022 and projected at 34.3% within two years. Nothing in that data supports a wholesale move in either direction; it supports choosing function by function.
| Where the work sits | Share of marketing activity | Direction |
|---|---|---|
| Built in-house | 59.5% | Up from 57.9% in 2020 |
| Bought from partners | 38.5% | Broadly flat |
| Agencies specifically | 15.5% | Largest single partner type |
| Consultancies | 12.7% | Second largest |
| Other partners | 10.4% | Includes freelance and specialist |
| External digital delivery | 33.6% | 34.3% expected in two years |
Reporting is a keep, not a send
RSW/US's 2026 New Year Outlook finds 66% of client firms keeping at least 26% of work in-house and 60% with some in-house agency capability, up from 40% a year earlier.
Scorecard work fits that pattern for a structural reason: the disputes are about definitions, and definitions are internal politics as much as data. An outside team can propose them and stress-test them, but the person who defends a number in a leadership meeting has to be in the room every week.
Sector matters more than size
The CMO Survey's in-house build rates run education 83.0%, consumer services 73.3% and professional services 70.0%, with firms under USD 10 million in revenue at 64.1%. On the externalising side, digital activity is outsourced at retail 57%, consumer packaged goods 55%, technology 28%, media 10% and education 3%, and by model at B2C product 48%, B2C services 44%, B2B product 28% and B2B services 25%.
If you are a B2B services firm, the base rate says you will build. Budget for building well rather than relitigating whether to build at all.
| Segment | In-house build rate | External digital delivery |
|---|---|---|
| Education | 83.0% | 3% |
| Consumer services | 73.3% | 44% (B2C services) |
| Professional services | 70.0% | 25% (B2B services) |
| Firms under USD 10M revenue | 64.1% | Not separately reported |
| Retail | Not separately reported | 57% |
| Consumer packaged goods | Not separately reported | 55% |
Why work actually gets outsourced
Sagefrog's 2026 B2B Marketing Mix Report ranks the reasons: bandwidth 22%, speed 18%, expertise 15%, cost efficiency 13%, a rebrand 11%, fresh ideas 11%, a launch 8% and a transition 2%. Delivery structures split hybrid 35%, project 28%, retainer 24% and freelancers 12%.
Only expertise and fresh ideas - about a quarter of stated reasons - are arguments for buying judgement. The rest are arguments for buying hours, and a scorecard bought as hours tends to arrive as a dashboard nobody owns.
The cost of getting the hire wrong
Talentfoot puts the floor cost of a bad hire at 30% of first-year earnings under US Department of Labor guidance, senior mis-hires at up to 213% of salary and retained search at 25% to 35%. Spencer Stuart adds that S&P 500 CMO tenure averages 4.1 years against 5.0 for the C-suite, 31% of companies have no CMO and 77% of vacancies are filled within six months.
A reporting hire made to fix an undiagnosed problem is the classic expensive version of this. Diagnose first, then hire against a written scope.
| Decision | 2026 evidence | What it argues for |
|---|---|---|
| Hire now | Professional services build 70.0% | Internal ownership once scope is settled |
| Rent for two quarters | Fractional demand up 149% YoY | Diagnosis and build without headcount |
| Hybrid | 35% of B2B firms run hybrid | Internal owner, external challenge |
| Do nothing | Only 52% call governance mature | Rarely defensible |
The rentable half of the work
Fractional Jobs reports 149% year-on-year demand growth, about 150,000 US practitioners, marketing at 20% of demand, 87% with eleven or more years of experience, 64% serving multiple clients and 90% who will not return to full-time roles. Vendux cites Gartner expecting more than 30% of midsize companies to use fractional executives by 2027.
That is a deep enough market to rent the design phase from, which is precisely the phase where a wrong permanent hire does the most damage.
What stays internal no matter who builds it
Three things: the definition of each metric, the owner of each line, and the decision each line triggers. With governance mature for only 52% of top performers per the Content Marketing Institute and measurement a challenge for 33% of organisations, these are the parts an external party cannot hold for you.
Everything else - data joins, dashboard construction, benchmark sourcing, the first two quarters of facilitation - is legitimately rentable, and usually cheaper rented. Our data intelligence team works to that division of labour.
| Component | Keep or rent | Reason |
|---|---|---|
| Metric definitions | Keep | Internal disputes, internal context |
| Line owners | Keep | Accountability cannot be outsourced |
| Decision rules | Keep | Leadership authority sits inside |
| Data joins and dashboards | Rent | Repeatable technical work |
| Benchmark sourcing | Rent | Specialist research, low frequency |
| First two quarters of facilitation | Rent | Cadence habit, then hand over |

The hybrid default
Sagefrog's 35% hybrid share is not a compromise, it is the shape most of the evidence points to for reporting: an internal owner with the authority to freeze a definition, plus an external party paid to challenge the numbers and build the plumbing. The CMO Survey's 59.5 / 38.5 split describes the same balance at portfolio level.
If you want that split written down for your own scorecard, our growth team can draft it, or send us your current reporting pack and we will mark up which lines belong on which side.
What the growth data says about internal capability
Hinge's 2026 High Growth Study reports median growth of 9.9%, the lowest since 2018, with high-growth firms at 36.6%, average at 8.5% and no-growth at -11.4%. High-growth firms spend 12.0% of revenue on marketing against 5.0%, referrals supply 39.5% of leads and outreach 23.5%, and 80% run research against 20% running none.
The tiers matter for this decision. A firm spending 5.0% of revenue on marketing cannot usually fund a senior internal reporting hire; a firm at 12.0% often can, and the referral share tells you which lines the board should carry first.
| Growth tier | Median growth | Marketing spend of revenue | Realistic ownership model |
|---|---|---|---|
| High growth | 36.6% | 12.0% | Internal owner, external challenge |
| Average growth | 8.5% | Between the extremes | Hybrid, part-time senior input |
| No growth | -11.4% | 5.0% | Rent the diagnosis first |
| All firms median | 9.9% | Not separately reported | Depends on tier, not size |
Sequencing beats choosing
Rent the diagnosis, then decide. Two quarters of external work produces a written definition set, a working board and evidence of how much time the cadence actually takes - which is the input a job description needs and rarely has. Against a mis-hire ceiling of 213% of salary and CMO tenure of 4.1 years, that sequence is cheap insurance.
It also matches the market. With 149% demand growth and 87% of fractional practitioners holding eleven or more years of experience, senior short-term capability is available now, while 77% of CMO vacancies still take up to six months to fill.
What a rented engagement should hand back
Four artefacts, all of which stay useful after the invoice stops: a written definition per metric, a named owner per line, a decision rule per line, and a data-source map. With governance mature for only 52% of top performers and measurement a challenge for 33% of organisations, these are the parts that decide whether the board survives a change of staff.
If a proposal does not list them, the engagement is selling attendance. Ask for the handover list before the kick-off, and check it against the outsourcing reasons Sagefrog measured - bandwidth 22% and speed 18% are capacity, and capacity leaves when the contract does. The same logic applies to any paid-channel decision we publish on.
| Handover artefact | Test it passes | Why it outlasts the contract |
|---|---|---|
| Definition per metric | Two people quote the same number | Ends the weekly definition argument |
| Owner per line | Someone explains movement unaided | Accountability stays internal |
| Decision rule per line | A threshold triggers an action | Prevents reporting for its own sake |
| Data-source map | One source per metric | Stops duplicate, conflicting figures |
| Cadence agenda | Meeting runs without the adviser | Habit, not facilitation |
Related reading
- AI Marketing Advisory Statistics: Hiring vs Outsourcing
- Growth Consulting Statistics: Hiring vs Outsourcing in 2026
- EOS / Scorecard & KPI Advisory: vs hiring in-house
- Marketing Strategy Consulting services at Web Tonic
Frequently Asked Questions
Should the marketing scorecard be owned internally or outsourced?
Ownership of the numbers should be internal; the build and the challenge can be external. The CMO Survey 2026 reports 59.5% of marketing work built in-house against 38.5% bought from partners, and RSW/US finds 66% of client firms keeping at least 26% of work in-house. Reporting is exactly the kind of work companies keep, because the definitions are contested and the context is internal.
What share of marketing work do companies keep in-house in 2026?
The CMO Survey 2026 puts the split at 59.5% built in-house, 38.5% bought from partners and 1.9% other, with agencies at 15.5%, consultancies at 12.7% and other partners at 10.4%. External delivery of digital activity runs at 33.6% and is expected to reach 34.3% within two years, so the balance is close to stable rather than shifting sharply.
Which sectors are most likely to build capability internally?
Education at 83.0%, consumer services at 73.3% and professional services at 70.0% are the most in-house sectors in The CMO Survey 2026, and firms under USD 10 million in revenue sit at 64.1%. At the other end, retail externalises 57% of digital activity and consumer packaged goods 55%, against 28% for technology and 10% for media.
When is hiring a reporting lead the wrong move?
When the scope is still being discovered. Talentfoot notes a bad-hire floor of 30% of first-year earnings per US Department of Labor guidance and senior mis-hires reaching 213% of salary, while Spencer Stuart puts S&P 500 CMO tenure at 4.1 years. Hiring against an undefined scorecard scope buys a permanent cost for a problem that has not been diagnosed yet.
Why do companies outsource marketing work at all?
Sagefrog's 2026 B2B Marketing Mix Report ranks the reasons: bandwidth 22%, speed 18%, expertise 15%, cost efficiency 13%, a rebrand 11%, fresh ideas 11%, a launch 8% and a transition 2%. Only expertise and fresh ideas are arguments for outsourcing judgement; the rest are arguments for renting capacity.
Sources
The CMO Survey - Highlights and Insights Report 2026
RSW/US - 2026 New Year Outlook Report
Sagefrog - 2026 B2B Marketing Mix Report
Talentfoot - The cost of a leadership mis-hire, 2026 data
Spencer Stuart - CMO Tenure 2026 Snapshot
Fractional Jobs - The Fractional Work Report
Vendux - 10 numbers on fractional executives in 2026
Content Marketing Institute - B2B Content Marketing Trends 2026
Hinge Research Institute - 2026 High Growth Study


