



Table of contents

A marketing operations engagement is won or lost in its first quarter, and almost always for the same reason: whether the numbers were verified before anything was automated.
Key Takeaways
- The sequence is fixed: access and inventory, then measurement verification, then data model and hygiene, then process and routing, then reporting, then automation. Automating before verifying industrialises the error.
- Days 1–30 are diagnostic. A CRM, data model and reporting review typically takes a few days to a month, and providers who charge separately for it price onboarding around $5,000.
- Expect ugly findings. Practitioner audits find 45–70% of pipeline sitting in unhelpful source buckets and another 20–30% with partial UTMs.
- Data hygiene is not a phase you can skip: 99% of RevOps teams report technical data issues, and 71% of those who rated their data "good enough" still said quality hurt execution.
- By day 90 you should own a governance owner, a documented data model, one source of truth and a written decision log — only 41% of organisations have that owner today.
- Consolidation belongs in this quarter too: 67% of RevOps leaders plan to cut tool count, with top teams running 7–8 tools against an average of 12.
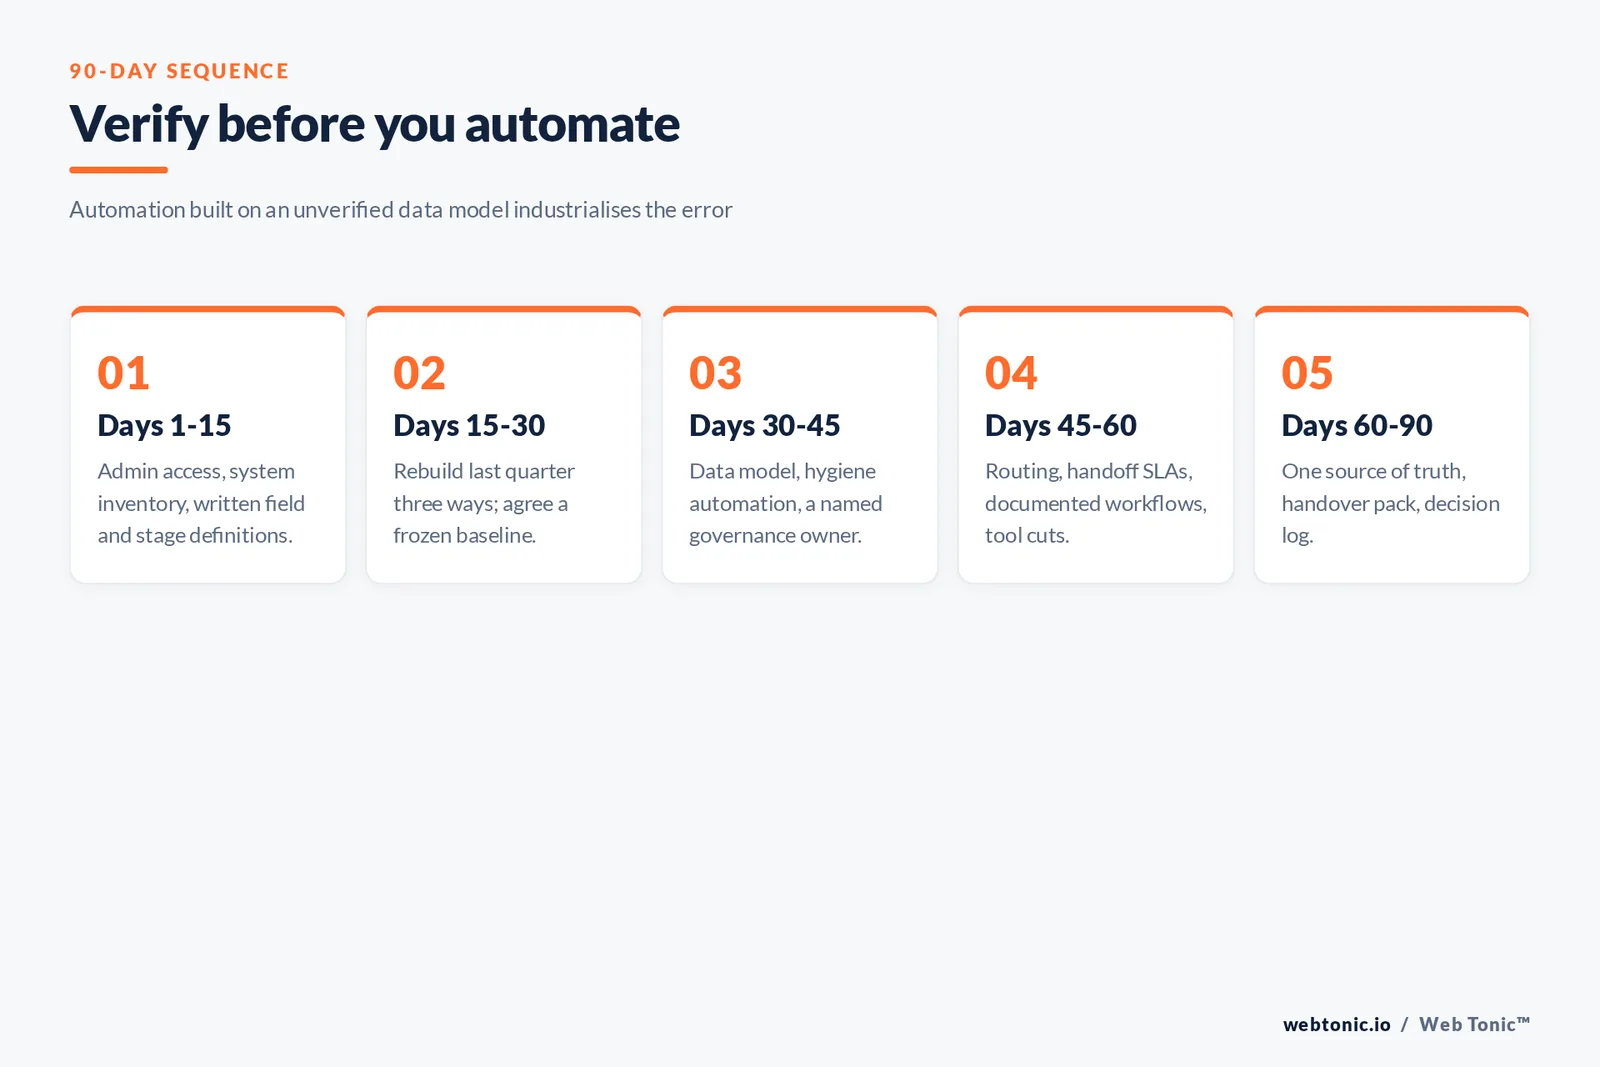
Days 1–15: access, inventory, and the definitions nobody wrote down
Nothing starts until access is complete. CRM admin, marketing automation, ad platforms, analytics, the data warehouse if one exists, and the integration layer between them. Partial access is the most common cause of a wasted first month, because a consultant who can see marketing but not opportunities cannot verify a single revenue number.
Then the inventory. Every system, every integration, every automated workflow, and — the item teams always underestimate — every field definition. What makes a lead an MQL, who can create a record, which stage means "verbally committed". Most disputes about marketing performance are disputes about definitions, and they are cheap to settle in week one and expensive to settle at the quarterly review.
The stack count matters here as an early scope signal. A tech-stack audit checklist for operations teams notes enterprises averaging around 90 tools with most capability unused, and cites analyst work suggesting billion-dollar companies with average utilisation can waste up to $8.5m. Meanwhile a 2026 report drawn from 1,200-plus B2B companies puts the average revenue stack at 12 tools, top performers at 7–8, and mid-market tool spend at roughly $2,400 per rep per month. Write the list down in week one; you will cut from it in month three.
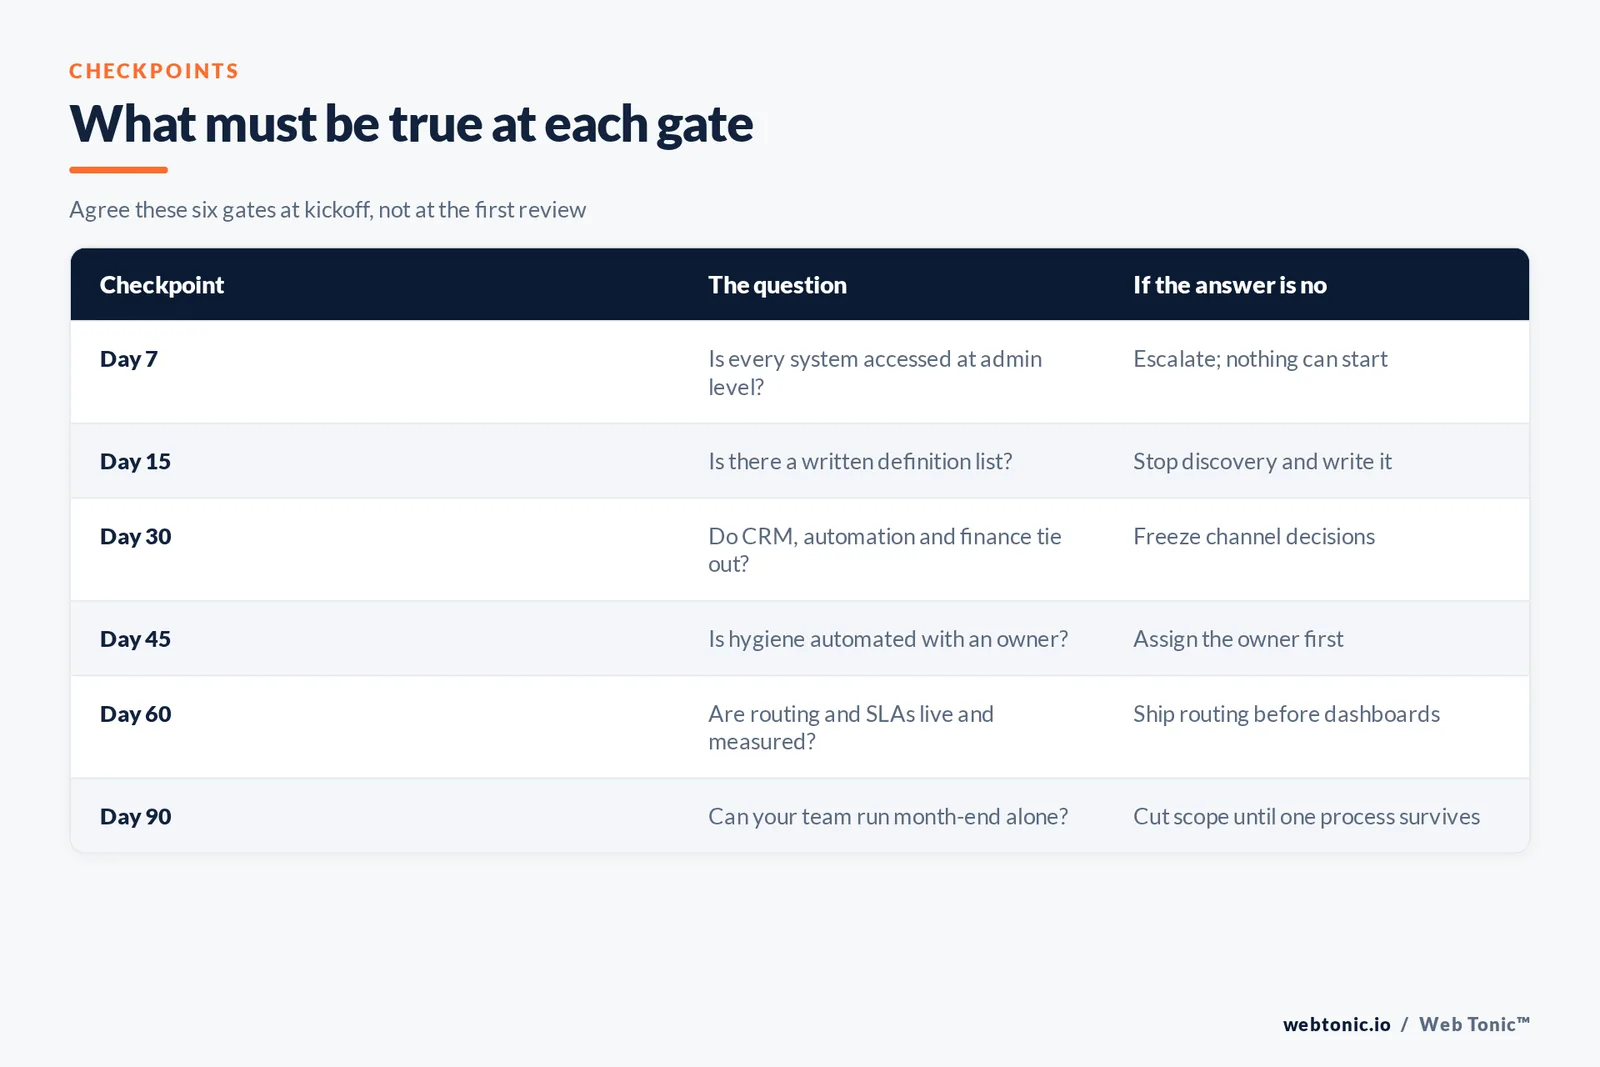
| Checkpoint | The question | If the answer is no |
|---|---|---|
| Day 7 | Is every system accessed at admin level? | Escalate; the diagnostic cannot start |
| Day 15 | Is there a written list of field and stage definitions? | Stop discovery and write it with sales |
| Day 30 | Do CRM, automation and finance numbers tie out? | Freeze channel decisions until they do |
| Day 45 | Is hygiene automated, with a named owner? | Assign the owner before building workflows |
| Day 60 | Are routing and handoff SLAs live and measured? | Ship routing before dashboards |
| Day 90 | Can your team run month-end without the consultant? | Cut scope until one process survives handover |
Days 15–30: verify the numbers before touching anything
This is the phase that separates operations work from tool work. Take last quarter and rebuild it three ways: from the CRM, from the marketing platform, and from finance. Where they disagree, find out why — duplicate records, records created by an integration, closed-won dates that moved, or a stage that means different things to two teams.
Attribution deserves its own audit, because the failure is usually invisible. 2026 accuracy benchmarks put single-model attribution at 38–58% accuracy against 82–92% for a hybrid stack, and note that 30–50% of B2B pipeline originates in dark-funnel sources no click model captures. A practitioner teardown of post-Series-B pipelines reports 45–70% of pipeline in unhelpful buckets such as direct, 20–30% with partial UTMs and 10–15% with none at all.
Signal loss compounds it. 2026 attribution benchmarks describe roughly 38% of available data becoming unusable through cookie deprecation, with first-party cookies under a seven-day window losing about 22% of conversions. The output of this phase is not a fix — it is a written statement of what your data can and cannot prove, and a frozen baseline everyone signs.
Days 30–45: the data model and hygiene layer
With the baseline agreed, rebuild the foundation. Object mapping, required fields, deduplication rules, record creation rules, and automated hygiene. The published four-pillar structure most providers use — process design, system integration, data model and maintenance, reporting and analytics — puts this pillar third for a reason, and the 2026 buyer's guide to revenue operations services is explicit that unreliable data is the most common reason RevOps initiatives fail, citing survey findings that 99% of respondents struggle with technical data issues and 71% of those who rated their data acceptable still said quality hurt go-to-market execution.
Governance gets created here, not later. Validity's 2026 survey of 500 marketing professionals found only 41% of organisations have a dedicated data governance team or owner, while 62% report losing revenue directly to poor CRM data and nearly a third of teams spend 6+ hours a week fixing and reconciling records. The same survey shows what practitioners want most: continuous automated monitoring, cited by 39% overall and 47% of C-suite respondents, well ahead of consolidating onto one platform at 23%.
The AI dimension raises the stakes for this specific fortnight. Two in three organisations increased the marketing decisions delegated to autonomous agents in the past year, yet just 21% say their CRM data is very well prepared to support AI. A bad record used to produce a bad report; now it can produce an action.
Days 45–60: process, routing and handoffs
Now the workflows. Lead routing with owners and fallbacks, handoff SLAs measured in minutes, lifecycle stages that match how deals actually progress, and renewal or expansion workflows if customer success is in scope. This is where the engagement starts producing felt improvements: sales stops complaining about lead quality when routing and definitions are fixed, because most "quality" complaints are timing and ownership complaints in disguise.
Keep the build small and reversible. Two routing rules that everyone understands beat fourteen that only the consultant can trace. Document each workflow as you ship it, with the business rule in plain language above the technical implementation, so a new hire can read intent rather than reverse-engineer it.
This is also the right point to attack the tool list assembled in week one. With 67% of RevOps leaders planning to reduce tool count, cutting two overlapping platforms in month two usually funds a meaningful share of the engagement — and every removed integration is one fewer silent sync failure. Treat the widely repeated utilisation statistics with care, though: a 2026 review of martech benchmarks notes the headline 49% utilisation figure is published without sample detail, and warns against assuming the remaining half is wasted spend.
Days 60–90: reporting, handover and the decision log
The last month builds the thing the business will actually use: one source of truth. Spend, pipeline created, pipeline coverage, conversion by stage, cycle length and cost per acquisition, all from a single definition set. Pipeline velocity — pipeline generated per dollar of sales and marketing spend — is named the top RevOps metric for 2026 in the same 1,200-company report, and it is a good forcing function because it cannot be produced without both the spend and the revenue side being clean.
Then hand it over. A finished quarter means your own team can run month-end reporting, explain every definition, and change a routing rule without a ticket. Anything only the consultant can operate is unfinished work, however elegant. Ask for the artefact set explicitly: data dictionary, integration map, workflow documentation, reporting definitions and a named internal owner.
Close with a written decision log — what changed, why, what was deliberately not done, and what should be revisited next quarter. It is the cheapest insurance against relitigating settled questions, and it is what makes a second engagement productive instead of exploratory. That is how we run the first quarter of marketing operations consulting, with the measurement layer built through data intelligence so the definitions outlive the project.
The platform playbook inside the quarter
Every stack imposes its own order of operations, and a strong consultant arrives with a playbook rather than improvising. On Salesforce with Marketo, the early work is object mapping, sync rules and campaign member handling, because those decisions are painful to reverse later. On HubSpot, the same quarter concentrates on lifecycle stages, deduplication settings and how forms create or update records. Whatever the technology, the processes being encoded are identical: capture, qualify, route, report.
Capacity is the constraint teams misjudge. A ninety-day build needs someone on your side who can answer questions in hours, approve field changes, and pull sales into two or three definition conversations. If that person has no time, the calendar stretches and the momentum dies — which is why kickoff should name the internal counterpart and the weekly hours they will genuinely spend, not the hours everyone hopes exist.
It is also worth deciding early what your team will learn versus what stays outsourced. Marketing ops talent is scarce enough that most mid-market companies aim for one internal generalist who can operate the system confidently and escalate the deep platform work. Build the training into the quarter — recorded walkthroughs, a written runbook, one supervised month-end close — rather than promising it for the week after the engagement ends.
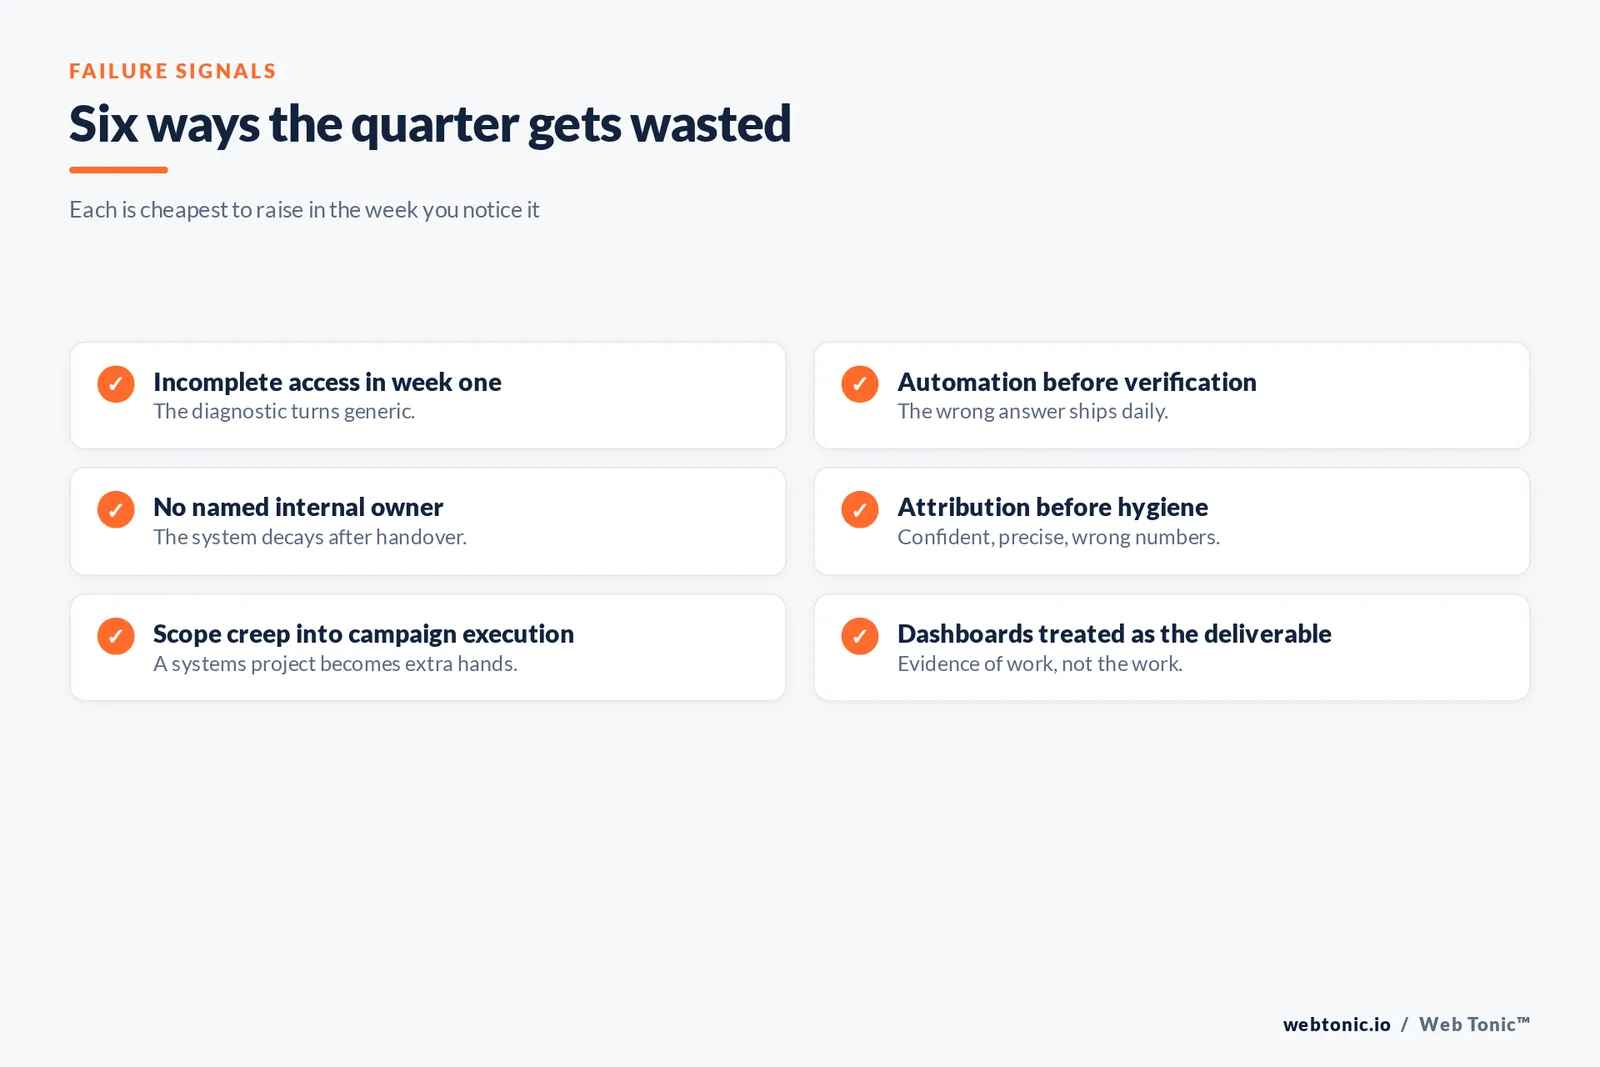
Six ways the quarter gets wasted
First, incomplete access in week one. The diagnostic goes generic, and generic diagnostics produce generic recommendations. Second, automation before verification — the most expensive mistake in the category, because a workflow built on a wrong definition scales the wrong answer daily. Third, no named internal owner, which guarantees the system decays the month after handover.
Fourth, attribution before hygiene. Building a multi-touch model over duplicate records and empty source fields produces confident nonsense; the sequence must be hygiene, then source capture, then modelling. Fifth, scope creep into campaign execution, which quietly converts a systems engagement into an extra pair of hands. Sixth, dashboards as the deliverable. A dashboard is evidence of work, not the work — practitioner complaints about ops engagements cluster precisely here, on more meetings and more reporting with the fundamentals untouched.
A seventh, subtler failure is cultural. The same 2026 CRM data survey found 38% of respondents organisation-wide — and 67% of C-suite respondents — admitting campaign data is sometimes presented to make results look better. A quarter that produces honest numbers will make some previous quarters look worse. Agree in advance that this is the point.
| Phase | Deliverable you keep | Proof it happened |
|---|---|---|
| Days 1–15 | System inventory and definition list | Signed-off glossary, admin access log |
| Days 15–30 | Verified baseline and gap statement | Three reconciliations that tie out |
| Days 30–45 | Data model, hygiene automation, governance owner | Duplicate rate and fill rate before and after |
| Days 45–60 | Routing, SLAs, documented workflows | Lead response time measured in minutes |
| Days 60–75 | Single source of truth reporting | One report both finance and marketing accept |
| Days 75–90 | Handover pack and decision log | Internal owner runs month-end unaided |
What to agree before day one
Three things, in the contract rather than the kickoff. The scope, expressed as system states rather than activities — "duplicate rate under an agreed threshold with automated monitoring" beats "data hygiene support". The hours, disclosed: a 2026 study of seventeen named RevOps consultancies found only two publishing the hours inside their retainers, and where they do, the arithmetic lands at $172–$227 an hour with tiers from $5,499 to $27,000 a month. And exit criteria, so the end of the build is a decision rather than a renewal by default.
Also agree the diagnostic budget separately if the provider charges for it. Published examples run from a free light analysis to a $5,000 one-time onboarding fee that includes the audit, and fixed-scope builds from about $1,500 for a small platform setup to $25,000 for a ninety-day implementation. Paying for a diagnosis you can act on with anyone is usually good value; paying for one that only works inside that provider's retainer is not.
Finally, be honest about the ratio. Benchmarks put staffing at 1 ops person per 25–30 revenue team members, with top performers at 1:15–20. If your quarter ends with a beautiful system and nobody to run it, you have bought a snapshot. More on the operating side of growth sits across the blog, and if you want an outside read on your current stack before committing a quarter to it, start there.

Related reading
- Marketing Strategy Consulting: the first 90 days
- Marketing Audit / Growth Audit: the first 90 days
- Marketing Operations Consulting / RevOps — How to Run the First Strategy Session
- Marketing Strategy Consulting services at Web Tonic
Frequently Asked Questions
What should be finished by day 30?
A complete system inventory, a written definition set agreed with sales, and a reconciliation of last quarter across CRM, marketing automation and finance. If those three are not done, do not start building workflows — every automation will inherit whatever is still unresolved.
Why is attribution work scheduled so late?
Because attribution accuracy is capped by data quality. With single-model attribution at 38–58% accuracy and 30–50% of B2B pipeline originating in dark-funnel sources, modelling on top of duplicate records and empty source fields produces confident, precise, wrong answers. Hygiene first, then source capture, then modelling.
Can 90 days be enough?
Enough to have trustworthy reporting, working routing and a documented model — yes, for most mid-market stacks. Not enough to see the business outcomes: win rate, cycle length and cost per acquisition move over two to three quarters. There is no neutral survey of typical engagement length, so treat provider norms as marketing rather than data.
Who should own this internally?
One named person with admin authority, even if it is a second hat for a marketing manager. Only 41% of organisations have a dedicated data governance owner, and the absence of one is the single best predictor that the system will decay after handover.
What if the audit contradicts our reporting?
Expect it, and plan the conversation. Audits routinely reveal over-credited channels and inflated source data — the same 2026 survey found 38% of respondents admitting campaign data is sometimes massaged, rising to 67% among C-suite. Reset the baseline publicly, then measure improvement from the honest number.
Sources
SyncGTM (2026 RevOps Report, 1,200+ companies), Prospeo (Revenue Operations Services: 2026 Buyer's Guide), Validity via PR Newswire (State of CRM Data Management in 2026, 500 respondents), GrowthSpree (B2B SaaS attribution accuracy benchmarks 2026), EOI Digital (attribution audit findings 2026), Attrifast (2026 attribution benchmark report), HubSpot (marketing operations tech stack audit checklist), Konabayev (martech stack benchmarks 2026), RevPack (fractional RevOps pricing study, seventeen consultancies, July 2026). Accessed September 2026.


