



Table of contents

Operations work is measurable, but not on the axis most people reach for. You cannot judge a marketing ops engagement on leads. You judge it on whether the system is trustworthy, whether the funnel moves faster, and whether the business outcome follows.
Key Takeaways
- Measure in three layers: system health (data and infrastructure), funnel mechanics (speed and conversion), and business outcome (pipeline, cost, win rate). Each moves on a different clock.
- Layer one is the only honest starting point. Baseline duplicate rate, field fill rate, sync failures, and the hours lost to reconciliation — nearly a third of teams spend 6+ hours a week fixing data.
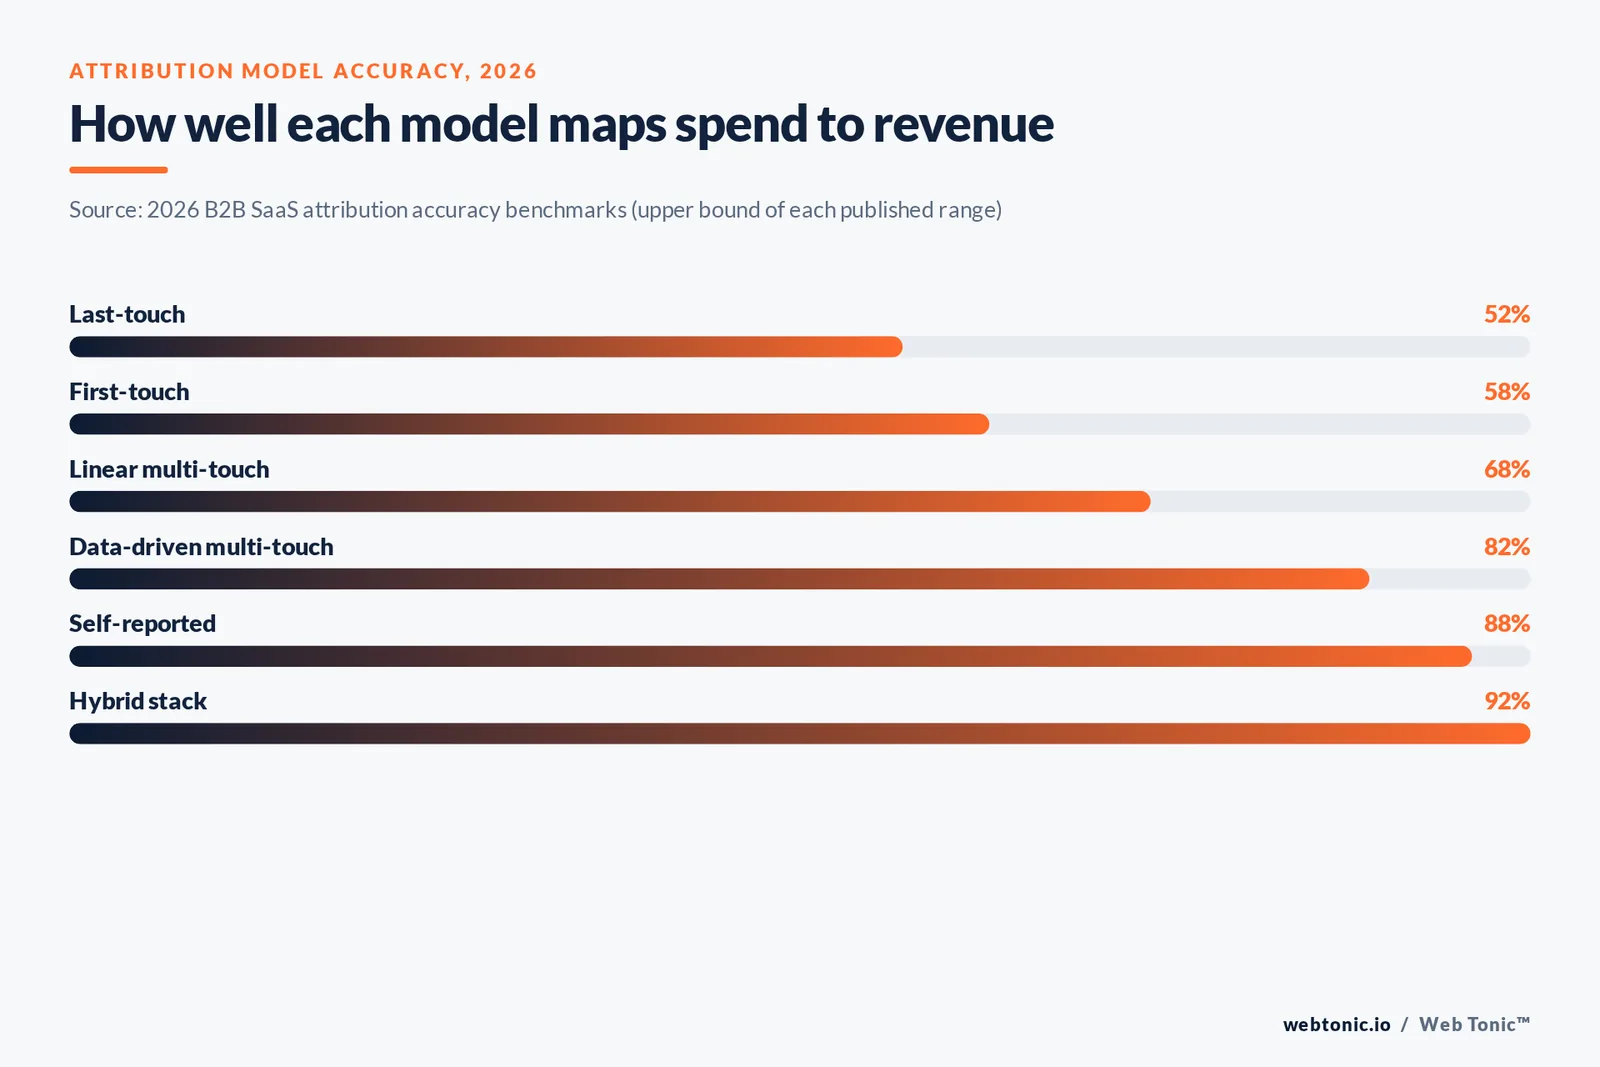
- Attribution capability is itself a metric. Single-model attribution maps spend to revenue at 38–58% accuracy; a hybrid stack reaches 82–92%.
- Track source coverage explicitly. Audits find 45–70% of pipeline in unhelpful buckets and 20–30% with partial UTMs; reducing that share is a real, reportable win.
- Business outcomes lag by two to three quarters. Reported deltas for mature RevOps functions include 19% faster revenue growth, 15% higher win rates and 12% shorter sales cycles.
- Pipeline velocity — pipeline generated per dollar of sales and marketing spend — is the single best summary metric, because it cannot be produced without both sides of the system being clean.
Why the obvious metrics mislead
Lead volume is the wrong scoreboard for operations, for a simple reason: good ops work often reduces recorded lead volume. Deduplication removes records. Stricter definitions demote soft conversions. Honest source capture reveals that a channel credited with a third of pipeline was inheriting it from somewhere else. If your first-quarter chart goes down, the system may be working exactly as intended.
Revenue is the right destination but a terrible early gauge. Even the strongest published claims about the function are lagging and correlational: an analysis of RevOps adopters reports roughly 3x faster revenue growth and 71% higher stock performance among public companies with the function, and HubSpot's summary of Deloitte Digital research found organisations with an established RevOps function were 1.4x as likely to beat revenue goals by 10% or more. Useful direction, useless as a 60-day test.
So measure the thing you actually bought. You bought a system that can be trusted and a funnel that leaks less. Those are observable within weeks, and they are the leading indicators of the revenue numbers everyone wants to see later.
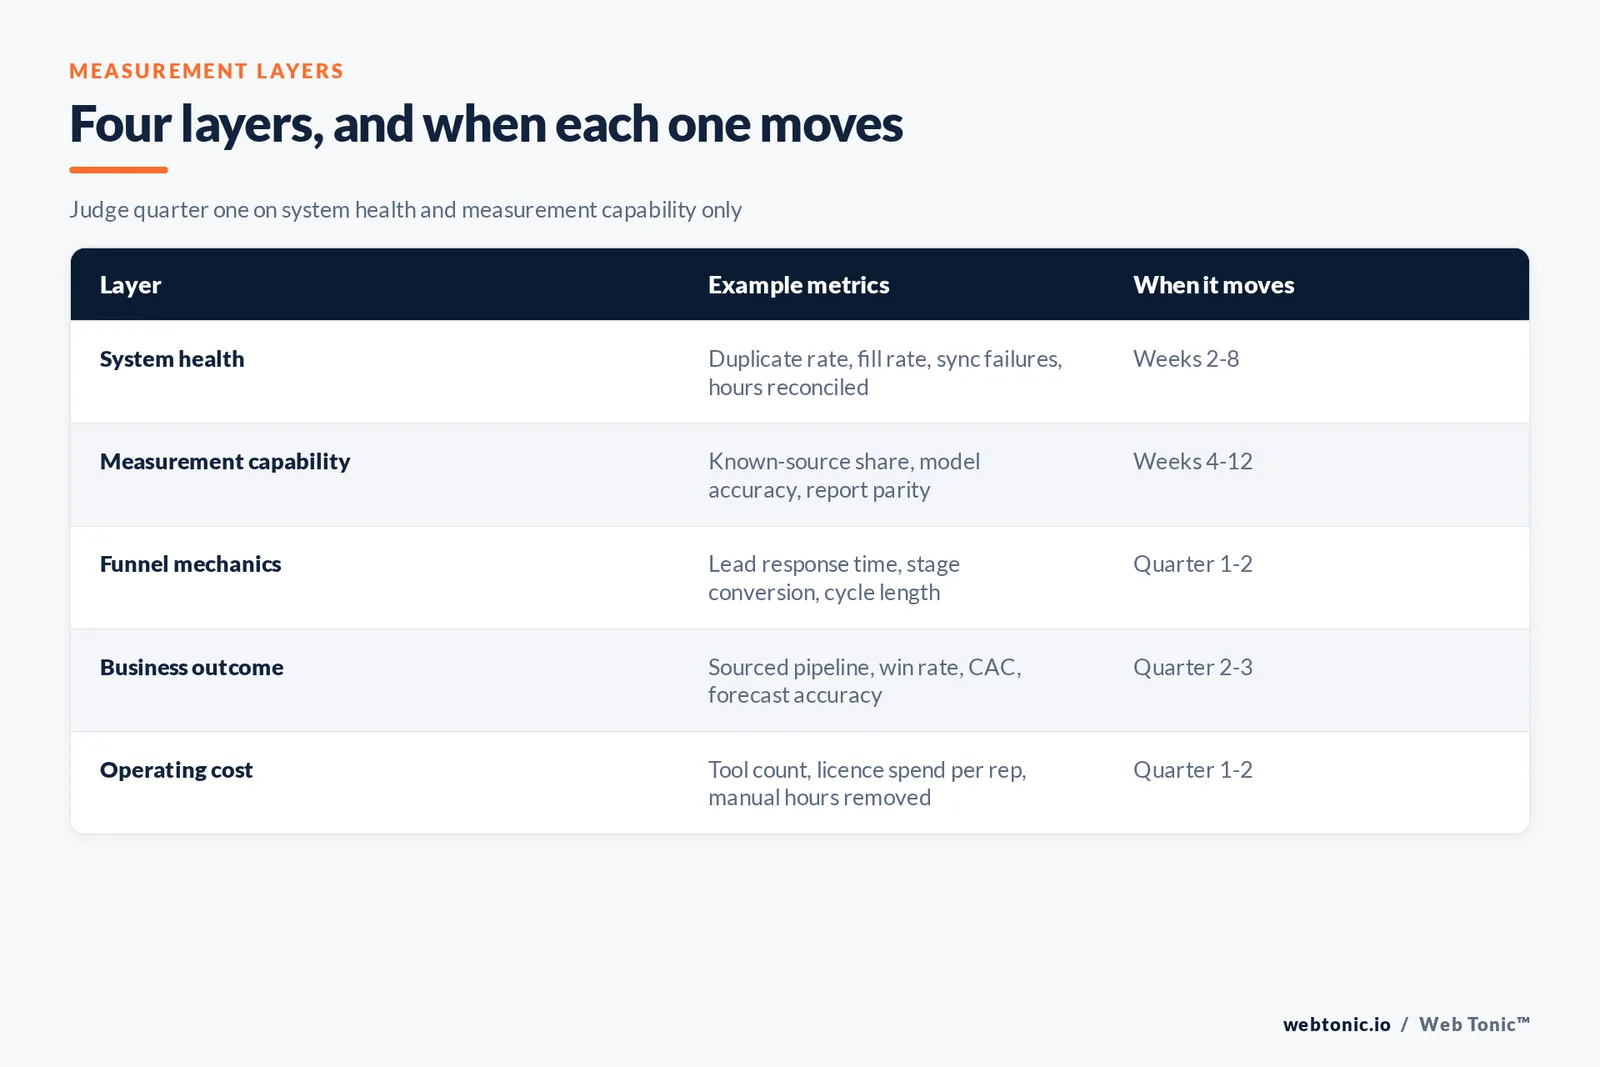
| Layer | Example metrics | When it moves |
|---|---|---|
| System health | Duplicate rate, required-field fill rate, sync failures, hours spent reconciling | Weeks 2–8 |
| Measurement capability | Share of pipeline with a known source, attribution model accuracy, report parity | Weeks 4–12 |
| Funnel mechanics | Lead response time, stage conversion, cycle length, pipeline coverage | Quarter 1–2 |
| Business outcome | Sourced pipeline, win rate, CAC, forecast accuracy | Quarter 2–3 |
| Operating cost | Tool count, licence spend per rep, manual hours removed | Quarter 1–2 |
| Resilience | Named owners, documentation coverage, time to fix a broken workflow | Quarter 2 onward |
Layer one: system health
These are the cheapest metrics to collect and the most predictive. Duplicate rate on contacts and accounts. Fill rate on the fields your reporting depends on. Number of failed integration syncs per week. Records created without an owner. And the human one: hours per week your team spends fixing and reconciling data instead of running marketing.
That last number is bigger than most leaders assume. Validity's 2026 survey of 500 marketing professionals found nearly a third of teams spending 6+ hours a week on data repair, 62% of organisations losing revenue directly to poor CRM data, 67% reporting delayed or scrapped campaigns and 63% citing compliance exposure. Only 41% have a dedicated governance owner, and just 21% say their CRM data is very well prepared for AI.
Two derived metrics are worth adding. First, the monitoring coverage rate: what share of your critical data rules are checked automatically rather than by someone noticing. Continuous automated monitoring is what marketers say would most raise their confidence, cited by 39% overall and 47% of C-suite respondents, ahead of platform consolidation at 23%. Second, the AI exposure rate: how many decisions are delegated to automated systems reading those records, since two in three organisations increased that delegation in the past year.
Layer two: measurement capability
You can measure how well you can measure, and you should, because everything downstream inherits it. Three metrics do the job. Share of closed-won revenue with a known, defensible source. Report parity: how often CRM, marketing automation and finance produce the same number for the same question. And model accuracy, judged against published benchmarks rather than internal comfort.
The benchmarks are unflattering. 2026 attribution accuracy research puts first-touch at 42–58%, last-touch at 38–52%, data-driven multi-touch at 65–82%, self-reported attribution at 72–88% and a hybrid stack at 82–92%, with 30–50% of pipeline originating in dark-funnel sources that click models cannot see. Adoption is still catching up: a 2026 attribution statistics reference reports multi-touch adoption at 47%, marketing mix modelling at 26%, and an average dark-funnel gap of 38% of B2B pipeline.
Source coverage is the most actionable of the three because it improves with plumbing rather than philosophy. A practitioner audit of post-Series-B pipelines found 45–70% of pipeline in unhelpful buckets like direct, 20–30% with partial UTMs and 10–15% with none. Add a self-reported field, fix UTM governance, and that share moves within one quarter. Set the target explicitly — for example, unknown-source pipeline below 20% by day 90 — and report it monthly.
Layer three: funnel mechanics
Now the metrics that connect the system to money. Lead response time, measured in minutes from conversion to first human contact. Stage-to-stage conversion, with the definitions frozen so month three is comparable to month one. Sales cycle length. Pipeline coverage against target. And leakage: records that enter a stage and neither advance nor close.
Pipeline velocity is the best single summary, and it is named the top RevOps metric for 2026 in a report drawn from 1,200-plus B2B companies — pipeline generated per dollar of sales and marketing spend. Its virtue is that it is unfakeable without a working system: you need clean spend, clean pipeline and consistent stages to compute it at all.
Signal loss should be tracked alongside, not ignored. 2026 attribution benchmarks describe roughly 38% of available data becoming unusable as third-party cookie deprecation progressed, with first-party cookies under a seven-day window losing about 22% of conversions. Some of your quarter-over-quarter movement is measurement environment, not performance, and an operations function that cannot separate the two is not finished.
Layer four: business outcome, on the right clock
Sourced and influenced pipeline, win rate, cost per acquisition, forecast accuracy and revenue growth. All real, all lagging. The published deltas for mature RevOps functions in the same 1,200-company report — 19% faster year-over-year revenue growth, 15% higher win rates, 12% shorter sales cycles, 23% higher forecast accuracy, 28% lower customer acquisition cost and 31% better data quality scores — describe steady-state maturity, not the first ninety days.
Read them as a direction of travel and hold two disciplines. First, restate the baseline after the audit. If the diagnostic proves the old numbers were wrong, measuring improvement against them is theatre. Second, keep the definitions frozen for at least two quarters; a redefinition mid-series destroys comparability more thoroughly than a bad quarter does.
Cost belongs in this layer too, and it is the fastest win to bank. With 67% of RevOps leaders planning to cut tool count, average stacks at 12 tools against 7–8 for top performers, and mid-market tool spend near $2,400 per rep per month, licence rationalisation and removed manual hours are legitimate, auditable returns. Report them separately from revenue effects so nobody has to take the revenue claim on faith.
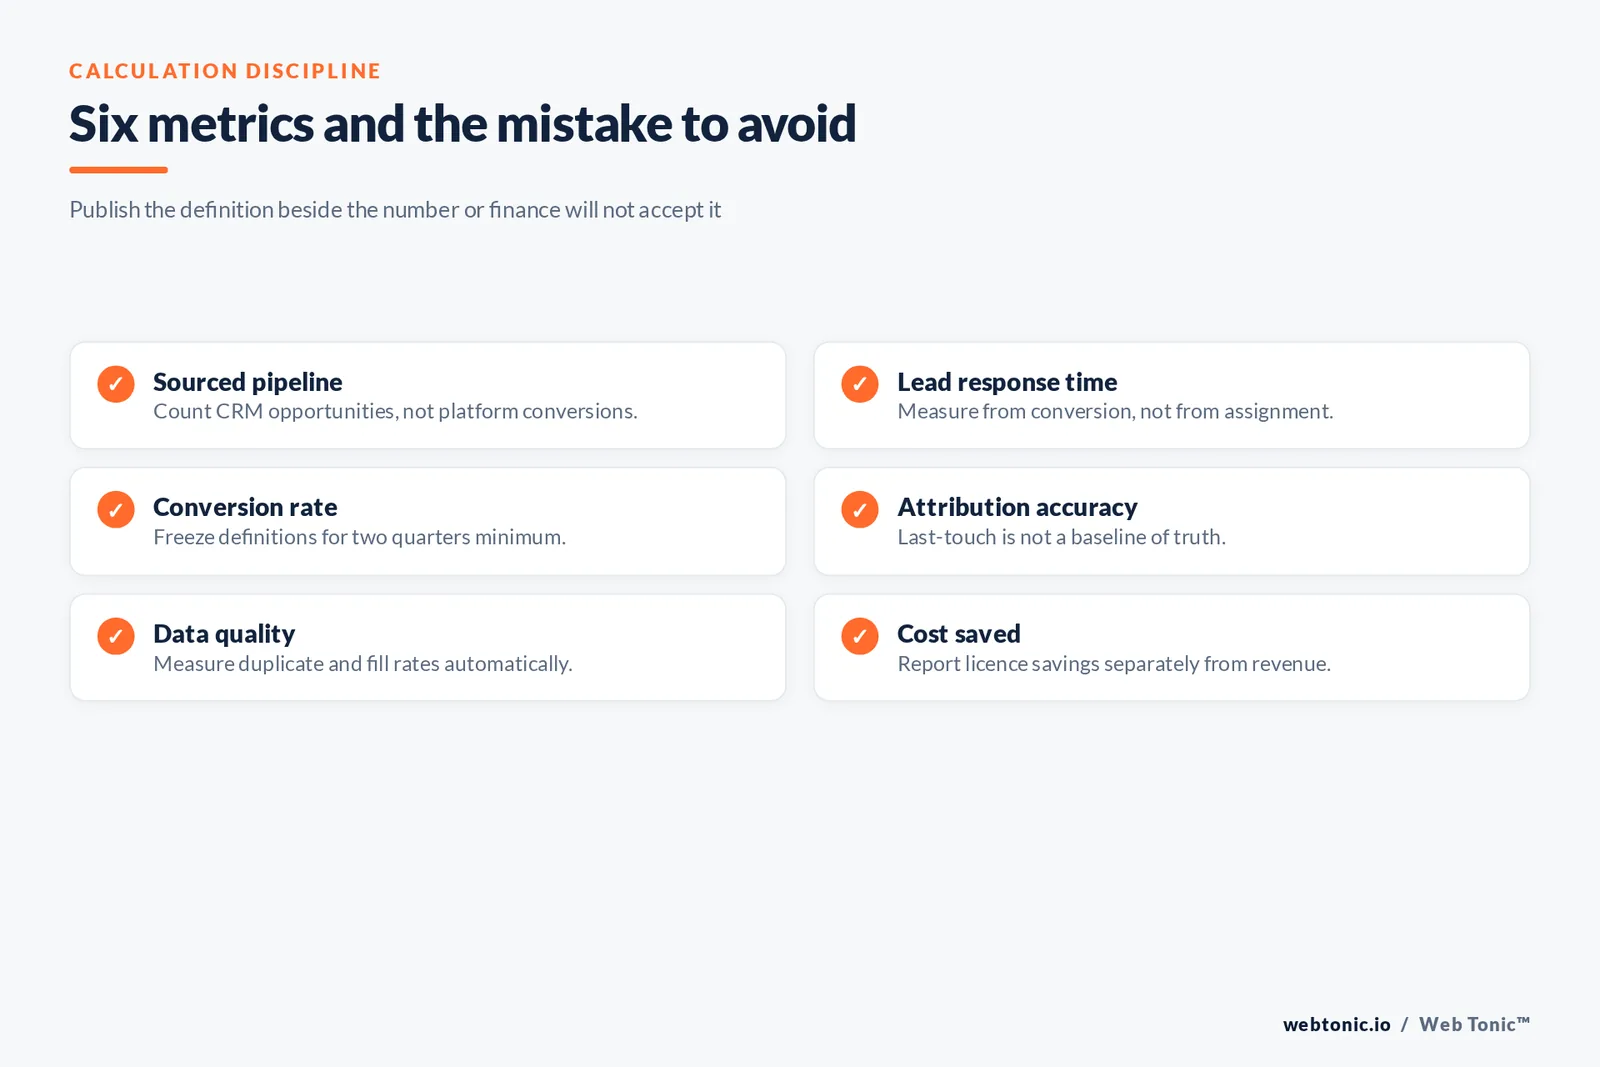
| Metric | Common miscalculation | Do this instead |
|---|---|---|
| Sourced pipeline | Counting platform-reported conversions | Count from CRM opportunities with a defensible source |
| Lead response time | Measuring from assignment, not conversion | Timestamp at form submit and first human touch |
| Conversion rate | Definitions changed mid-quarter | Freeze definitions for two quarters minimum |
| Attribution accuracy | Assuming last-touch is a baseline of truth | Benchmark against published model accuracy ranges |
| Data quality | Self-assessed as "good enough" | Measure duplicate and fill rates automatically |
| Cost saved | Blending licence savings into revenue claims | Report cost and revenue effects separately |
Efficiency metrics: workflows, campaigns and execution
There is a fifth family of metrics that rarely reaches the board pack and should: operating efficiency. Count the workflows running in your automation platform and how many are documented. Count campaign execution time — hours from brief to live for a standard email or paid launch. Count QA defects caught after launch. Count the manual steps removed by automation this quarter. These are the numbers that tell you whether the technology is building capacity or debt.
They are also the easiest to improve visibly. A team that cuts campaign build time from three days to one has bought itself extra cycles every month, and that shows up later in volume and testing velocity rather than in a data quality chart. Where a business runs a high campaign cadence, execution efficiency is frequently the highest-value part of an operations engagement, even though the pitch was about reporting.
Keep a governance metric alongside them: the share of workflows with a named owner and a written purpose. Undocumented automation is the most common form of hidden risk in a mature stack — it works until a field changes, and then nobody knows what broke or why it existed. Reporting that share monthly turns cleanup from an occasional heroic project into ordinary maintenance.
The one-page report that survives a board meeting
Six blocks, one page, same layout every month. Spend by channel from a single source. Pipeline created and pipeline coverage. Share of pipeline with a known source, trending. Stage conversion and cycle length against the frozen baseline. System health: duplicate rate, fill rate, sync failures, hours reconciled. And a short list of decisions taken with the reasons, so the report reads as a narrative rather than a wall of tiles.
Two rules keep it honest. Anything that cannot be reproduced by your own team from the source systems does not go on the page. And every number carries its definition in a footnote — because the fastest way to lose credibility with finance is to present a figure whose derivation nobody can explain. That is the standard we hold in marketing operations consulting, and the reporting layer itself is built through data intelligence.
Where the numbers are still weak, say so on the page. A line that reads "unknown-source pipeline down from 58% to 24%, target 15% by Q4" is more persuasive than a confident attribution chart, and it makes the next quarter's ask self-evident. The teams that report gaps openly are the ones that get budget to close them.
Judging whether the engagement was worth it
Ask four questions at the end of each quarter. Can we answer what we spent, what it produced, what closed and how long it took — from one place, without a manual export? Has the share of pipeline we can explain gone up? Has anything measurable got faster or cheaper? And could our own team run this if the provider stopped tomorrow?
Three yeses and a no on the last one means you bought a system without an owner, which the staffing benchmarks predict will decay: 1 ops person per 25–30 revenue team members is the calibration point, with top performers at 1:15–20 and under-invested teams at 1:40 reporting worse data quality and more leakage. Four yeses means the engagement did its job and the next one can be about growth rather than repair.
If you are still choosing a provider, make measurement part of the contract rather than the retrospective: baseline metrics defined in week one, targets by layer, and a monthly report format agreed before work starts. The 2026 buyer's guide to revenue operations services puts it plainly — demand published pricing and a statement of work with exit criteria before signing anything. More on the operating side of growth sits across the blog, and if you want a read on which layer is your constraint, start there.

Related reading
- Marketing Operations Consulting / RevOps — How to Report It to a Board
- Marketing Strategy Consulting: how to measure it
- Marketing Operations Consulting / RevOps: what it costs in 2026
- Marketing Strategy Consulting services at Web Tonic
Frequently Asked Questions
What is the single best metric for marketing operations?
Pipeline velocity — pipeline generated per dollar of sales and marketing spend — because it cannot be computed without clean spend data, consistent stages and defensible sourcing. Pair it with one system-health metric so a good velocity number cannot hide a decaying data model.
How soon should we expect movement?
System health in weeks two to eight, measurement capability in weeks four to twelve, funnel mechanics within one to two quarters, and business outcomes in quarters two and three. Judging the engagement on revenue at day 60 will produce the wrong verdict in both directions.
Is lead volume ever a valid measure here?
Only alongside quality and definitions. Deduplication and stricter qualification usually reduce recorded volume while improving conversion, so volume read alone will punish exactly the work you paid for. Look at qualified volume against the frozen definition instead.
How do we prove attribution improved?
Report the share of pipeline with a known, defensible source over time, and benchmark your model against published accuracy ranges — 38–58% for single-model, 82–92% for a hybrid stack. Moving unknown-source pipeline from over half to under a quarter is a concrete, defensible result.
Should tool savings count as ROI?
Yes, reported separately. Licence rationalisation and removed manual hours are auditable in a way that revenue attribution rarely is, and with average stacks at 12 tools against 7–8 for top performers, the savings are often material. Never blend them into a single ROI figure with revenue effects.
Sources
SyncGTM (2026 RevOps Report, 1,200+ companies), Validity via PR Newswire (State of CRM Data Management in 2026, 500 respondents), GrowthSpree (B2B SaaS attribution model accuracy benchmarks 2026), Digital Applied (Marketing Attribution Statistics 2026), EOI Digital (attribution audit findings 2026), Attrifast (2026 attribution benchmark report), HubSpot (RevOps vs Sales Ops, Deloitte Digital data), Fullcast (RevOps growth analysis), Prospeo (Revenue Operations Services: 2026 Buyer's Guide). Accessed September 2026.


