



Table of contents
62% of Americans use social media to research financial or insurance products, but the platforms they use split sharply by generation, and organic engagement rates for the category are genuinely low - 0.13% per post on Rival IQ's live Financial Services benchmark. This page uses LIMRA's 2026 Insurance Barometer research and Rival IQ's live industry data to show which platform to prioritize for which audience, and what a realistic engagement target looks like instead of comparing insurance content to a retail brand's numbers.
Key Takeaways
- 62% of Americans use social media when researching financial or insurance products.
- 66% of those social users turn to YouTube specifically for financial education.
- 56% use Facebook, 48% use Instagram and 40% use TikTok for the same purpose.
- 58% of Gen Z consumers use Instagram for financial information.
- 57% of Gen Z consumers use TikTok for the same purpose.
- 65% of baby boomers use Facebook for financial information, the highest of any generation-platform pair measured.
- Rival IQ's live Financial Services benchmark shows a 0.13% engagement rate per post.
- That works out to 276.2 engagements per post at 9.7 posts per week per company.
- 71% of consumers either have or are looking for a financial professional.
- 46% of social-media financial researchers still value staying in touch with a professional.
- 53% prefer speaking with a financial professional directly over self-service.
- Finance & Insurance Facebook ad CTR sits at just 0.98%, among the lowest of any industry.
Social media is a research habit before it is a sales channel
LIMRA's 2026 Facts About Life Insurance research found 62% of Americans use social media when seeking information on financial or insurance products. Among those users, YouTube leads at 66%, ahead of Facebook (56%), Instagram (48%) and TikTok (40%). That ordering matters for content planning: long-form explainer video on YouTube reaches the largest share of financially-curious social users of any single platform, ahead of the short-form feeds most social calendars default to first.
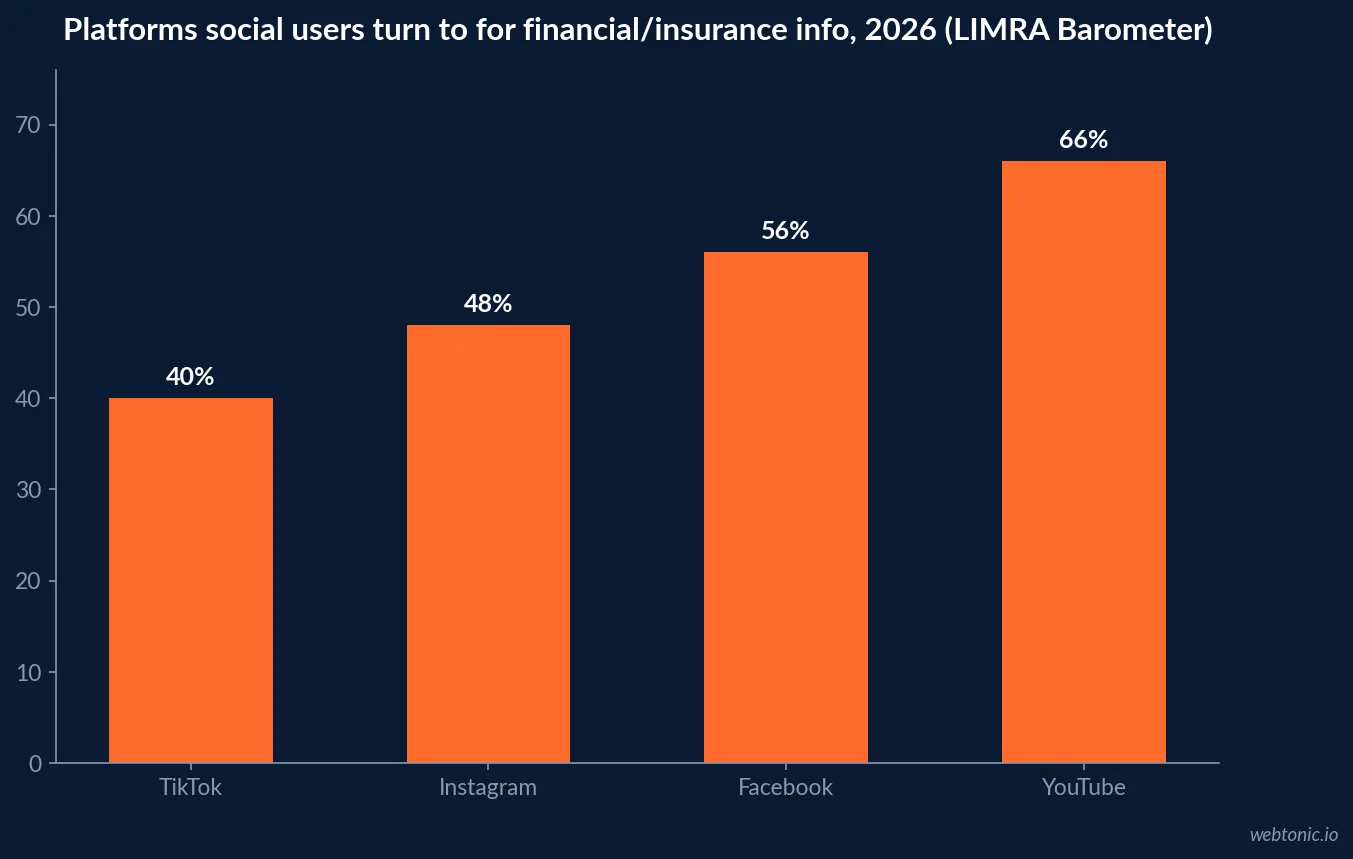
| Platform used for financial/insurance info (2026) | Share of social users | Source |
|---|---|---|
| YouTube | 66% | LIMRA |
| 56% | LIMRA | |
| 48% | LIMRA | |
| TikTok | 40% | LIMRA |
Who TikTok actually reaches in insurance, honestly
TikTok is a thin combo for most insurance lines, and the honest framing matters more than a forced strategy. LIMRA's data puts TikTok at 40% of social users researching financial products overall - the lowest of the four platforms measured - but at 57% among Gen Z specifically. That gap says TikTok earns a place in an insurance social plan only where the buyer is genuinely young: first-time renters' or auto policyholders, not commercial or high-net-worth lines, where the platform's own audience skews far older and the reach simply is not there.
The generational split is sharper than the overall numbers show
The all-users figures above hide a real divide. LIMRA's research found 58% of Gen Z consumers use Instagram and 57% use TikTok for financial information, while 65% of baby boomers use Facebook for the same purpose - the single highest generation-platform pairing in the data. A carrier or agency running one platform for every audience is, in practice, choosing which generation to under-serve; the split argues for running at least two platforms in parallel rather than picking a single "best" one.
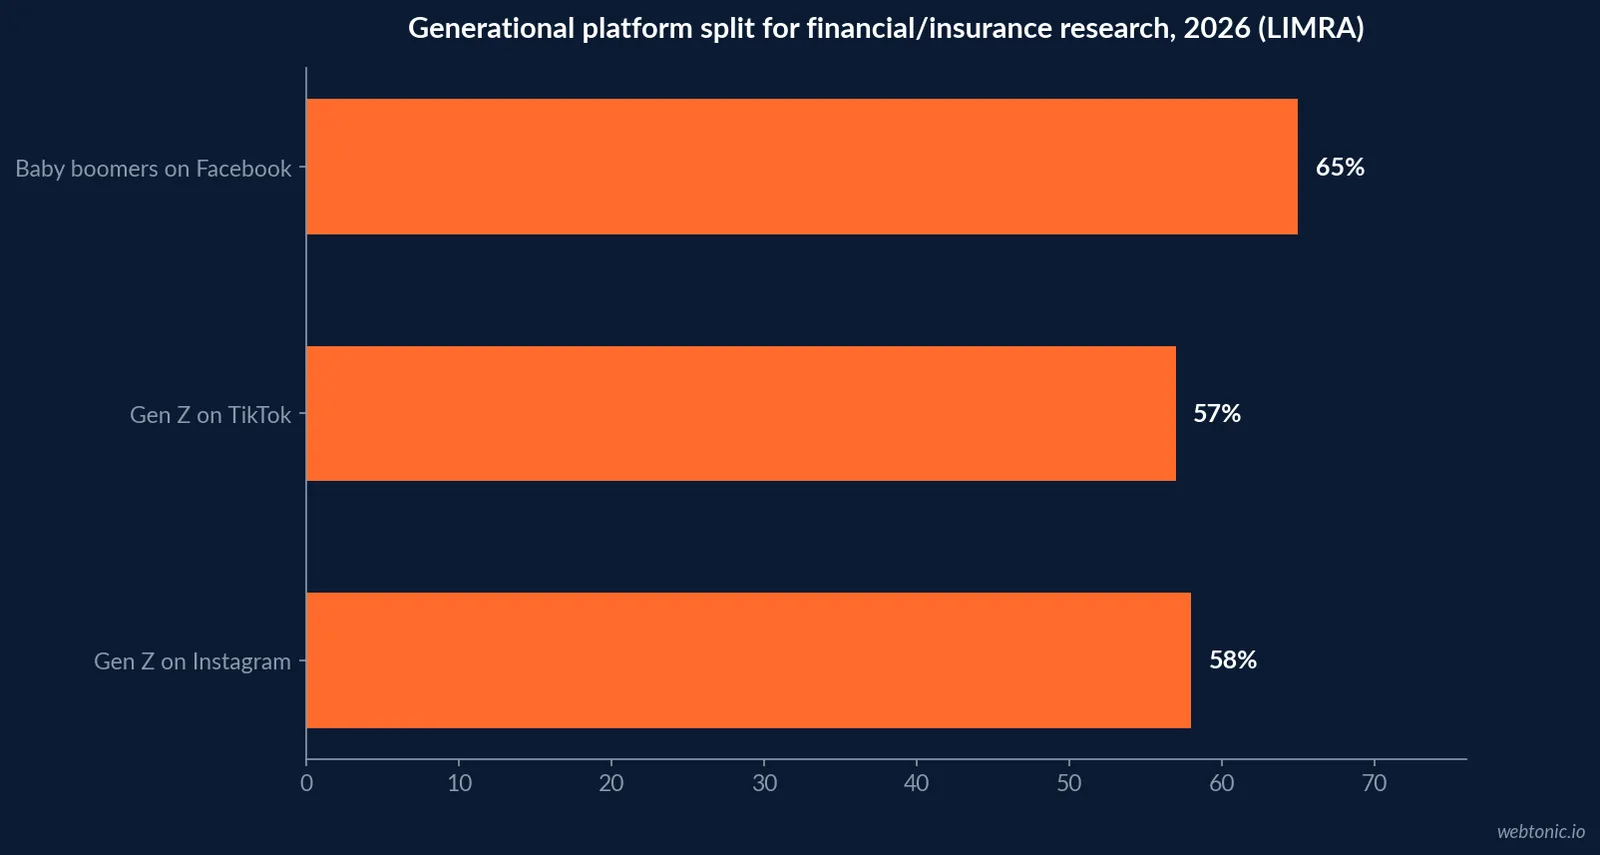
| Generation | Leading platform for financial/insurance info | Share |
|---|---|---|
| Gen Z | 58% | |
| Gen Z | TikTok | 57% |
| Baby boomers | 65% | |
| All social users (blended) | YouTube | 66% |
What a realistic engagement rate looks like
Rival IQ's live Financial Services industry benchmark, part of its ongoing Social Media Industry Benchmark Report, measured 276.2 engagements per post at 9.7 posts per week per company in its trailing 30-day sample - working out to a 0.13% engagement rate per post. Insurance and financial services content earns attention through trust and repetition, not virality; a monthly benchmark review against this category-specific figure is more useful than comparing insurance posts to a retail or entertainment brand's engagement rate, which will always look worse by comparison for reasons that have nothing to do with content quality.
| Rival IQ live Financial Services benchmark (trailing 30 days) | Value |
|---|---|
| Posts per company per week | 9.7 |
| Engagements per post | 276.2 |
| Engagement rate per post | 0.13% |
The gender split is as wide as the generational one
LIMRA's 2026 Insurance Barometer presentation, delivered at the 2026 Life and Annuity Conference, found 69% of men use social media when seeking information on financial or insurance products, against 56% of women - a 13-point gap on top of the generational split already documented above. The same research flagged USD 200,000+ households as a segment that specifically turns to social media for this research, which argues against writing off social as a mass-market-only channel for higher-premium life and annuity products.
| Audience segment | Social media use for financial/insurance research |
|---|---|
| Men (all ages) | 69% |
| Women (all ages) | 56% |
| USD 200,000+ household income | Notably above-average use, per LIMRA |
Paid social carries the same targeting constraints as the platform's ad rules
Organic reach is only half the picture; boosting insurance content into paid distribution triggers Meta's Financial Products and Services Special Ad Category, mandatory for US advertisers since January 21, 2025, which removes age, gender, ZIP and lookalike targeting. That constraint is also why Finance & Insurance Facebook ad click-through rate sits at just 0.98%, among the lowest of any industry WordStream's 2025 benchmark report tracks - broad, forced targeting reaching people outside genuine buying intent. Organic content that earns its own reach without paid boosting is not just cheaper; it sidesteps that targeting ceiling entirely.
| Distribution method | Targeting constraint | What it means for insurance content |
|---|---|---|
| Organic post | None - full reach to existing followers | Best for trust-building, long-form explainers |
| Boosted/paid post | Special Ad Category applies | No age/ZIP/lookalike targeting; broad reach only |
| Influencer/partner content | Disclosure rules apply (FTC) | Must clearly mark sponsored insurance content |
Social still hands off to a human, most of the time
LIMRA's research is explicit that digital research does not replace the close: 71% of consumers either have or are looking for a financial professional to help with their finances, and among people who use social media for financial research, 46% say staying in touch with a financial professional still matters to them. Separately, 53% of consumers overall prefer speaking with a financial professional by phone, video or in person. A social program that ends every post in a self-serve link is optimizing against a preference most of the audience does not hold; ending in a scheduled conversation converts better against this data.
| Consumer preference (LIMRA 2026) | Share | Social program implication |
|---|---|---|
| Have or want a financial professional | 71% | CTA should offer a conversation, not just a form |
| Value staying in touch with a professional (social users) | 46% | Retarget engaged followers with a human touch |
| Prefer speaking with a professional directly | 53% | Comment/DM response speed matters as much as post volume |
How often to post, based on what the data actually supports
Rival IQ's live Financial Services benchmark shows the category posting at 9.7 times per week per company on average - roughly daily to every other day. That cadence, paired with the generational platform split above, argues for concentrating posting frequency on the one or two platforms that match an agency's actual policyholder base rather than spreading the same 9.7-post weekly budget evenly across four platforms with very different audience fit.
| Platform | Best-fit audience (this data) | Cadence guidance |
|---|---|---|
| YouTube | All ages; 66% of social researchers use it | 1-2 long-form uploads/week |
| Baby boomers (65%); existing policyholders | 3-5 posts/week, renewal-adjacent content | |
| Gen Z (58%); first-policy buyers | 3-5 posts/week, short-form education | |
| TikTok | Gen Z specifically (57%); not older segments | 2-3 posts/week, only if the buyer is young |
Building a social calendar around the actual data
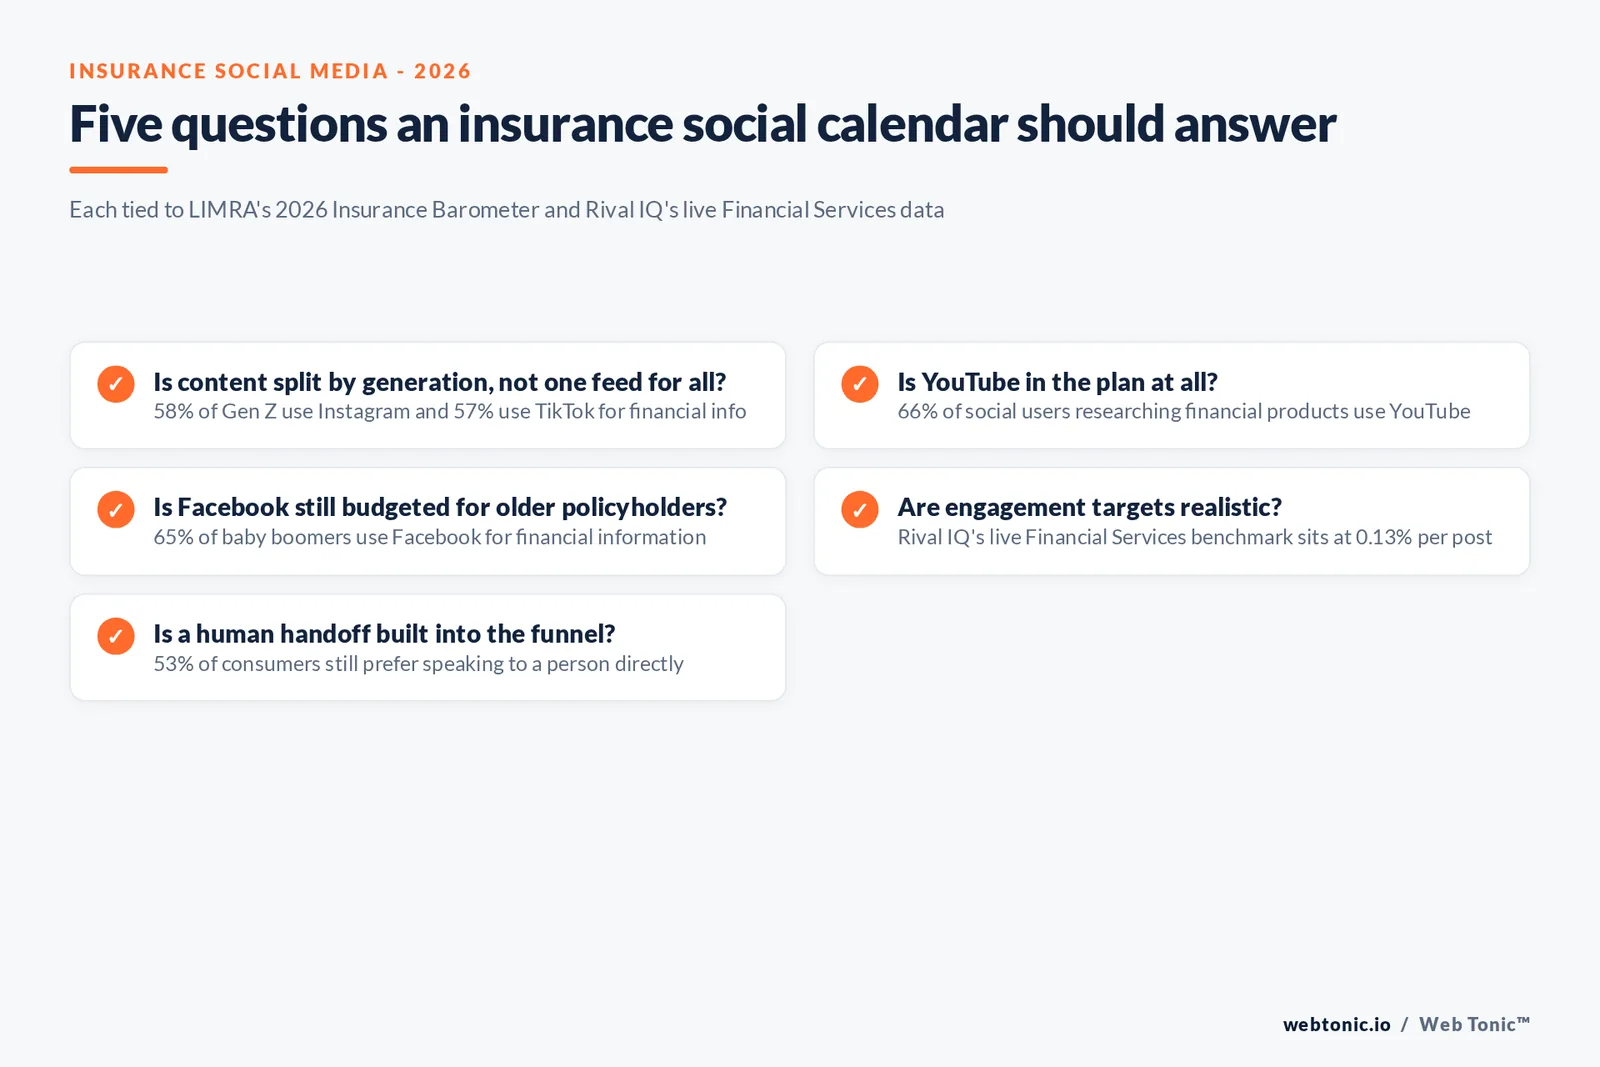
Scale still matters here too: the Insurance Information Institute's 2024 data shows the top 10 P/C writers controlling roughly half the US market, which funds the content-production volume a national brand can sustain across five platforms at once. A single-location agency competes better by picking two platforms well than by spreading thin across all of them. The honest plan is platform-by-generation, not one-size-fits-all: YouTube explainer content for the broadest reach, Instagram and TikTok for Gen Z-focused product education, Facebook for the still-substantial boomer audience, and every paid boost planned around the Special Ad Category's targeting ceiling rather than fighting it. Our growth marketing team builds that platform mix from a carrier or agency's actual policyholder demographics rather than a generic social calendar. For the paid-media side of this same audience, see our breakdown of whether Facebook ads are worth it, or talk to us about a social program built on 2026 generational data.
| Social priority | Data it answers to | What good looks like |
|---|---|---|
| YouTube explainer content | 66% of social users turn here for financial info | Coverage-type explainers, claims walkthroughs |
| Instagram + TikTok for younger segments | 58% Gen Z on Instagram, 57% on TikTok | Short-form product basics, first-policy content |
| Facebook for older policyholders | 65% of baby boomers use it for financial info | Renewal reminders, community-style trust content |
| Human handoff in every CTA | 71% want a professional, 53% prefer direct contact | Schedule-a-call link alongside any self-serve form |
Frequently Asked Questions
Do people actually use social media to research insurance?
Yes, broadly. LIMRA's 2026 consumer research found 62% of Americans use social media when seeking information on financial or insurance products, and among those users, 66% turn to YouTube specifically for financial education - the single most-used platform for that purpose across generations.
Which platform should an insurance brand actually prioritize?
It depends on the audience. LIMRA's 2026 data shows 58% of Gen Z consumers use Instagram and 57% use TikTok for financial information, while 65% of baby boomers use Facebook for the same purpose. A single-platform insurance social strategy is choosing which generation to under-serve; most carriers and agencies need at least two platforms running in parallel.
What engagement rate should an insurance social account expect?
Low, and that is normal for the category. Rival IQ's live Financial Services industry benchmark, drawn from its ongoing Social Media Industry Benchmark Report, measured a 0.13% engagement rate per post and 276.2 engagements per post at 9.7 posts per week per company in the trailing 30 days sampled. Insurance is a low-frequency, high-trust purchase; comparing its engagement rate to retail or entertainment brands sets the wrong bar.
Does social media replace the agent relationship in insurance?
No, and LIMRA's own data says so directly: 71% of consumers either have or are looking for a financial professional to help them with their finances, and 46% of people who use social media for financial purposes say staying in touch with a financial professional is still important to them. Social builds awareness and trust; it rarely replaces the close.
What compliance rules apply to insurance content on social media?
The same state-level rules that apply to any insurance advertisement. The NAIC's Unfair Trade Practices Act (Model #880) defines misrepresentation and false advertising of insurance policies as a violation regardless of medium, and Meta's own ad standards additionally require the Financial Products and Services Special Ad Category for any paid insurance promotion, which limits targeting even on organic-adjacent boosted posts.
Sources
LIMRA - 2026 Facts About Life Insurance
LIMRA - 2026 Insurance Barometer Study presentation, Life and Annuity Conference
Insurance Information Institute - Facts + Statistics: Industry Overview
Rival IQ - Live Social Media Benchmarks for Financial Services
WordStream - Facebook Ads Benchmarks 2025
Meta Transparency Center - Financial and Insurance Products and Services policy
NAIC - Unfair Trade Practices Act, Model #880


