



Table of contents

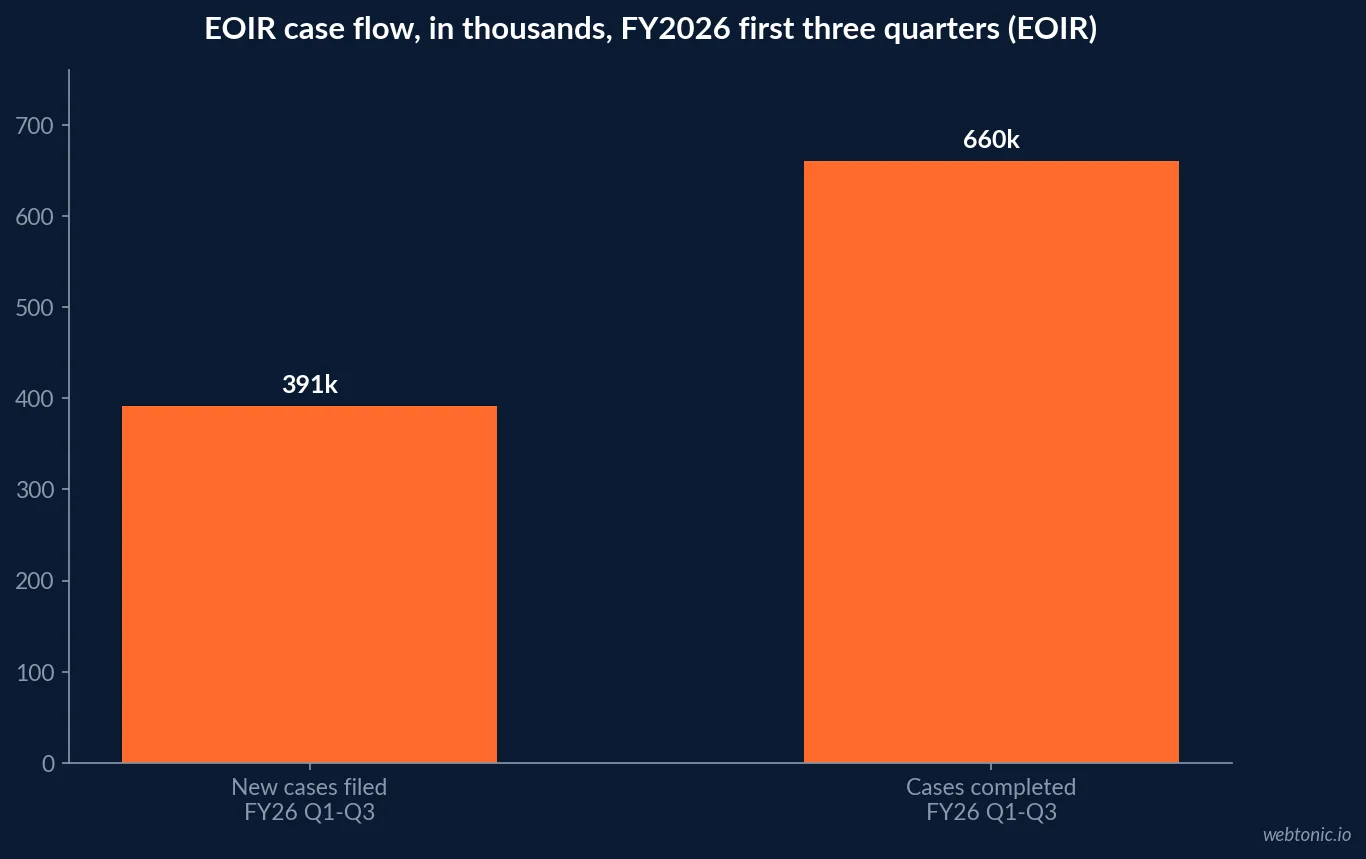
EOIR reports 798,808 immigration court case completions in FY2025 and 660,343 more through the first three quarters of FY2026, against 391,145 new cases filed in that same window. That is the backdrop every immigration law tracking and analytics stack is actually built against: a national backlog that is shrinking on paper while individual firms still need to know, case by case, whether their own pipeline is keeping pace.
Key Takeaways
- EOIR completed 798,808 cases in FY2025, its highest annual total on record.
- 660,343 cases were completed in FY2026's first three quarters, against 391,145 new filings.
- EOIR has completed more than 1.08 million cases since January 20, 2025.
- The pending caseload fell by more than 447,000 cases in that same span.
- National pending caseload moved from roughly 4.18 million to under 3.53 million.
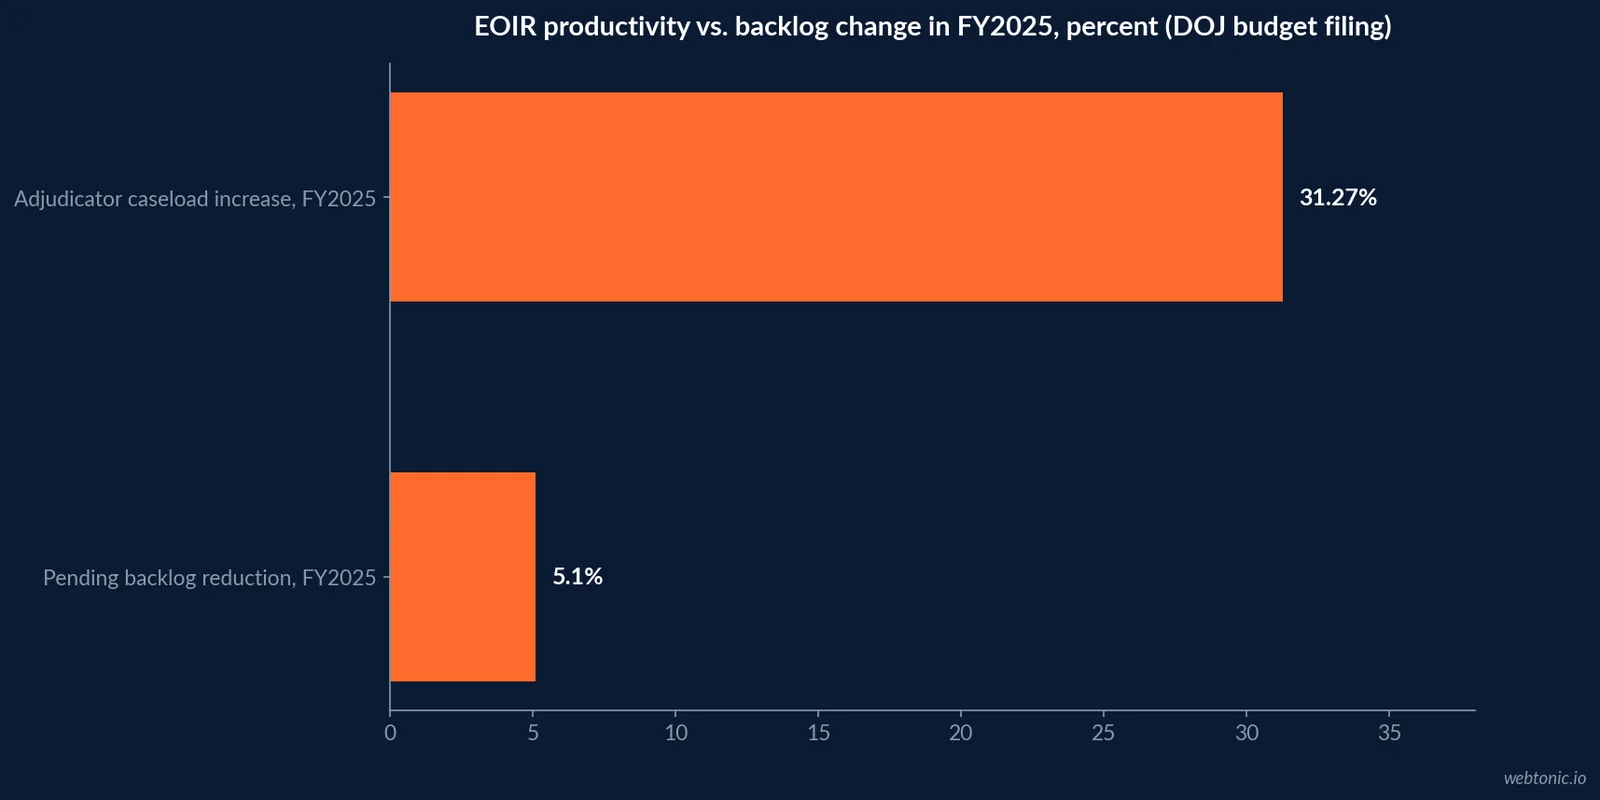
- The FY2025 backlog reduction was 5.1%, the first pending-case decrease since FY2006.
- Adjudicators handled 31.27% more cases per judge in FY2025 than the prior year.
- Clio surveyed 1,702 US legal professionals for its 2026 Legal Trends Report.
- Firms above the 33% utilization benchmark spend 12% more on software.
- Those same firms spend 41% more on marketing than average-utilization firms.
- They are also 21% more profitable on the same Clio dataset.
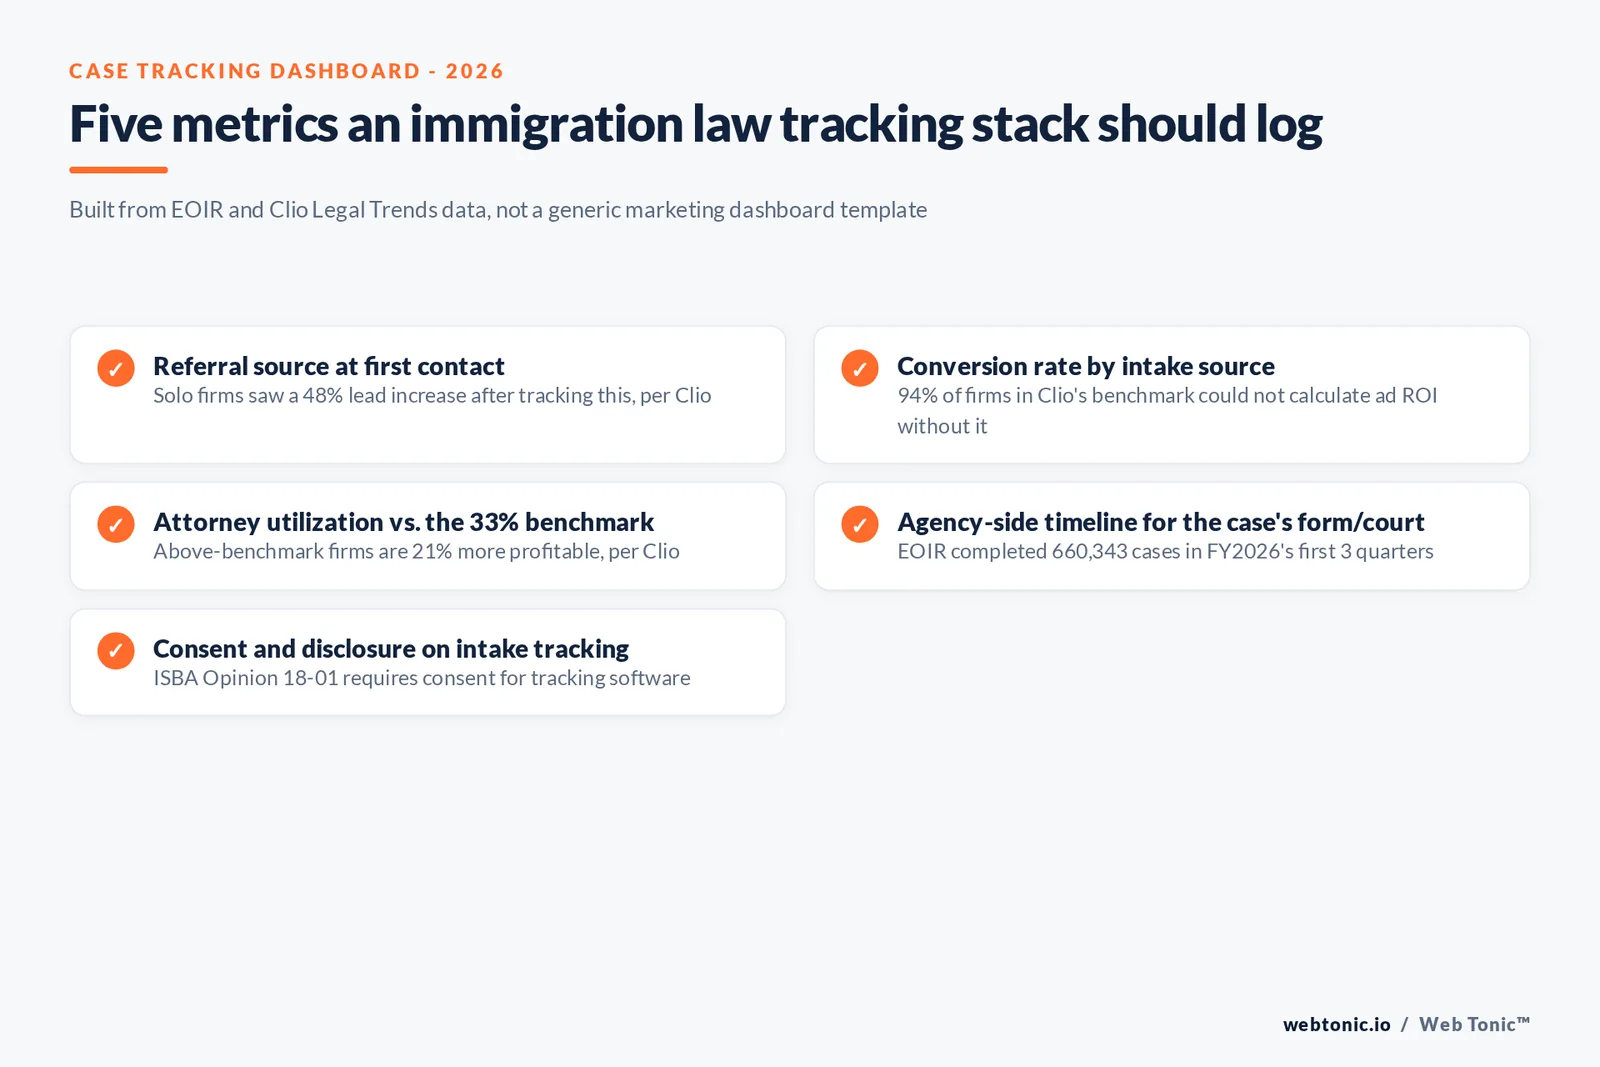
- Solo firms saw a 48% increase in client leads after adopting digital intake tools, per Clio.
- E-signatures lifted conversion rates by 10% in the same Clio research.
- Text messaging lifted conversion by 7%, and online payments by up to 5%.
- 94% of firms in Clio's earlier benchmark could not calculate advertising ROI without dedicated tracking.
- The Illinois State Bar's Opinion 18-01 directly addresses undisclosed tracking software in lawyer communications.
- USCIS publishes median processing times by form through its own case-tracking tool.
- DHS's Yearbook of Immigration Statistics is the primary annual source for LPR, naturalization and enforcement counts.
The backlog a tracking stack has to work against
Every metric an immigration law firm logs internally sits on top of a much larger, agency-level clock. The Executive Office for Immigration Review's own adjudication statistics report 798,808 total case completions in FY2025 and 660,343 more through the third quarter of FY2026, against 391,145 new cases received in that same nine-month window - completions running well ahead of new filings, which is the arithmetic behind a shrinking backlog.
A separate EOIR announcement puts the multi-quarter trend in plainer terms: more than 1.08 million cases completed since January 20, 2025, and a pending caseload cut by more than 447,000 cases in the same period. A firm's own dashboard means little without that context, because a case that looks "stalled" against a firm's internal SLA may simply be sitting inside a docket that is moving faster, or slower, than the national average.
| FY2026 metric (Q1-Q3) | Figure | Comparable FY2025 figure | Source |
|---|---|---|---|
| New cases received | 391,145 | 562,375 (full year) | EOIR adjudication statistics |
| Total case completions | 660,343 | 798,808 (full year) | EOIR adjudication statistics |
| Net pending caseload change | -73,371 | -66,567 | EOIR adjudication statistics |
| Cumulative completions since Jan 20, 2025 | >1.08 million | n/a (start point) | EOIR milestone announcement |
| National pending caseload | Under 3.53 million | Under 3.75 million (Sept 2025 snapshot) | EOIR milestone announcements |
What "faster" actually cost the agency
The Department of Justice's own budget justification frames the FY2025 backlog reduction as a staffing and workload story, not just a policy one: pending cases fell 5.1% by the end of FY2025, described as the first pending-case decrease in EOIR's recent history since FY2006, and adjudicators absorbed an average of 31.27% more cases per adjudicator in the same fiscal year. That is the productivity side of the ledger a law firm's own case-tracking dashboard rarely captures, but it explains why hearing dates and decision timelines have been moving for pending clients regardless of what a firm's CRM says.
The client-facing half of the clock: USCIS processing times
Court backlog data covers only cases already in front of an immigration judge. Most of an immigration practice's caseload - green cards, work permits, naturalization, family petitions - moves through USCIS's own processing-times reporting, published by form type and service center and updated on a rolling basis. A tracking stack that logs only a firm's internal intake-to-filing timeline and never pulls in the agency-side median for the specific form and office a client's case sits in will consistently mis-set expectations, in either direction.
Annual volume context comes from a second primary source: DHS's Office of Homeland Security Statistics publishes the Yearbook of Immigration Statistics, the government's own annual accounting of lawful permanent resident admissions, naturalizations, refugee and asylum grants, and enforcement actions - the dataset firms cite when a client asks how their case category compares nationally.
| Data source | What it actually measures | Update cadence | Where a firm would use it |
|---|---|---|---|
| EOIR adjudication statistics | Immigration court new filings, completions, pending caseload | Quarterly | Setting realistic hearing-wait expectations |
| USCIS case processing times tool | Median processing time by form and office | Rolling / quarterly | Green card, work permit and naturalization timelines |
| DHS Yearbook of Immigration Statistics | Annual LPR, naturalization, asylum and enforcement counts | Annual | Benchmarking a practice area's national volume |
| Clio Legal Trends Report | Firm-level intake, utilization and marketing spend data | Annual | Internal pipeline and ROI benchmarking |
What firms actually track once a case is filed
Clio's 2026 Legal Trends Report for Solo and Small Law Firms surveyed 1,702 US legal professionals - a 500-respondent market panel plus 1,202 Clio customers - and its companion research on firm spending draws a straight line between operational tracking and profit. Firms running attorney utilization above the industry average of 33% (about three billable hours a day) spend 12% more on software and 41% more on marketing than average firms, and are 21% more profitable as a result. The causality likely runs both ways - firms that can afford to invest also tend to track more - but the correlation is the entire business case for building a real dashboard instead of a spreadsheet.
Clio's separate press research on digital adoption found solo firms saw a 48% increase in client leads after adding online intake tools, with conversion rates improving 10% with e-signatures, 7% with text messaging and up to 5% with online payments. None of those lifts show up in a generic Google Analytics dashboard; they only appear once a firm tracks its intake funnel stage by stage.
| Metric (Clio Legal Trends / firm-spending data) | Above-benchmark firms | Average firms | Gap |
|---|---|---|---|
| Attorney utilization rate | Above 33% (~3 billable hrs/day) | At or below 33% | Benchmark line |
| Software spend | +12% | Baseline | 12 points |
| Marketing spend | +41% | Baseline | 41 points |
| Firm profitability | +21% | Baseline | 21 points |
| Client lead volume (solo firms, post digital-intake) | +48% | Pre-adoption baseline | 48 points |
Where tracking hits a confidentiality wall
None of this data collection is unlimited. A law firm's website is not just a marketing asset - once it invites inquiries, several bar authorities treat the resulting conversation as capable of creating a prospective client-lawyer relationship, which carries an implied duty to keep what the visitor discloses confidential even before representation is confirmed. The Illinois State Bar's Ethics Opinion 18-01 goes further and addresses undisclosed tracking software embedded in lawyer communications directly, concluding informed consent is required before deploying it against another lawyer or a client. The American Bar Association's own Model Rule 7.1 commentary reinforces the baseline: every communication about a lawyer's services, including what a website or intake chatbot collects and how it is used, has to be accurate and not misleading about what happens to a visitor's information.
Practically, that means analytics on an immigration intake form should be scoped to the firm's own qualification and conversion tracking - not resold to third-party ad platforms as raw case detail, and disclosed plainly in whatever privacy notice sits above the submit button.
| Rule or opinion | Issuer | What it restricts | Tracking implication |
|---|---|---|---|
| Ethics Opinion 18-01 | Illinois State Bar Association | Undisclosed tracking software in lawyer communications | Consent-based tracking only, disclosed in writing |
| Model Rule 7.1 commentary | American Bar Association | Truthful, non-misleading communications about services | Intake-form copy must not overstate confidentiality or outcomes |
| Model Rule 1.6 (confidentiality) | American Bar Association | Protection of client and prospective-client information | No resale of intake data collected before representation begins |
| State bar advertising rules (varies by state) | State bar associations | Claims made in paid ads sourced from tracked data | Attribution data cannot justify an unverifiable performance claim |
Building a dashboard that respects both halves of the problem
The workable version of an immigration-law tracking stack has two layers that rarely sit in the same software: an external layer pulling agency-published timelines (EOIR, USCIS, DHS) so a firm can set client expectations against reality, and an internal layer tracking intake source, conversion rate, utilization and marketing spend the way Clio's benchmark data does. Firms that only build the internal layer eventually field the same client question - "why is this taking so long" - with no external data to answer it. Firms that only watch the external data never know whether their own funnel is the actual bottleneck.
| Pipeline stage | What to track | Data source | Compliance note |
|---|---|---|---|
| First contact | Referral source, response time | Firm CRM / intake form | Disclose tracking, get consent before profiling |
| Consultation booked | Conversion rate by source | Firm CRM | No sharing of case facts with ad platforms |
| Retained | Utilization rate, matter type mix | Practice management software | Aggregate reporting only, no individual PII in dashboards shared externally |
| Filed with USCIS/EOIR | Agency-published median timeline for that form/court | USCIS processing times tool, EOIR statistics | n/a - public agency data |
| Decision | Time-to-decision vs. published median | Internal case file + agency data | Retain for internal benchmarking only |
What this means for a firm's next dashboard build
The national numbers argue for optimism about the raw backlog, but they also raise the bar for firms that want to compete on speed and communication: if EOIR itself is completing cases 31% faster per adjudicator, a firm's own intake-to-filing time becomes the more visible bottleneck by comparison. Pairing agency data with the intake-funnel metrics Clio's research already validates - conversion by source, utilization, and marketing spend against profitability - is a more defensible build than tracking either half alone. Our data and analytics practice builds that kind of dual-layer dashboard, and if paid acquisition is part of the funnel, our growth marketing team can tie the ad spend side of it directly to the same conversion data. See how a comparable per-lead benchmark looks across other regulated, high-consideration verticals in our breakdown of cost per lead by industry, or talk to us about building the dashboard itself.
Frequently Asked Questions
What does immigration law tracking and analytics software actually measure?
At the firm level, it usually measures three things: intake-to-retention conversion, attorney utilization against the profession's benchmark, and case status against agency timelines. Clio's guide to firm spending found utilization above the industry average of 33% correlates with 41% higher marketing spend and 21% higher profitability, which is the number most tracking dashboards are ultimately built to move.
Is the national immigration court backlog actually shrinking?
By the numbers EOIR itself reports, yes for FY2025 into FY2026. EOIR says it completed more than 1.08 million cases and cut its pending caseload by more than 447,000 since January 20, 2025, and a separate DOJ budget filing puts the FY2025 backlog reduction at 5.1%, the first pending-case decrease in the agency's history since FY2006. Whether that pace holds depends on new filings, which is exactly the second half of the metric a firm's dashboard needs to watch.
Can a law firm ethically track and retarget website visitors who submit an intake form?
The ethics rules were written for phone calls and letters, and bar associations are still applying them to pixels. The Illinois State Bar's Ethics Opinion 18-01 addresses undisclosed tracking software in lawyer communications directly, and the broader principle - that a law firm website inviting inquiries can create an implied duty of confidentiality toward the visitor - predates most marketing analytics stacks. The safe pattern is consent-based tracking on intake forms and no resale or sharing of what a visitor discloses before representation is confirmed.
How fast does USCIS process immigration case types, and does that matter for law firm tracking?
It matters more than most firms treat it. USCIS publishes processing times by form and service center through its own case processing time tool, and those medians move quarter to quarter as filing volume and staffing shift. A tracking dashboard that only logs a firm's own intake funnel and ignores the agency-side clock will consistently under- or over-promise timelines to clients.
What is the single most useful number for a small immigration firm to track first?
Conversion from initial inquiry to signed retainer, tracked by referral source. Clio's research on firm spending shows the gap between an average-utilization firm and an above-average one is a 41% difference in marketing spend and a 21% difference in profitability - and that gap starts at the top of the funnel, not inside the case file.
Sources
Executive Office for Immigration Review - Workload and Adjudication Statistics
EOIR - Immigration Court Milestones announcement
U.S. DOJ - EOIR budget justification (adjudicator caseload data)
USCIS - Immigration and Citizenship Data / processing times
DHS Office of Homeland Security Statistics - Yearbook of Immigration Statistics 2024
Clio - 2026 Legal Trends Report for Solo and Small Law Firms
Clio - What Law Firm Expenses Lead to Growth
Clio - Marketing ROI for Lawyers
Illinois State Bar Association - Ethics Opinion 18-01
American Bar Association - Model Rule 7.1 commentary


