Table of contents
Hyperlocal marketing targets people inside a very small area — a few blocks, a zip code, a delivery radius — instead of a city or a metro. It trades reach for intent, because a nearby searcher is far closer to walking in.
Key Takeaways
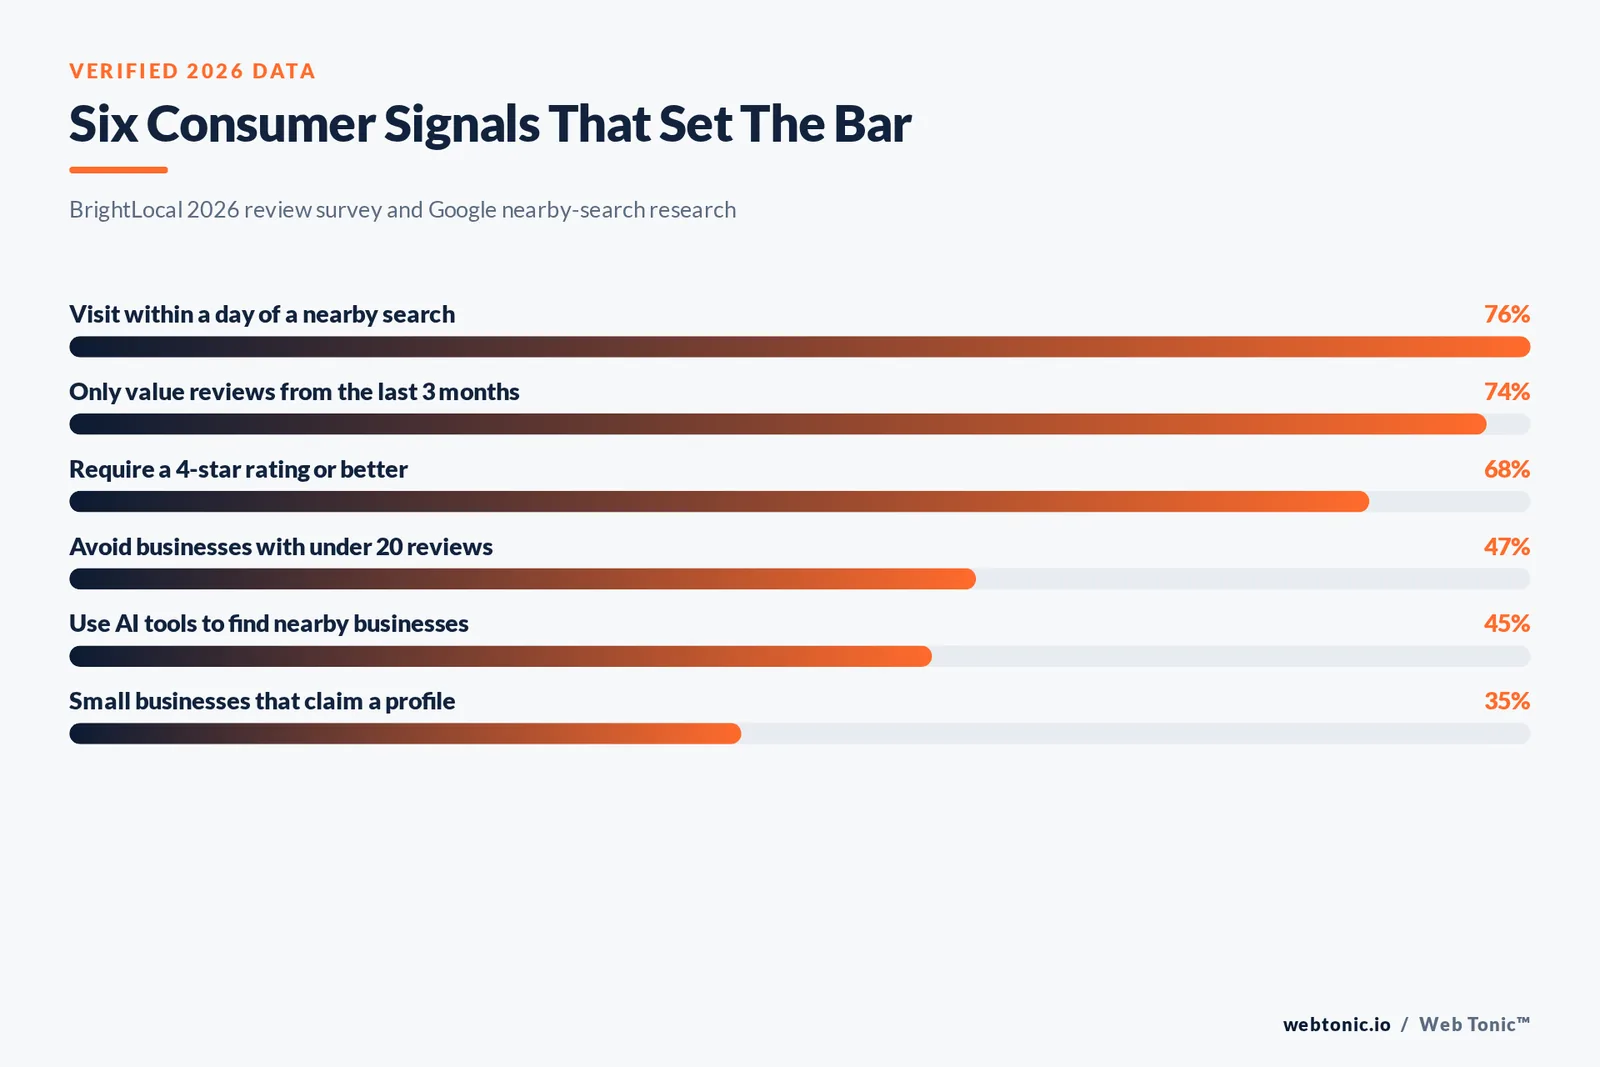
- 76% of people who run a nearby smartphone search visit a business within a day, and 28% of those visits end in a purchase — the reason hyper local targeting converts above broad local marketing.
- Google Business Profile signals carry roughly 32% of local pack influence in Whitespark's ranking-factor survey, making the listing the single highest-leverage hyperlocal asset.
- Only 35% of small businesses have a Google Business Profile and only 40% have a website (BrightLocal 2026), so the competitive bar in most zip codes is low.
- Generative AI tools jumped from 6% to 45% as a source consumers use to find local businesses — hyperlocal content now has to be quotable, not just rankable.
- Run 3 radius tiers, not 1: a 1-mile walk-in ring, a 3–5 mile drive ring, and a 10-mile catchment ring, each with its own budget and message.
What hyperlocal marketing means
Hyperlocal marketing is the practice of promoting a business to potential customers inside a tightly drawn geographic area — typically a radius of one to five miles, a set of zip codes, or a store's delivery zone — using location based targeting, localized content and community engagement rather than mass media. The unit of planning is the neighbourhood, not the market.
Traditional campaigns buy a whole city. Hyperlocal advertising buys the streets that actually feed the door. That distinction changes budget, creative and measurement, as the table below shows.
| Dimension | Citywide approach | Neighbourhood approach |
|---|---|---|
| Geographic unit | City, metro or DMA | Zip code, 1–5 mile radius, delivery zone |
| Primary trigger | Category demand | Proximity plus real time need |
| Creative | One brand message | Named streets, landmarks, nearby shoppers |
| Core asset | Website and brand campaigns | Google business listing plus store pages |
| Success metric | Market share, awareness | Foot traffic, calls, direction requests |
| Typical budget shape | One pooled budget | Budget per location or per radius tier |
Rule 1 — if two locations 6 miles apart share one campaign, you are not running hyperlocal marketing, you are running citywide promotion with an address bolted on.
Why proximity targeting works right now
Three shifts make the neighbourhood approach stronger than it was five years ago. First, mobile intent: Google's consumer research shows nearby searches convert to visits within hours, not weeks. Second, discovery has fragmented — BrightLocal's consumer review survey records Google's share as a review source falling from 83% to 71% while Apple Maps rose from 14% to 27% and AI assistants reached 45%. Third, ad platforms now expose radius, zip code and store-visit controls to businesses of any size.
| Signal | Verified figure | What it means for campaigns |
|---|---|---|
| Nearby search behaviour | 76% visit within a day; 28% purchase | Bid highest inside the walk-in ring |
| Review recency | 74% only value reviews from the last 3 months | Review generation must be continuous |
| Rating threshold | 68% require 4+ stars, 31% require 4.5+ | Rating is a media multiplier, not vanity |
| Review volume floor | 47% avoid businesses with fewer than 20 reviews | First goal per location: 20 fresh reviews |
| Listing coverage | Only 35% of SMBs claim a profile | Claiming still beats most rivals in the area |
| Local optimisation gap | 58% of companies do not optimise for local | Cheap share available in most postcodes |
How to draw the area: radius, zip code or drive time
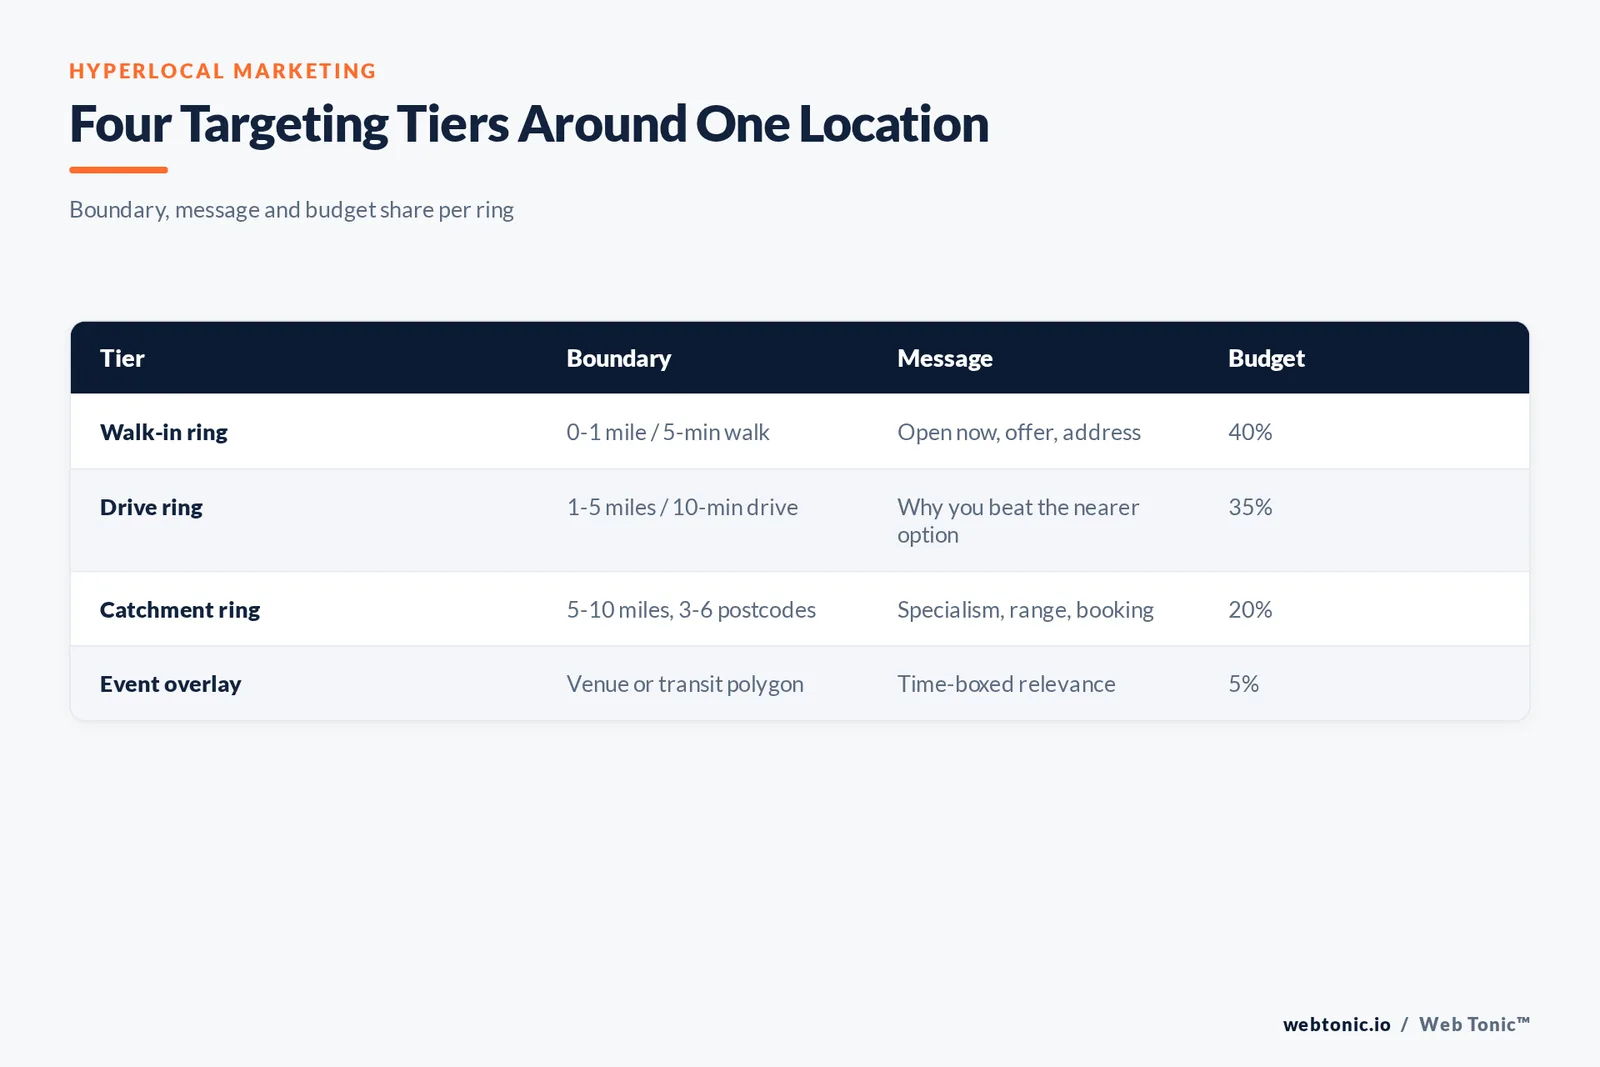
Every plan of this kind starts with a boundary. Draw it from where customers actually come from, not from a round number. Pull the postal codes on the last 200 transactions, then reverse-engineer the rings.
| Tier | Boundary | Message | Budget share |
|---|---|---|---|
| Walk-in ring | 0–1 mile / 5-minute walk | Open now, offer, exact address | 40% |
| Drive ring | 1–5 miles / 10-minute drive | Reason to choose you over the nearer option | 35% |
| Catchment ring | 5–10 miles or 3–6 zip codes | Specialism, range, appointment booking | 20% |
| Event overlay | Venue, campus or transit hub polygon | Time-boxed, real time relevance | 5% |
Limit 2: do not run more than 4 radius tiers per location — below roughly 300 monthly conversions per tier, the data is too thin to read.
Ten tactics that hold up
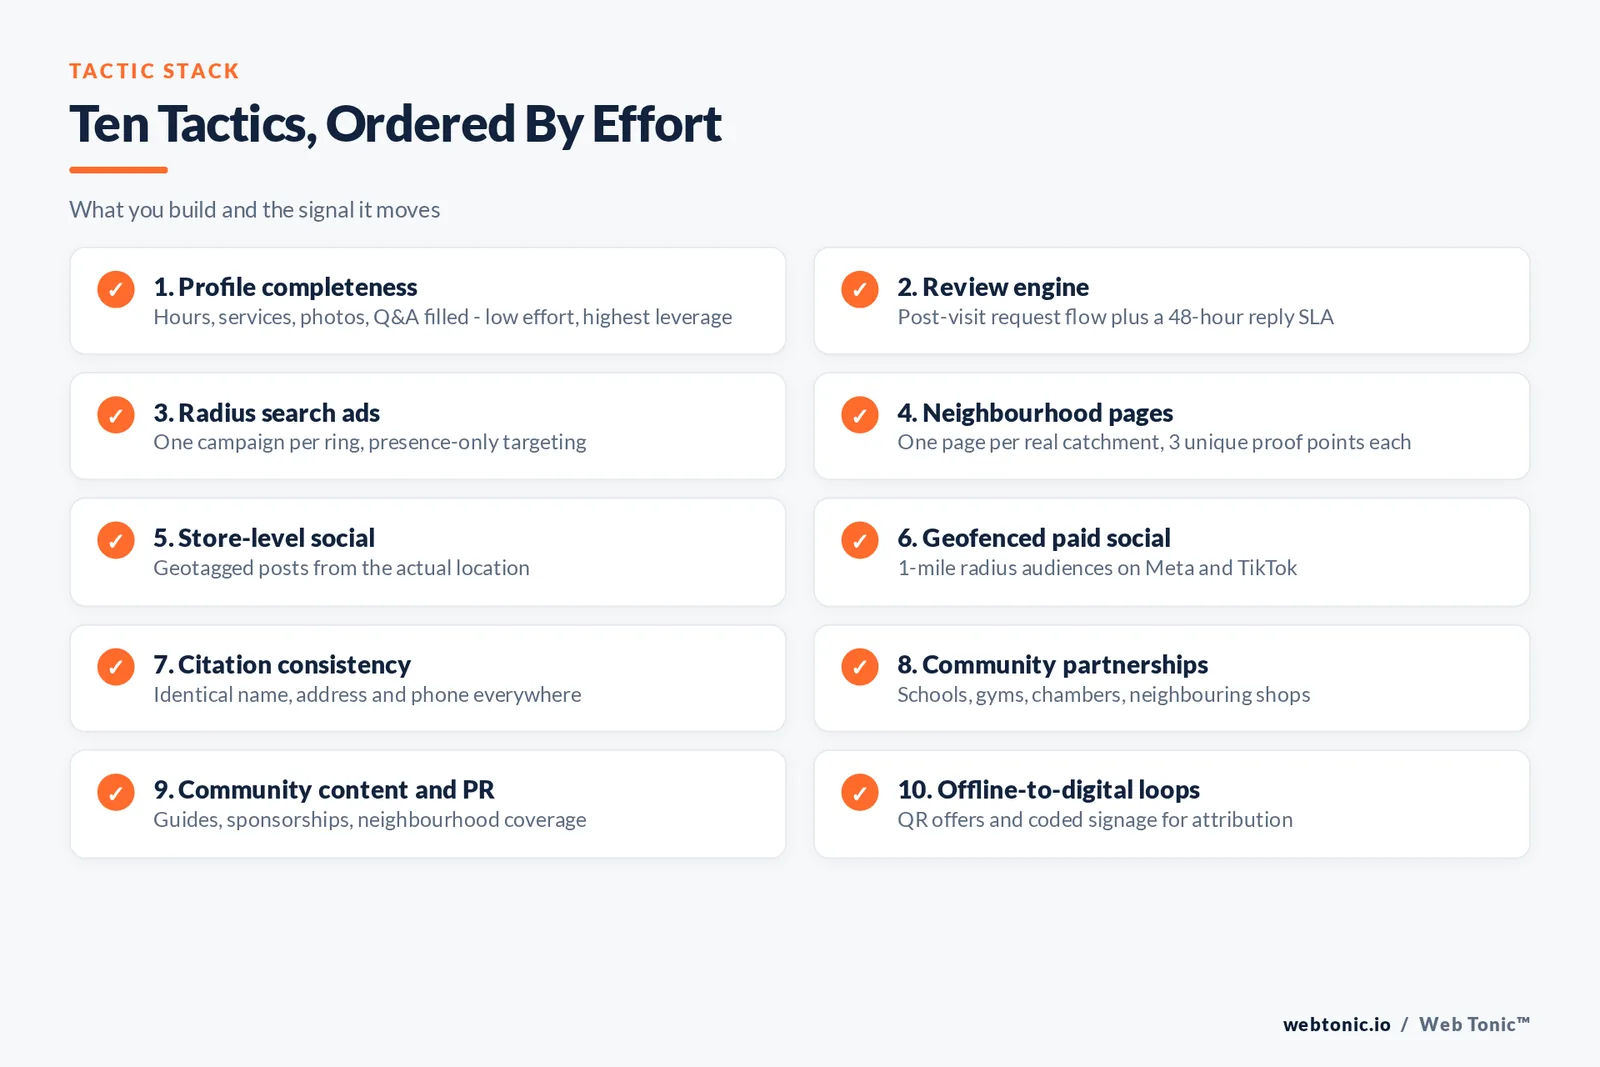
These are the tactics that survive contact with a real budget. Each one names the asset it needs and the signal it moves.
| Strategy | What you build | Signal it moves | Effort |
|---|---|---|---|
| 1. Profile completeness | Full google business listing: hours, services, photos, Q&A | Map pack rank, direction requests | Low |
| 2. Review engine | Post-visit request flow plus reply SLA | Rating, conversion rate | Low |
| 3. Radius search ads | Location-targeted campaigns per ring | Calls, visits in store | Medium |
| 4. Neighbourhood landing pages | One page per area with unique proof | Local seo visibility | Medium |
| 5. Store-level social accounts | Store-level profiles with geotagged posts | Engagement, saves, DMs | Medium |
| 6. Geofenced social ads | Radius audiences on Meta and TikTok | Reach inside the ring | Medium |
| 7. Citation consistency | Matching name, address phone number everywhere | Trust, ranking stability | Low |
| 8. Community partnerships | Schools, gyms, chambers, neighbouring shops | Referrals, links, goodwill | Medium |
| 9. Community content and PR | Guides, sponsorships, neighbourhood news coverage | Links, recall | High |
| 10. Offline-to-digital loops | QR offers, door drops, in-store signage | Attributable foot traffic | Medium |
Fact 3 — a complete profile makes a business 2.7x more likely to be considered reputable and lifts visits about 70% according to Google's own listing guidance, which is why strategy 1 outranks every paid tactic on this list.
Advertising platforms and their targeting controls
Most ad platforms support this kind of buy; they differ in how tightly you can draw the boundary and what you can optimise for. Google Ads lets you set a radius or a list of zip codes and target only people in or regularly in your targeted locations — the setting that stops your budget leaking to tourists searching from another state.
| Platform | Tightest boundary | Best for | Watch out for |
|---|---|---|---|
| Google Search | 1-mile radius or zip code list | Real time need, calls, direction requests | Presence vs interest setting |
| Google Performance Max | Radius with store goals | Multi location brands with feeds | Needs volume to learn |
| Meta ads | 1-mile radius pin, plus store traffic objective | Awareness and offers to local audiences | Thin audiences raise frequency fast |
| TikTok ads | City-level, some radius options | Younger reach, store discovery | Weakest geographic precision |
| Programmatic DOOH | Screen-level polygon | Commuter corridors near the store | Attribution is modelled |
| Direct mail / door drops | Carrier route, exact street | Households that never search | Slow feedback, needs a coded offer |
Trap 4 — location targeting defaults to "presence or interest" in many accounts, which can spend 20–40% of a hyperlocal budget outside the area. Change it before launch, then confirm with the geographic report.
The Google Business Profile checklist
The listing is the hyperlocal engine: it feeds the map pack, Maps, and increasingly the AI answers that now shape local discovery. Work the fields in this order, and verify the location before anything else.
| Field | Standard to hit | Why it matters |
|---|---|---|
| Primary category | Exact match to the money service | Strongest single ranking lever |
| Secondary categories | 3–5, all genuinely offered | Expands query coverage |
| Name, address phone number | Identical across web and directories | Consistency stabilises rankings |
| Hours and special hours | Updated monthly, holidays set | "Open now" filters spend and clicks |
| Photos | 10+ real interior, exterior, team | Drives clicks and trust |
| Services and products | Every service with 2–3 sentences | Adds text the profile can rank on |
| Reviews and replies | Reply to 100% within 48 hours | 80% of consumers favour full repliers |
| Structured data on site | LocalBusiness markup per location | Machine-readable confirmation |
Community content and social posts that earn attention
Standard 7 — every area page needs at least 3 unique local proof points (a named landmark, a local customer, a neighbourhood-specific service note) before it earns a URL.
Neighbourhood content is not a city page with the name swapped. It names the streets, the events, the weather, the school district — details that local marketing playbooks consistently rank above generic copy, and the details a competitor 200 miles away cannot fake. Citations establish existence, on-page local signals establish relevance; content establishes preference.
| Content type | Format | Cadence | Purpose |
|---|---|---|---|
| Neighbourhood guide | Article plus map embed | Quarterly | Links and topical depth |
| Staff and customer stories | Short-form video | Weekly | Engage local audiences |
| Event and sponsorship posts | Social media posts, geotagged | Per event | Community engagement proof |
| Behind-the-counter clips | Reels / TikTok | 2–3 per week | Discovery beyond the ring |
| Offer and hours updates | Profile posts | Weekly | Real time relevance |
| Area FAQ hub | Q&A page | Monthly refresh | Answer coverage for AI answers |
Volume context matters when you plan the social side: DataReportal's Digital 2026 report counts 5.66 billion social identities and roughly 2 hours 40 minutes of daily use, while Socialinsider's benchmark set puts brand engagement at 2.60% on TikTok versus 0.48% on Instagram and 0.15% on Facebook. Short-form video is where a small independent brand still gets unpaid reach.
Multi location brands: structure without chaos
Governance fact 8: brands running 10+ locations typically leak 30–50% of local search visibility to unclaimed or duplicated listings long before any ad budget is at fault.
Multi location programmes fail on governance, not ideas. The fix is a two-layer model: the brand owns templates, claims and compliance; the location owns the last 20% — photos, offers, replies, partnerships.
| Decision | Brand owns | Location owns |
|---|---|---|
| Profiles | Ownership, categories, NAP standard | Photos, posts, Q&A |
| Website | Store-page template, schema | Area proof, staff, parking notes |
| Paid media | Account structure, budget caps, radius rules | Local offer input |
| Reviews | Escalation policy, templates | Replies within 48 hours |
| Social | Brand kit, banned claims | Local social media accounts |
| Reporting | One dashboard, same metrics | Weekly commentary |
Rule 5 — one profile per physical door, never per service line. Duplicate listings split reviews and rankings, and merging them later costs weeks.
How to track performance
Measurement rule 9 — track 7 metrics per location, not 30; anything you cannot review inside 10 minutes a week will not change a decision.
The measurement problem is that the conversion often happens offline. Solve it with a small set of proxy metrics per ring, reviewed weekly, plus one true business number per month.
| Metric | Source | Read it as | Review |
|---|---|---|---|
| Direction requests | Profile insights | Intent to walk in | Weekly |
| Calls from listing and ads | Profile plus call reporting | High-intent demand | Weekly |
| Map pack impressions by query | Search Console, rank tracker | Visibility inside the ring | Monthly |
| Cost per visit | Ads platform store goals | Efficiency by radius tier | Weekly |
| Coded offer redemptions | POS | Attributable foot traffic | Monthly |
| New reviews and rating | Profile | Conversion multiplier | Weekly |
| Revenue per zip code | CRM or POS postcode field | Where to redraw the boundary | Quarterly |
Benchmark 6: LocaliQ's cross-industry search data puts the average cost per click at $5.42, so a $1,500 monthly ring budget buys roughly 275 clicks — small enough that creative and landing quality decide the outcome. If you need a second opinion on the numbers, our data intelligence team builds the location-level reporting most brands are missing.
Tactic mix by business type
The tactic mix should follow the economics: walk-in businesses buy proximity, service businesses buy trust, and appointment businesses buy calendar slots.
| Business type | First priority | Second | Skip |
|---|---|---|---|
| Café, salon, retail store | Profile plus photos plus reviews | 1-mile paid social | Long-form content |
| Home services | Radius campaigns by service | Neighbourhood pages | Broad awareness video |
| Clinic, dental, legal | Reviews plus booking flow | Postcode search campaigns | Discount messaging |
| Restaurant and delivery | Delivery-zone targeting | Short-form video | Wide-radius display |
| Retail chain | Listing governance at scale | Store-goal campaigns | One national landing page |
| B2B with a local footprint | Chamber and partner network | Search plus LinkedIn radius | Door drops |
Five traps that waste budget
Trap frequency 11 — in audits, wide radius settings and stale hours together account for more than 60% of wasted spend.
Most failures are mechanical, not strategic. Ahrefs' local guide and Whitespark's ranking-factor survey both point at the same short list.
| Trap | Symptom | Fix |
|---|---|---|
| Duplicate content pages | 20 area pages, 1 paragraph swapped | Unique proof per page or fewer pages |
| Radius too wide | Clicks up, visits flat | Cut to the ring that shows revenue |
| Stale hours and offers | Negative reviews about closures | Monthly hours audit, special hours set |
| No offline attribution | Cannot defend the budget | Coded offers plus postcode capture |
| Ignoring reviews | Rating under 4.0, CTR drops | 48-hour reply SLA, continuous requests |
For the search-side mechanics behind area pages and query research, our breakdown of how to read Google Trends pairs well with the platform's own Keyword Planner for spotting seasonal neighbourhood demand.
A 90-day plan
Plan note 10: the first 30 days should cost $0 in media — profile completeness and review volume raise the return on every dollar spent after them.
Sequence matters more than ambition. Fix the asset that every other channel depends on first, then buy demand, then build the moat.
| Window | Focus | Deliverables | Target |
|---|---|---|---|
| Days 1–15 | Foundations | Profile complete, NAP audit, tracking live | 100% of fields filled |
| Days 16–30 | Reviews | Request flow, reply SLA, templates | 20 fresh reviews per location |
| Days 31–50 | Paid rings | Three radius tiers, presence-only targeting | Cost per call baseline set |
| Days 51–70 | Content | Area pages, 8 short videos, profile posts | One page per real catchment |
| Days 71–90 | Community and scale | Two partnerships, coded offer test, ring redraw | Reallocate 20% of budget on data |
Brands that want the whole system built rather than assembled piece by piece can start with our growth marketing and service overview, or read more field notes on the Web Tonic blog. If you would rather talk it through, get in touch.
FAQ
What is hyperlocal marketing in simple terms?
It is marketing aimed at people in a very small area around a business — usually a one to five mile radius or a handful of zip codes — using location based ads, a fully optimised google business listing and content that references the actual neighbourhood.
How is hyperlocal marketing different from local seo?
Local seo is one channel inside a hyperlocal strategy. Local seo covers organic and map pack visibility; hyperlocal marketing also includes paid hyperlocal advertising, social media, community engagement and offline tactics such as door drops and sponsorships.
How much should a small business spend on hyperlocal campaigns?
Start with enough to buy roughly 250 to 300 clicks a month in the walk-in ring. At LocaliQ's $5.42 average cost per click that is about $1,350 to $1,600 per location per month, plus time for reviews and content, which cost nothing but attention.
How do you measure foot traffic from hyperlocal ads?
Combine three sources: direction requests and calls from the profile, visit or store-goal reporting inside the ads platform, and coded offers redeemed at the point of sale. No single one is complete, but together they show which radius tier earns the visits.
Does hyperlocal marketing work for multi location brands?
Yes, and it usually pays best there. Chains get compounding gains from listing governance, one reporting standard and per-store radius rules, provided each location keeps ownership of photos, offers and review replies.
Sources
BrightLocal Local Consumer Review Survey 2026 · Whitespark Local Search Ranking Factors · Google Business Profile Help (verification, listing quality) · Google Ads Help (location targeting) · Google Search Central (LocalBusiness structured data) · Moz local citations guide · Ahrefs local SEO guide · DataReportal Digital 2026 · Socialinsider social benchmarks 2026 · LocaliQ search advertising benchmarks. Figures verified August 2026.