Table of contents
Google Trends is a free Google tool that shows the relative popularity of search terms over time, by place and by category. It reports normalised interest on a 0–100 scale rather than absolute search volume.
Key Takeaways
- Google Trends normalises every series to a 0–100 index, where 100 is the peak of the period you selected — it never publishes raw search counts.
- Two datasets sit behind the tool: a real-time set covering the last 7 days and a non-real-time set running from 2004 to roughly 36 hours ago.
- You can compare up to 5 terms or topics at once, and filter by country, region, city, category and search property.
- A related query marked "Breakout" grew more than 5,000% — usually a term with almost no prior history.
- Google handles roughly 90% of global search, so Trends is a usable proxy for public demand even though it is a sample.
- Best uses: seasonality planning, 2-way term validation, launch timing and geographic prioritisation. Worst use: quoting it as a volume number in a report.
Most teams open Google Trends, type one keyword, look at a jagged line and close the tab. That is a waste: the tool answers questions no paid keyword database answers well — when demand peaks, where it concentrates, and which phrasing is winning right now. This page explains what the data actually is, then shows the workflows our growth marketing team runs with it.
How Google Trends works: the mechanics behind the line
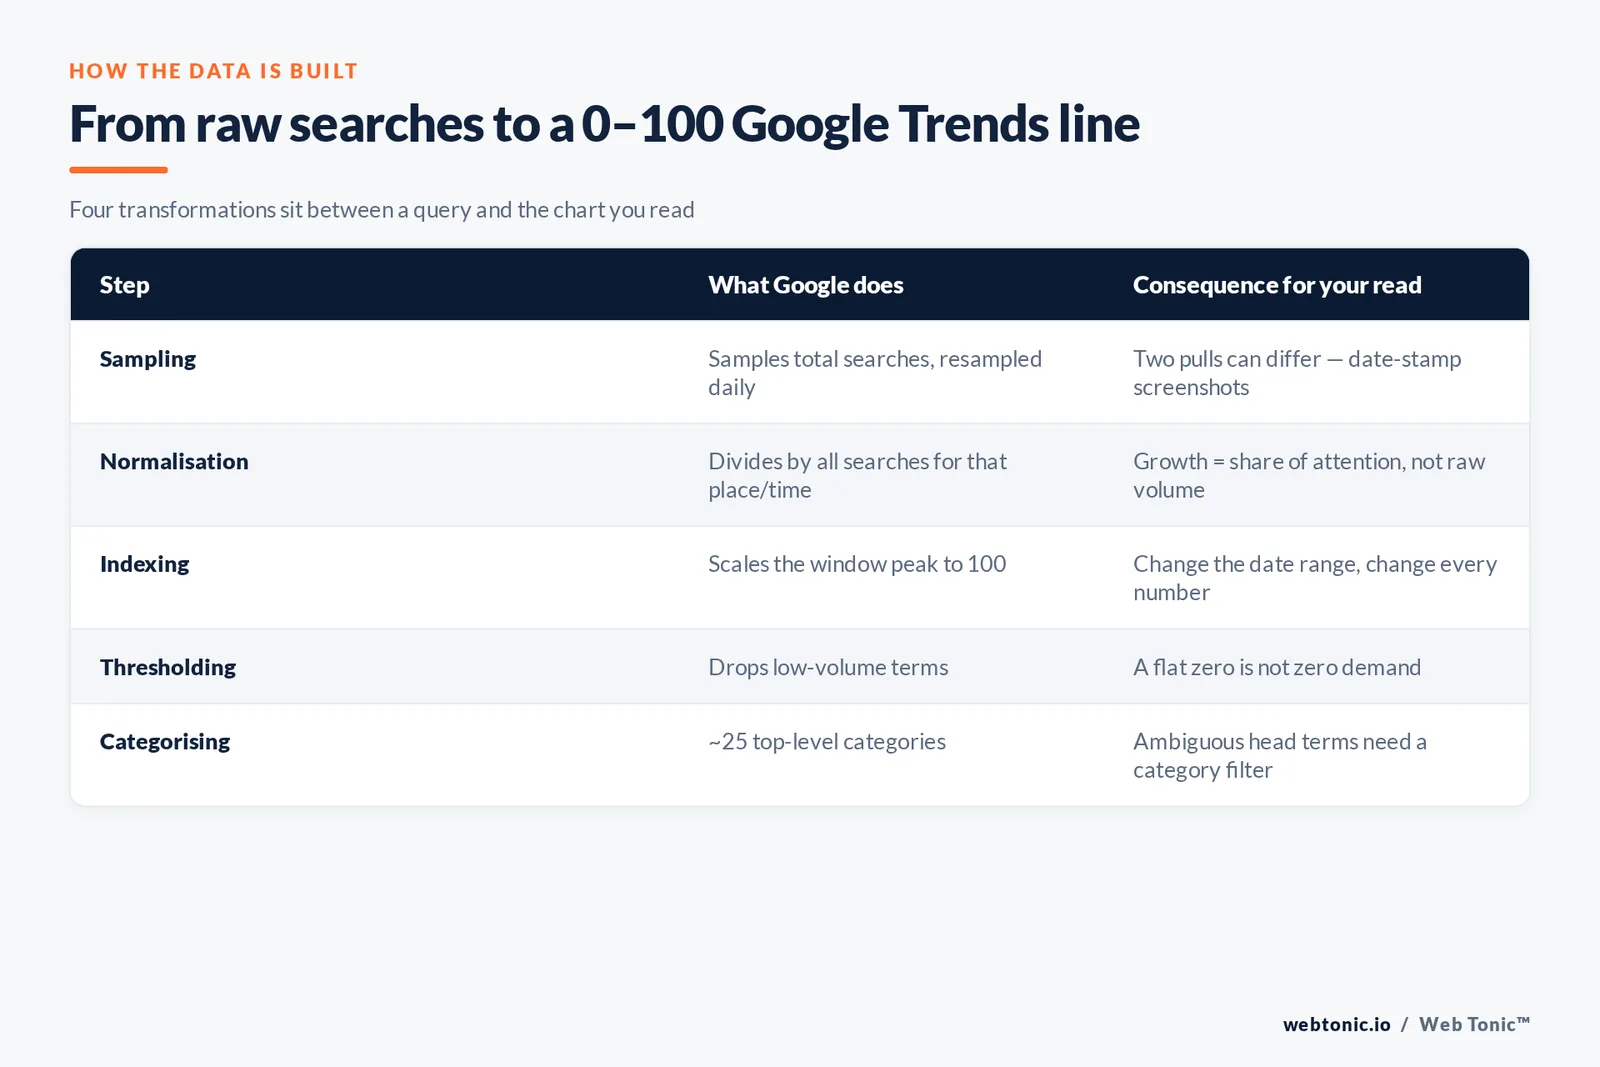
Every Trends chart is built from a sample of Google searches, then transformed three times before you see it. Understanding those three transformations is the difference between a useful read and a wrong conclusion. Google documents all of it in the Trends data FAQ.
| Step | What Google does | Why it matters to you |
|---|---|---|
| Sampling | Uses a sample of total searches, resampled daily | Two pulls of the same chart can differ slightly; screenshot and date-stamp anything you put in a deck |
| Normalisation | Divides each data point by total searches for that place and time | Growth in the line means growth in share of attention, not necessarily more searches |
| Indexing | Scales the series so the peak of your selected range equals 100 | Change the date range and every number changes — the index is relative to the window, not absolute |
| Thresholding | Drops terms below a minimum volume and removes repeated queries from the same user | Low-volume niche terms return a flat zero line; widen the geography or shorten the term |
| Category filtering | Classifies queries into around 25 top-level categories | Ambiguous words ("jaguar", "mercury") only make sense once a category is applied |
Rule 1 — never call a Trends value a volume. An index of 80 does not mean 80 searches, 80,000 searches, or 80% of anything. It means that week reached 80% of the busiest week in your window. If a stakeholder needs absolute numbers, pull them from a keyword tool and use Trends only for the shape of the curve.
Real-time versus non-real-time data
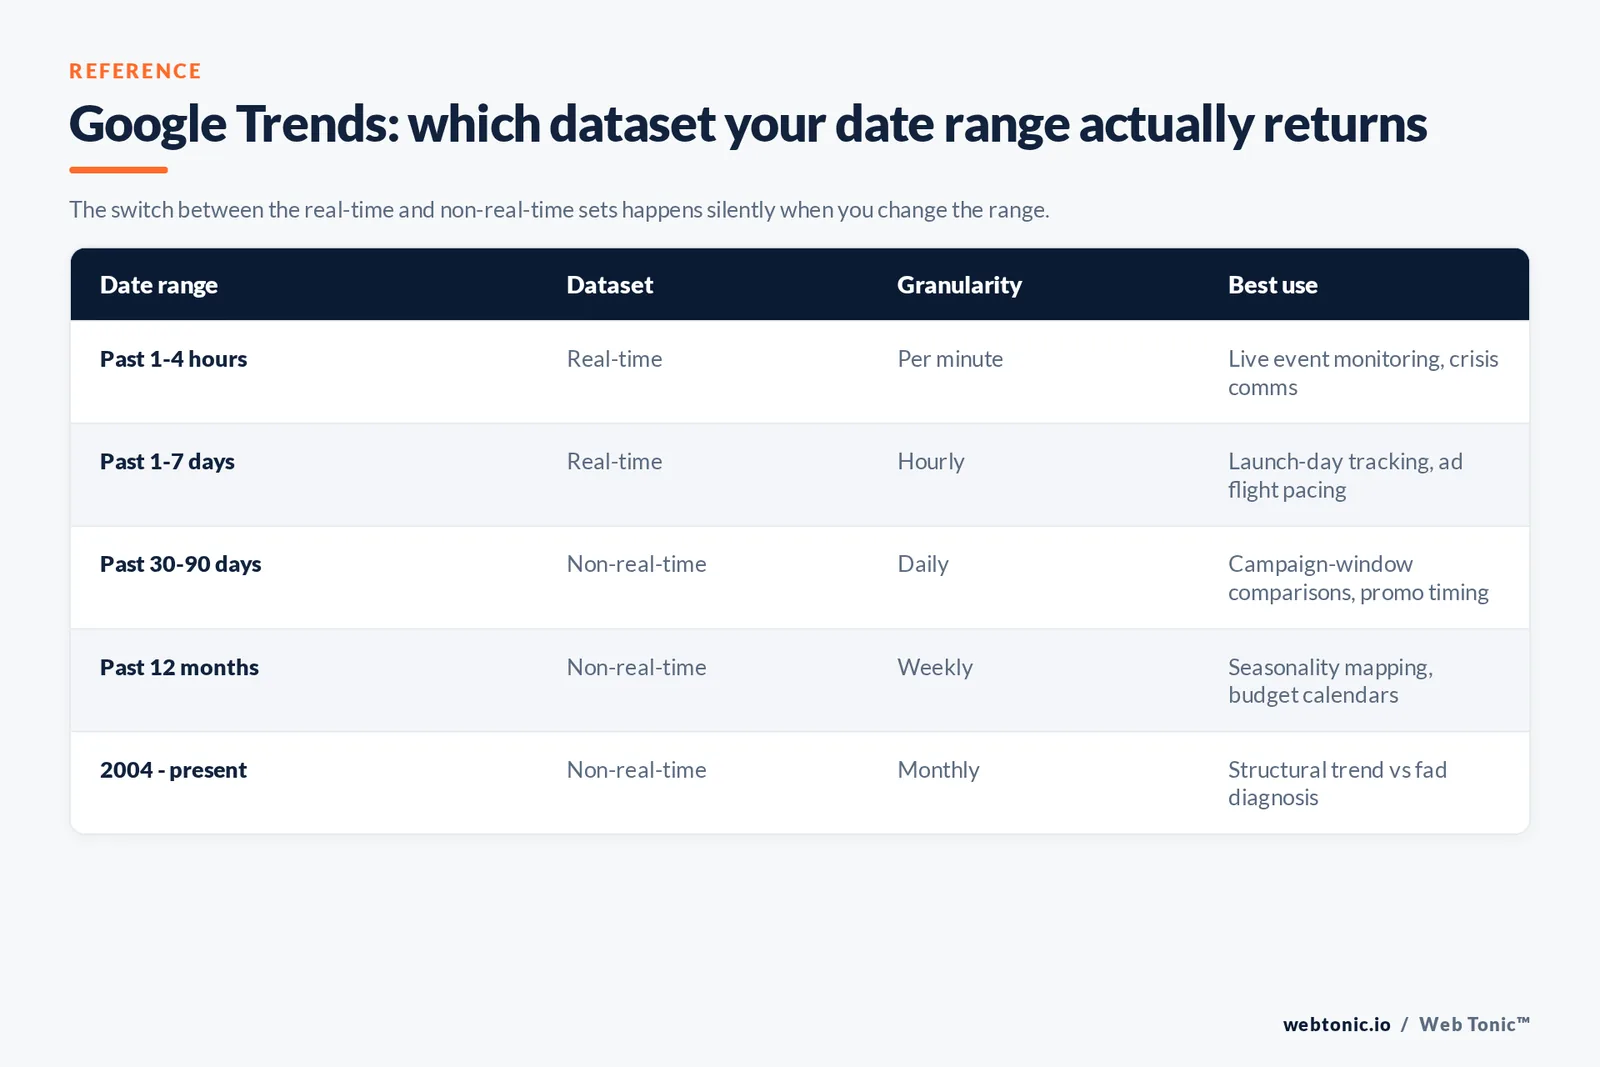
Trends holds two separate datasets, and the switch between them happens silently when you change the date range. Anything up to and including the past 7 days is served from the real-time set at hourly resolution. Anything longer is served from the non-real-time set, which lags by roughly a day and a half.
| Date range | Dataset | Granularity | Best use |
|---|---|---|---|
| Past 1–4 hours | Real-time | Per minute | Live event monitoring, crisis comms, newsroom decisions |
| Past 1–7 days | Real-time | Hourly | Launch-day tracking, ad flight pacing, day-part reading |
| Past 30–90 days | Non-real-time | Daily | Campaign-window comparisons, promo timing |
| Past 12 months | Non-real-time | Weekly | Seasonality mapping and budget calendars |
| 2004 – present | Non-real-time | Monthly | Structural trend versus fad diagnosis |
Trap 1 — comparing a 7-day chart to a 12-month chart. They come from different datasets at different resolutions, so a "drop" is often just a switch from hourly to weekly aggregation. Keep the range fixed when you compare periods, and use the term comparison view instead of eyeballing two screenshots.
Search terms versus topics
When you type a query, Trends offers a plain search term and sometimes a topic. A search term counts queries containing those words in that language. A topic groups every query Google believes refers to the same entity, across spellings, misspellings and languages. Picking the wrong one is the single most common beginner mistake.
| Question you are asking | Choose | Reason |
|---|---|---|
| Is this exact phrasing gaining ground? | Search term | Keeps the literal wording, which is what you write into ad copy and headings |
| Is interest in this brand or product growing? | Topic | Absorbs misspellings and translations, giving a cleaner demand curve |
| Which of two names should we use? | Two search terms, compared | Naming decisions live in the literal words, not the entity |
| How big is a category in a new market? | Topic, geography set | Language differences would otherwise flatten the term |
| Did our campaign move the needle? | Branded search term | Branded query lift is the cleanest available awareness signal |
The five screens you actually use
The interface looks larger than it is. Getting started guidance sits in Google's own Trends walkthrough, but in practice five screens carry all the value.
| Screen | What it shows | Decision it supports |
|---|---|---|
| Explore | Interest over time for up to 5 terms | Which term, which season, which market |
| Interest by subregion | Index by state, metro or city | Geo bid modifiers, service-area expansion, store openings |
| Related topics | Rising and top adjacent entities | Content clusters and internal link planning |
| Related queries | Rising and top queries, with Breakout flags | New page ideas and negative keyword discovery |
| Trending now | Live surging searches by country | Newsjacking, social reactivity, PR pitch timing |
Limit 1: five terms. If you need to rank twelve keywords, run three overlapping comparisons that share one anchor term, then rescale the rest against that anchor. It is manual, and it is the only sound way to build a bigger league table from a five-slot tool.
Search properties: five different demand signals
The property dropdown is the least used and most valuable control. Switching from Web Search to YouTube Search on the same term routinely reverses the ranking of two competitors, because how people search for entertainment differs from how they search for solutions.
| Property | Signal it captures | Use it for |
|---|---|---|
| Web Search | General intent, the default | SEO and paid search planning |
| Image Search | Visual and inspiration-led demand | Design, fashion, interiors, recipe content |
| News Search | Editorial and event-driven attention | PR windows and crisis tracking |
| Google Shopping | Commercial product demand | Retail seasonality and feed prioritisation |
| YouTube Search | How-to and entertainment demand | Video briefs and creator partnerships |
Six workflows that produce decisions, not screenshots
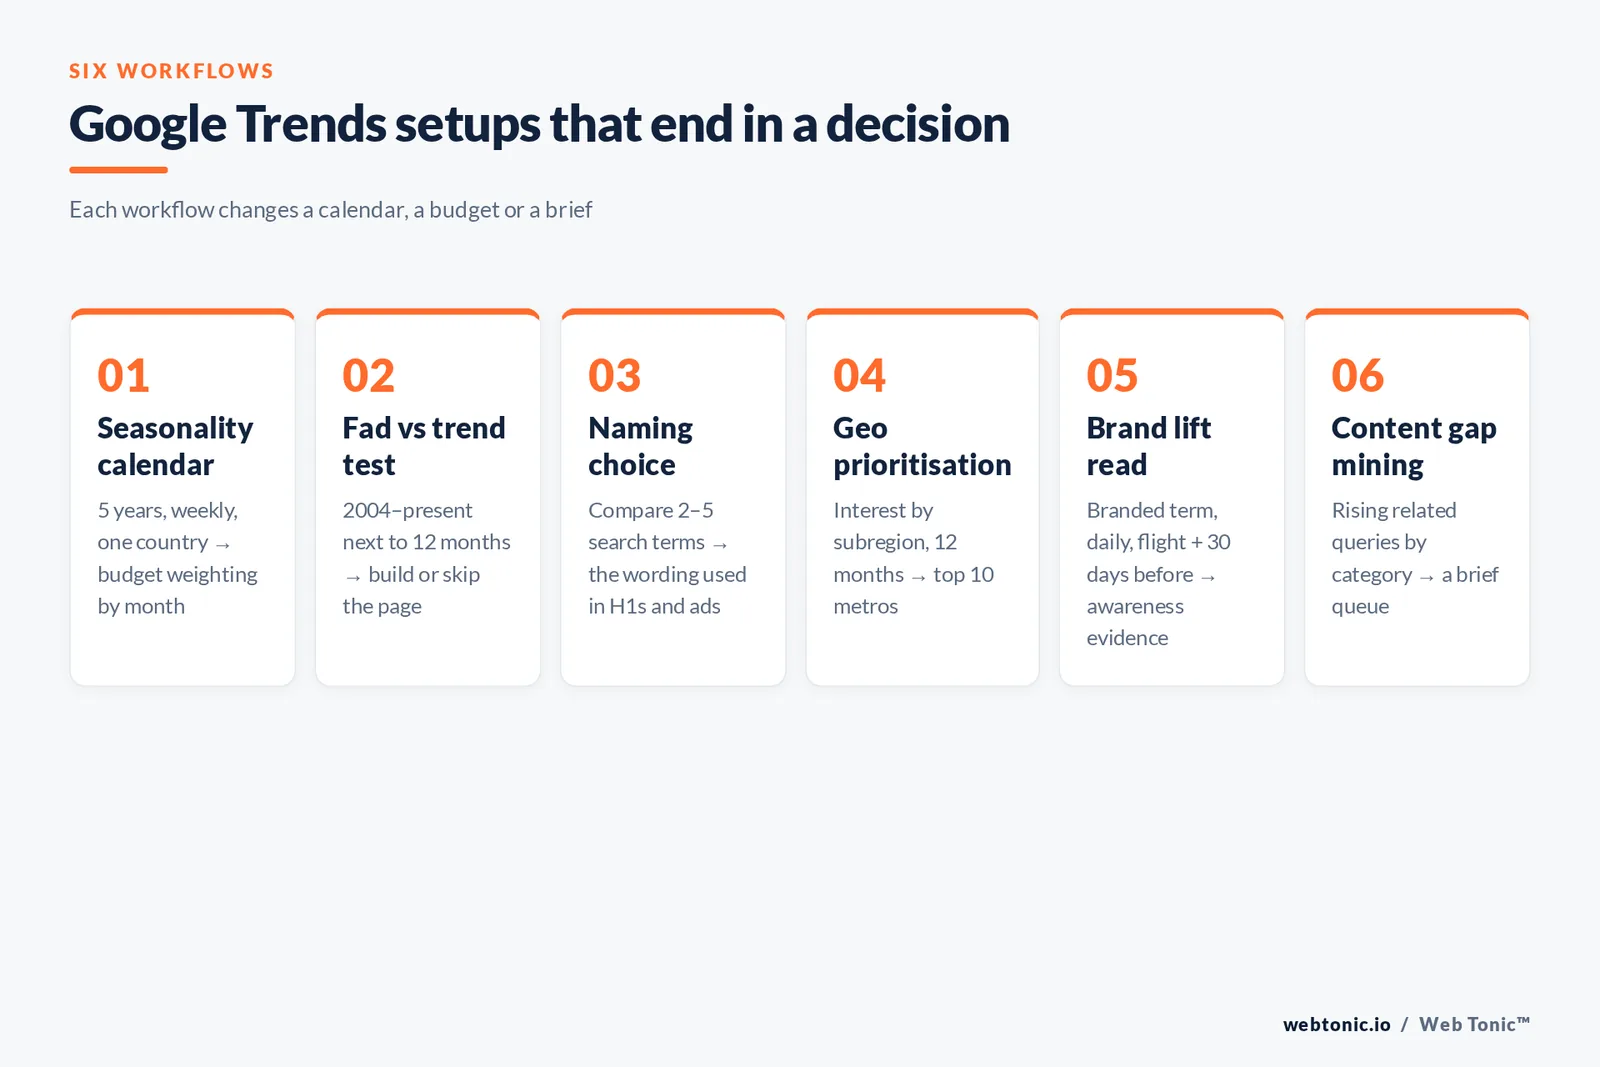
These are the repeatable uses. Each one ends in a change to a calendar, a budget or a brief — which is the test any research tool should pass.
| # | Workflow | Setup | Output |
|---|---|---|---|
| 1 | Seasonality calendar | Past 5 years, weekly, one country | Month-by-month budget weighting and publish dates |
| 2 | Fad versus trend test | 2004–present alongside past 12 months | Go or no-go on building a permanent page |
| 3 | Naming and phrasing choice | Two to 5 search terms compared | The wording used in H1s, ads and product names |
| 4 | Geo prioritisation | Interest by subregion, 12-month range | Top 10 metros for local pages and geo bids |
| 5 | Brand lift read | Branded term, daily, campaign window plus 30 days before | Evidence of awareness impact for the board deck |
| 6 | Content gap mining | Rising related queries, filtered by category | A brief queue of genuinely emerging questions |
Workflow 5 deserves a note. Because Trends is normalised, a branded search rise during a campaign is one of the few awareness measures that does not depend on your own tracking setup — useful when cookie loss has made everything else fuzzy. Our data intelligence team pairs it with server-side conversion data rather than treating either as truth on its own.
How to use Google Trends by business type
The same tool answers a different question depending on what you sell. These are the setups we hand to clients so the first Google Trends session produces something usable instead of a pretty graph.
| Business type | Question to ask Trends | Setup | What you do with the answer |
|---|---|---|---|
| Ecommerce retail | When does product demand turn? | Google Shopping property, past 5 years, weekly | Set feed priorities and promo dates 4–6 weeks before the historical upswing |
| Local services | Which metros search hardest for this job? | Interest by subregion, 12 months, one state | Pick the next 3 city pages and geo bid adjustments |
| B2B SaaS | Is the category name changing? | Compare 2–5 category search terms, 2004–present | Rename the core landing page to the winning phrasing |
| Publishers and media | What is surging in the last hour? | Trending now plus past 4 hours real-time | Commission or reslot a story the same day |
| Agencies and consultancies | Which service line is gaining interest? | Service terms compared, weekly, past 2 years | Shift new-business focus and case study production |
| Travel and hospitality | How far ahead do people research? | Destination topic, daily, past 90 days | Set the booking-window offset for paid flights |
| Healthcare and clinics | Which condition or treatment query is rising? | Related queries, health category filter | Build the education page before competitors notice |
Rule 2 — write the decision down first. Before you open the Explore screen, note the sentence the data will complete: "We will publish X in month Y" or "We will move Z% of budget to metro W". A chart that cannot complete such a sentence should not go in the deck.
Google Trends versus keyword tools
Trends is not a keyword research tool and keyword tools are not trend tools. They answer different questions, and the mistake is asking one to do the other's job. Both Ahrefs and Semrush publish their own integrations for exactly this reason.
| Capability | Google Trends | Keyword databases | Trend-spotting tools |
|---|---|---|---|
| Absolute volume | No — index only | Yes, modelled monthly averages | Sometimes, modelled |
| Recency | Minutes to 36 hours | Usually a monthly refresh | Weekly |
| History depth | Back to 2004 | Typically 1–5 years | Varies |
| Geographic depth | Country to city | Country, sometimes region | Country |
| Cost | Free | Paid subscription | Freemium, e.g. Exploding Topics |
| Best question | "When and where?" | "How many?" | "What is next?" |
Exporting, citing and automating the data
Every chart exports to CSV, and each panel can be embedded with Google's own code so a dashboard stays live rather than going stale. Google's export, embed and cite guidance also sets the attribution expectations if you publish a chart.
| Method | How | Watch out for |
|---|---|---|
| CSV download | Download icon on each panel | The header rows carry the date range — keep them for provenance |
| Embed | Embed icon, copy the snippet | Third-party script weight; test against Core Web Vitals |
| Unofficial API wrappers | Community libraries such as pytrends | Unofficial, rate-limited and liable to break without notice |
| Manual anchoring | Repeat a shared anchor term in every export | Only reliable way to stitch multiple comparisons together |
Five traps that produce wrong conclusions
Trap 2 — reading a flat zero as zero demand. Below Google's volume threshold, a term returns nothing at all. Broaden the country, drop a qualifier or switch to the topic before concluding a market does not exist.
Trap 3 — ignoring the category filter. Ambiguous head terms mix unrelated intents. Applying one of the roughly 25 categories usually reshapes the curve completely.
Trap 4 — treating share as growth. Because the series is normalised against all searches, a rising line can coexist with falling absolute searches if the total pool shrank. Pair it with a volume source before you commit budget.
Trap 5 — quoting a single spike. One-week spikes are usually news, not demand. Require 3 consecutive higher periods before you call something a trend.
Trap 6 — forgetting the sample refresh. Charts move slightly day to day. Date-stamp screenshots, and if a number goes into a client report, export the CSV that produced it.
Where Trends fits in a modern search strategy
Google still handles the overwhelming majority of search — roughly 90% of the global market according to Statcounter — so its query stream remains the best public proxy for what people want. That matters more, not less, as AI answers absorb informational clicks: knowing which questions are rising tells you where to build genuinely useful pages, which is exactly what Google's own helpful content guidance rewards.
The tool has been public since 2006 and its methodology has been picked over by researchers ever since, including well-documented episodes where Trends-based prediction models overshot reality — a reminder that it is a demand signal, not a forecast. Read the background on the tool's history, then treat every chart as one input among several. More playbooks like this sit on the Web Tonic blog, and if you would rather have the analysis done for you, talk to our team.

FAQ
Is Google Trends free to use?
Yes. Google Trends is free, requires no account for the core Explore and Trending Now screens, and exports CSV data at no cost. There is no paid tier and no official public API, which is why teams that need automation lean on unofficial community wrappers.
Why does Google Trends not show search volume?
Google deliberately publishes a normalised 0–100 index instead of counts. Each data point is divided by total searches for that time and place, then scaled so the peak of your chosen window equals 100. The design protects Google's proprietary volume data while still making relative demand comparable across regions of very different sizes.
How accurate is Google Trends?
It accurately reflects a sample of Google searches, which is a large but incomplete slice of public interest. Accuracy problems come from misuse rather than the data: reading a normalised index as volume, comparing incompatible date ranges, skipping the category filter, or drawing conclusions from terms below the volume threshold.
What does "Breakout" mean in related queries?
Breakout replaces a percentage when growth exceeds roughly 5,000%, which normally means the query had almost no measurable history before. Breakout terms are strong content ideas but weak budget commitments, because many of them are news-driven and fade within weeks.
Can Google Trends predict sales?
It can improve a forecast but should never be the forecast. Branded and category query interest often leads purchase behaviour by days or weeks in considered categories, so it works well as a leading indicator inside a model that also contains price, promotion and inventory data.
Sources
Google Trends Help — FAQ about Google Trends data; Get started with Google Trends; Compare Trends search terms; Export, embed and cite Trends data · Google Search Central — creating helpful content · Statcounter Global Stats — search engine market share · Ahrefs and Semrush — Google Trends guides · Exploding Topics · pytrends (community library) · web.dev — Core Web Vitals · Wikipedia — Google Trends. All URLs checked August 2026.