Table of contents
Hospitality and travel demand is tracked from three directions that rarely talk to each other: search behaviour on Google and YouTube, first-party booking data held by OTAs and hotel groups, and hard supply-side benchmarks like occupancy and RevPAR. This page lines up sourced 2026 figures from each and asks what a hospitality marketer's attribution stack is actually measuring against.
Key Takeaways
- 53% of travellers regularly use Google Search for trip research and inspiration.
- Search plus YouTube together drive 21% higher ROAS than all other media combined.
- 77% of AI Overviews and AI Mode users say they decide faster, and 75% say more confidently, because of them.
- Expedia Group's advertising arm runs on 200-plus petabytes of first-party traveler data.
- Expedia's Unpack '26 research surveyed 24,000 respondents across 18 countries.
- US hotel RevPAR rose 8.4% year over year in June 2026, per CoStar's STR benchmark.
- Occupancy reached 69.6% and average daily rate hit US$173.76 the same month.
- By the week of September 19, 2026, RevPAR was up 10.4% year over year.
- Phocuswright frames global gross travel bookings at approximately USD 1.67 trillion in 2025.
- Skift and Amperity surveyed more than 350 senior travel leaders on data strategy.
- Travel carries a 9.32% average paid-search click-through rate, the second-highest of 23 industries LocaliQ tracks.
- Travel's average cost per lead is USD 44.70, well under the 23-industry average.
- Google Hotel Ads lifted Hilton's conversion rate 45% and ROI 12% against traditional search ads, in Google's own published case study.
- Expedia Group's advertising business grew nearly 20% year over year as of mid-2026.
The measurement problem starts with where travellers actually look
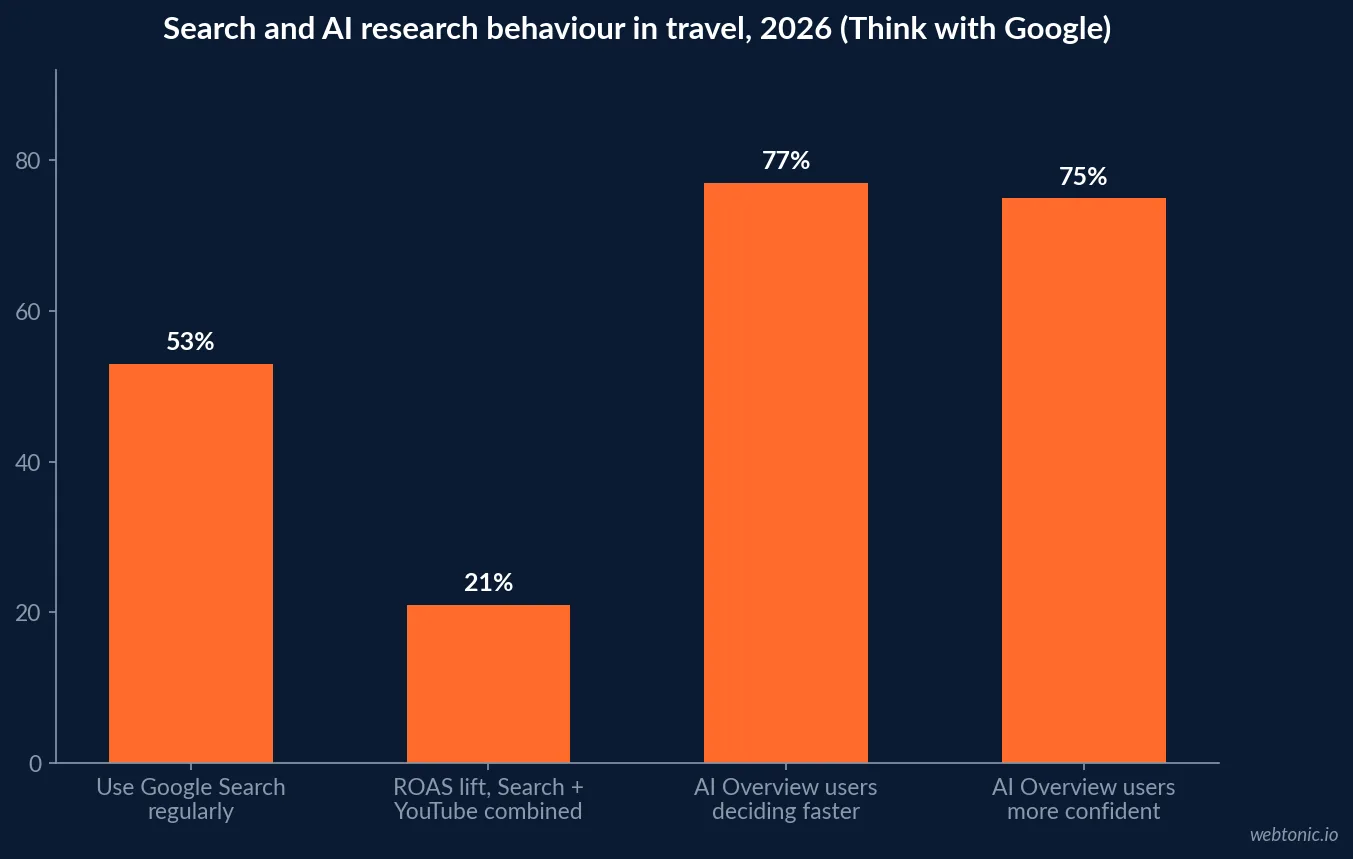
Think with Google's September 2026 travel marketing research states that 53% of travellers regularly use Google Search to learn about, stay informed on, or simply enjoy content related to travel - and that running Google Search and YouTube campaigns together drives 21% higher ROAS than all other media combined. That is the baseline a hospitality attribution model has to explain before a single AI Overview enters the picture.
Layer AI-assisted search on top and the decision, not just the discovery, moves earlier: Google reports that 77% of AI Overviews and AI Mode users agree they make decisions faster, and 75% agree they decide more confidently, because of them.
| Search behaviour signal (2026) | Figure | Source | What it means for tracking |
|---|---|---|---|
| Travellers using Google Search regularly | 53% | Think with Google | Search remains the primary discovery surface |
| ROAS lift, Search + YouTube combined | 21% higher | Think with Google | Cross-format attribution beats single-channel views |
| AI Overview/Mode users deciding faster | 77% | Think with Google | Research compresses before a click ever fires |
| AI Overview/Mode users deciding more confidently | 75% | Think with Google | Confidence, not just speed, shifts upstream |
What the paid-search baseline looks like for Travel as a category
LocaliQ's 2026 benchmark study, covering more than 13,000 US search advertising campaigns run between April 2025 and March 2026, puts Travel's average click-through rate at 9.32% - the second-highest of the 23 industries it tracks, behind only Arts & Entertainment. Travel's average cost per click is USD 2.14, its conversion rate is 5.83%, and its average cost per lead is USD 44.70, one of the cheapest categories in the dataset.
Cheap, high-CTR traffic that still converts at nearly 6% is an unusually favourable position for a tracking stack to defend - the risk is treating that ease as permanent instead of watching it erode as AI search reshapes the click.
| Metric (2026, LocaliQ) | Travel | 23-industry average | Read |
|---|---|---|---|
| Click-through rate | 9.32% | 6.64% | Travel intent queries convert attention easily |
| Cost per click | USD 2.14 | USD 5.42 | Among the cheapest clicks of any tracked category |
| Conversion rate | 5.83% | 8.18% | Below average - browsing outweighs booking intent on search |
| Cost per lead | USD 44.70 | n/a (varies) | Cheap relative to Industrial & Commercial (USD 75.19) |
The supply-side numbers a marketing dashboard has to react to
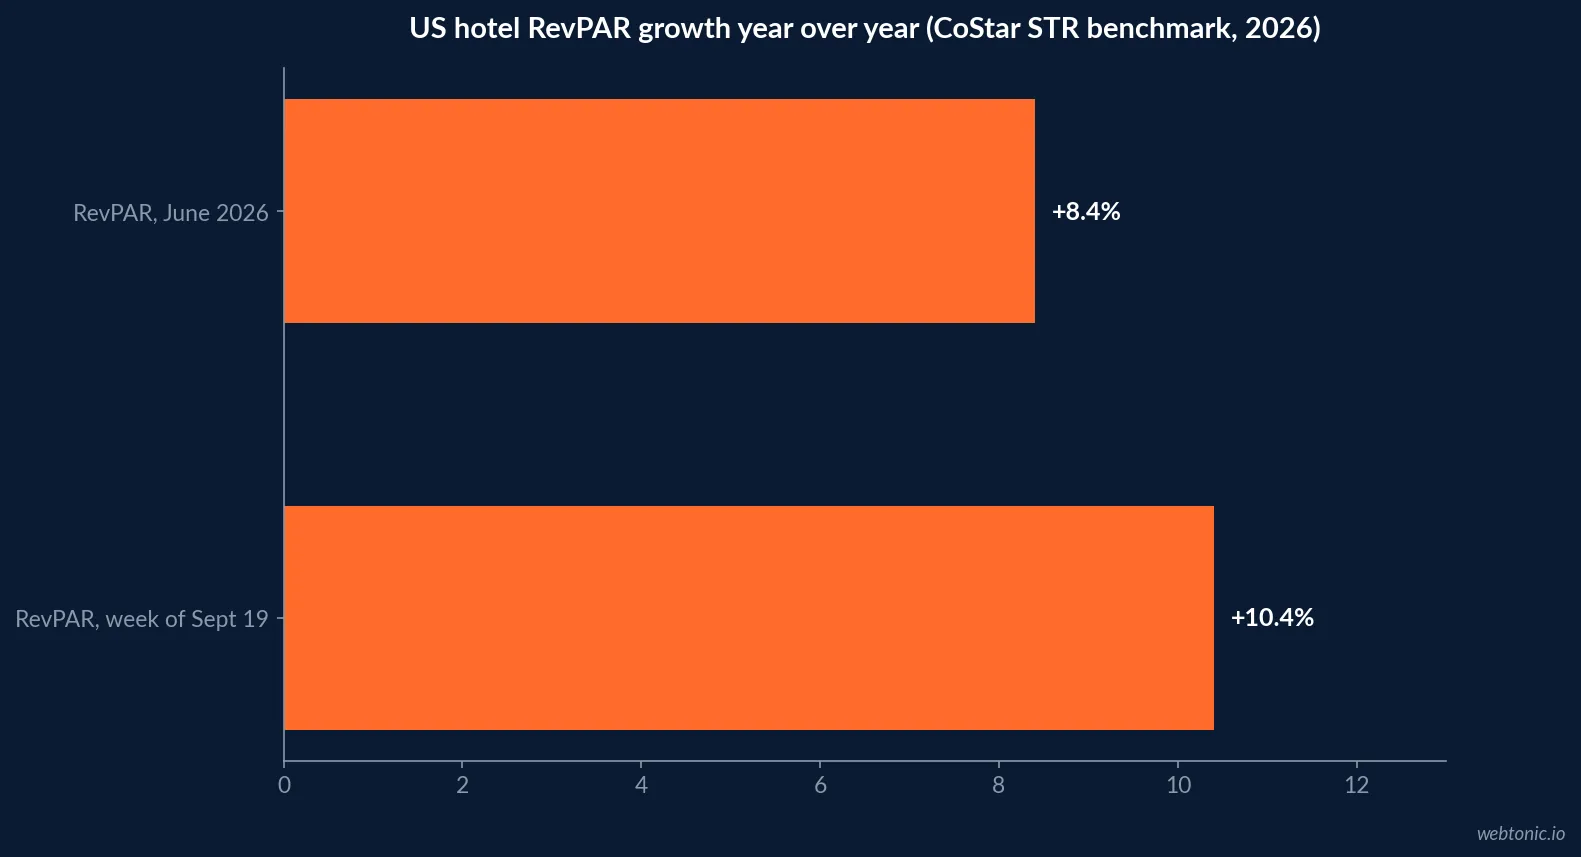
Demand data means nothing without the supply context it is measured against. CoStar's STR benchmark reported US hotel performance for June 2026 at 69.6% occupancy (+1.6% year over year), average daily rate of US$173.76 (+6.7%), and RevPAR of US$120.97 (+8.4%). By the week ending September 19, 2026, occupancy had climbed to 71.1% and RevPAR to US$127.43, up 10.4% year over year.
Phocuswright's Travel Forward 2026 research frames the scale behind those room-night numbers, putting total global gross travel bookings at roughly USD 1.67 trillion for 2025.
| STR/CoStar US hotel metric | June 2026 | Week of Sept 19, 2026 | YoY direction |
|---|---|---|---|
| Occupancy | 69.6% | 71.1% | +1.6% then +4.4% |
| Average daily rate | US$173.76 | US$179.30 | +6.7% then +5.7% |
| RevPAR | US$120.97 | US$127.43 | +8.4% then +10.4% |
Where the first-party data actually lives
Most hospitality brands cannot build attribution infrastructure at the scale of the platforms they distribute through. Expedia Group states its advertising business is built on more than 200 petabytes of first-party traveler intent and purchase data across Expedia, Hotels.com and Vrbo, and reports its advertising revenue grew nearly 20% year over year as of mid-2026. Its own Unpack '26 research is built from 24,000 survey respondents across 18 countries, layered on top of that first-party base.
That scale gap is the practical reason so much hospitality attribution work runs through OTA and metasearch data-sharing products instead of an in-house identity graph - the volume needed to make a probabilistic model useful sits with a handful of platforms, not with any single hotel brand.
| First-party data asset (2026) | Scale | Source | Who actually holds it |
|---|---|---|---|
| Expedia Group traveler data | 200+ petabytes | Expedia Group (advertising solutions) | OTA / travel media network |
| Unpack '26 survey base | 24,000 respondents / 18 countries | Expedia Group with OnePoll | OTA-commissioned consumer research |
| Skift/Amperity data-strategy study | 350+ senior travel leaders surveyed | Skift Research with Amperity | Cross-industry travel leadership sample |
| Phocuswright market sizing | USD 1.67 trillion gross bookings (2025) | Phocuswright Travel Forward 2026 | Independent travel research house |
What Google's own case data shows a dedicated format can do
Beyond aggregate benchmarks, Google has published carrier-level evidence that dedicated hotel ad formats change the attribution picture. In its Hotel Ads case study, Hilton Worldwide - more than 4,250 properties across 93 countries at the time - reported a 45% improvement in conversion rate and 12% stronger ROI versus its traditional search ads once it moved to Google Hotel Ads across all its properties. The case study itself is older, but it remains the clearest published number Google has attached to the format, and the underlying logic - a purpose-built inventory feed beats a generic search ad for a bookable product - still holds in 2026's AI-assisted search environment.
The real gap: fragmented data, not missing data
Skift Research and Amperity's 2026 study, drawing on insights from more than 350 senior travel leaders, frames the industry's problem as execution rather than collection. Travel brands already gather guest data across booking engines, loyalty programs and on-property systems; the gap is turning that fragmented data into personalization or attribution decisions in real time, before the moment of booking has passed.
That framing matters for anyone building a tracking stack: buying another data source rarely closes this gap. Stitching the sources already owned usually does more, which is the same conclusion Skift and Amperity's leader survey reaches.
| Where hospitality data commonly sits | Owned by | Common blocker to using it | Fix that actually moves it |
|---|---|---|---|
| Booking engine / PMS records | Individual property or brand | Not unified across brands in a portfolio | Central identity resolution layer |
| Loyalty program activity | Brand corporate | Siloed from campaign platforms | Server-side event forwarding |
| OTA / metasearch click and conversion data | Expedia Group, Booking Holdings, Google | Aggregated, not guest-level | Platform-native audience and measurement products |
| On-property guest services data | Property operations | Rarely reaches marketing at all | Lightweight CRM sync, not a new platform |
Building the tracking stack in the right order
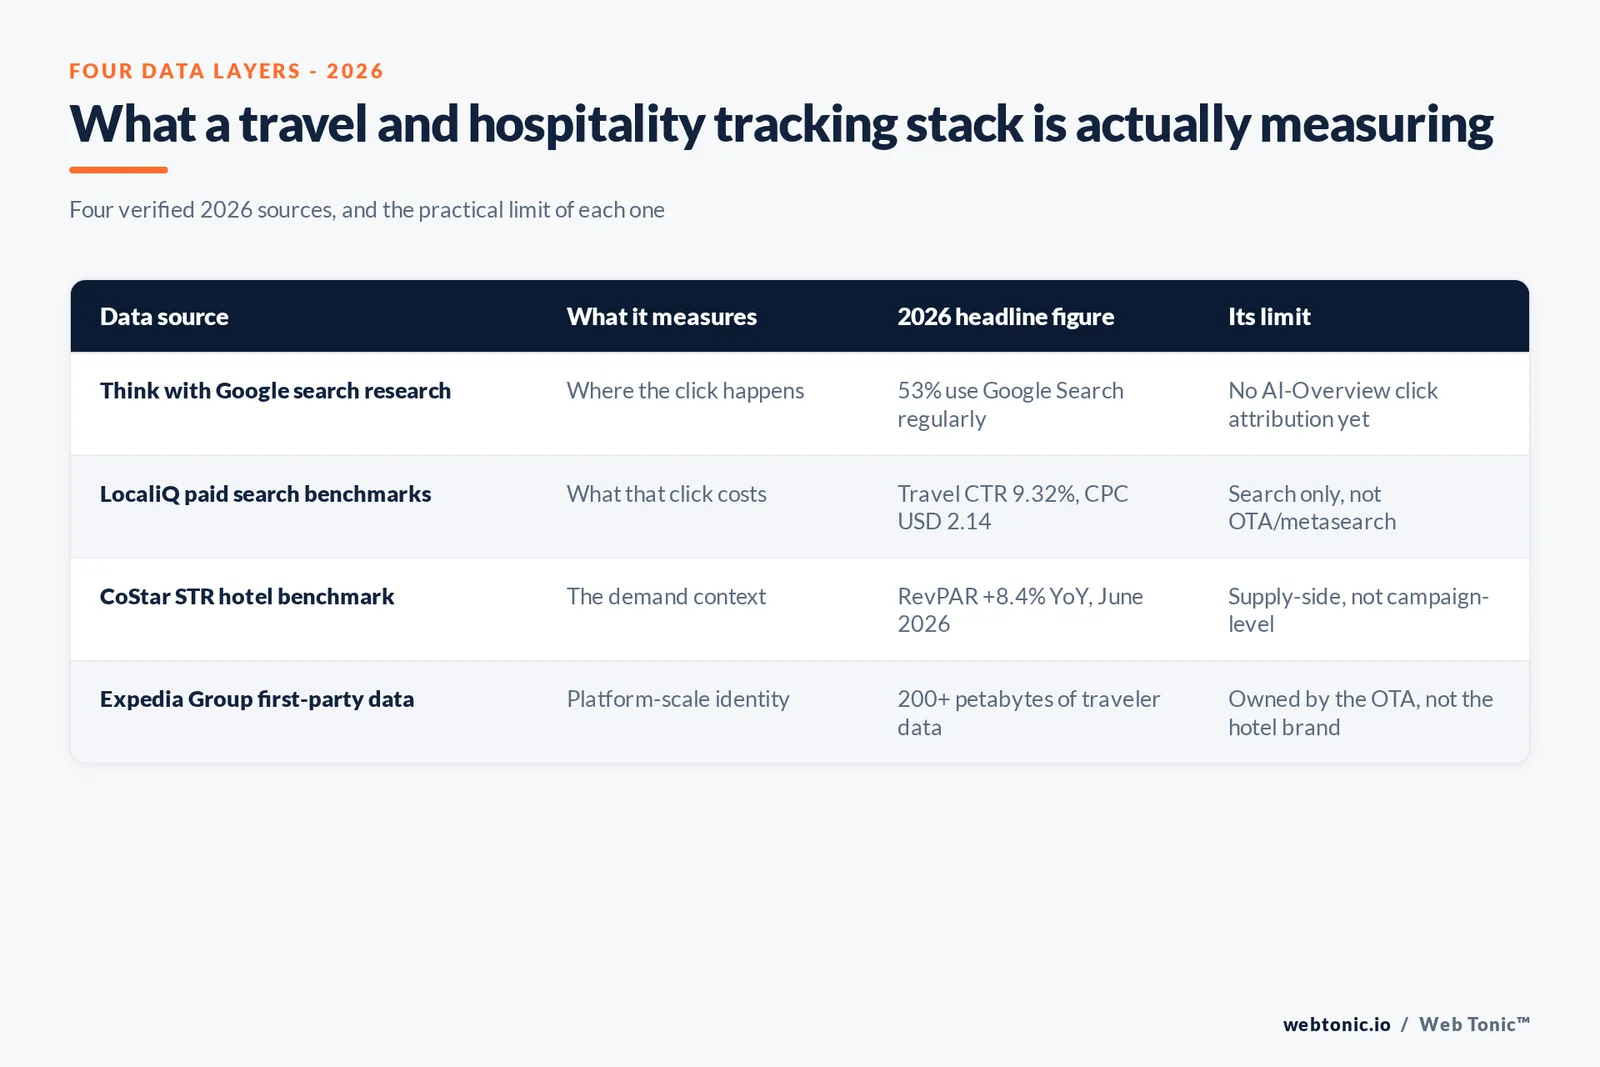
The sourced pattern across this data is consistent: search behaviour research (Think with Google) explains where the click happens, paid-search benchmarks (LocaliQ) explain what that click currently costs, supply-side data (CoStar/STR) explains the demand context the campaign is competing inside, and platform-scale first-party data (Expedia Group) explains why most hospitality brands rent measurement infrastructure rather than build it from scratch. A tracking project that starts by picking a new tool before mapping which of those four layers is actually broken tends to buy the wrong thing.
Our data and analytics practice starts by mapping which of those layers is missing before recommending a platform, and our growth marketing team uses the same CoStar-style demand signals to time hospitality budget shifts rather than spending on a flat monthly calendar.
What this means if you run marketing for a single hotel or destination brand
You will not out-collect Expedia Group's 200-plus petabytes, and you do not need to. The practical task is closing the specific gap Skift and Amperity describe: connect booking, loyalty and on-property data into one identity layer, use platform-native measurement (Google's Search+YouTube combination, OTA data-sharing products) for the demand signal you cannot replicate, and check paid-search assumptions against LocaliQ's Travel-specific benchmarks rather than a blended cross-industry number. Read our breakdown of cost per lead by industry for how Travel's USD 44.70 figure sits against other verticals, or talk to us about building the measurement layer itself.
Frequently Asked Questions
How many travellers actually use Google Search to plan a trip?
Think with Google's 2026 travel marketing research puts it at 53% of travellers who regularly use Google Search to learn about, stay informed on, or simply enjoy travel-related content - and pairing Search with YouTube campaigns drives 21% higher ROAS than all other media combined. That is the baseline any attribution model has to account for before AI Overviews are even in the picture.
Is AI search actually changing how hotels get found?
Google's own data says yes on the decision side: users of AI Overviews and AI Mode agree they can make decisions faster (77%) and more confidently (75%) because of them. What it does not yet show is a reliable click-attribution path back to a specific campaign - which is why first-party data has become the fallback measurement layer for hospitality brands.
How much first-party data does a travel platform actually have?
Expedia Group states its advertising business runs on 200-plus petabytes of first-party traveler intent and purchase data, drawn from Expedia, Hotels.com and Vrbo, and its Unpack '26 research is itself built on 24,000 survey respondents across 18 countries. Individual hotel brands and OTAs will not match that scale, which is precisely why they lean on these platforms' data-sharing products rather than rebuilding it.
Do hotel performance benchmarks like RevPAR belong in a marketing dashboard?
Yes, because they are the demand signal marketing spend has to react to. CoStar's STR benchmark reported US hotel RevPAR up 8.4% year over year in June 2026 (occupancy 69.6%, ADR US$173.76) - a marketing calendar planned against last year's demand curve without that context is planning against stale data.
What is the actual data gap most hospitality brands are working from?
Skift Research and Amperity's 2026 study of more than 350 senior travel leaders frames it as an execution gap, not a data-collection gap: brands say they already collect fragmented guest data across booking, loyalty and on-property systems, but few have turned it into real-time personalization at the point of a decision. The bottleneck is integration, not volume.
Sources
Think with Google - AI in travel marketing: winning the new era of Search (2026)
Think with Google - From Search to solve: how AI is powering the travel industry
LocaliQ - Search Advertising Benchmarks for Every Industry (2026 data)
CoStar - U.S. hotel performance for June 2026 (STR benchmark)
CoStar - U.S. hotel results for week ending 19 September 2026 (STR benchmark)
Phocuswright - Travel Forward: Data, Insights and Trends for 2026
Expedia Group - Unpack '26 travel trends research
Expedia Group - investor news on advertising business growth (2026)
Skift Research with Amperity - Personalizing the Travel Experience Using Data and AI
Think with Google - Hilton Worldwide Drives 12% Higher ROI With Google Hotel Ads (case study)