



Table of contents
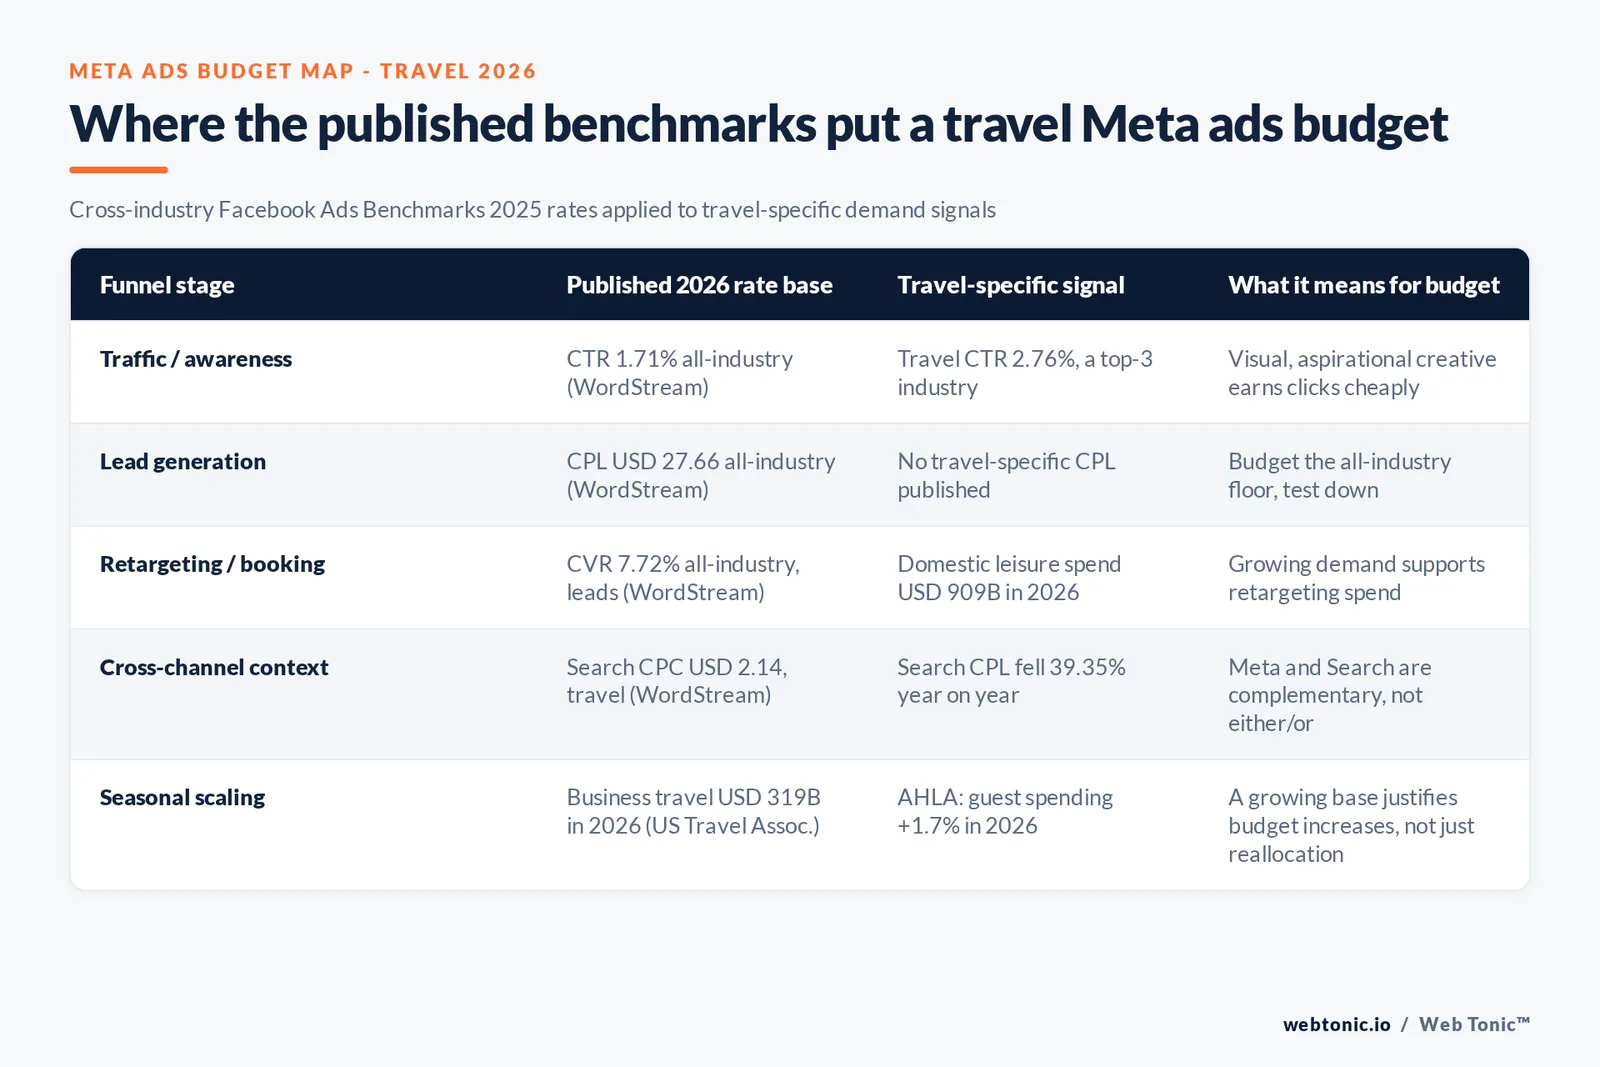
No study publishes a travel-specific cost per click or cost per lead for Meta Ads, so this page builds a 2026 budget from the all-industry Facebook Ads benchmark plus the one number that is travel-specific: an above-average click-through rate. It then sizes that budget against how much travel demand is actually forecast to grow in 2026.
Key Takeaways
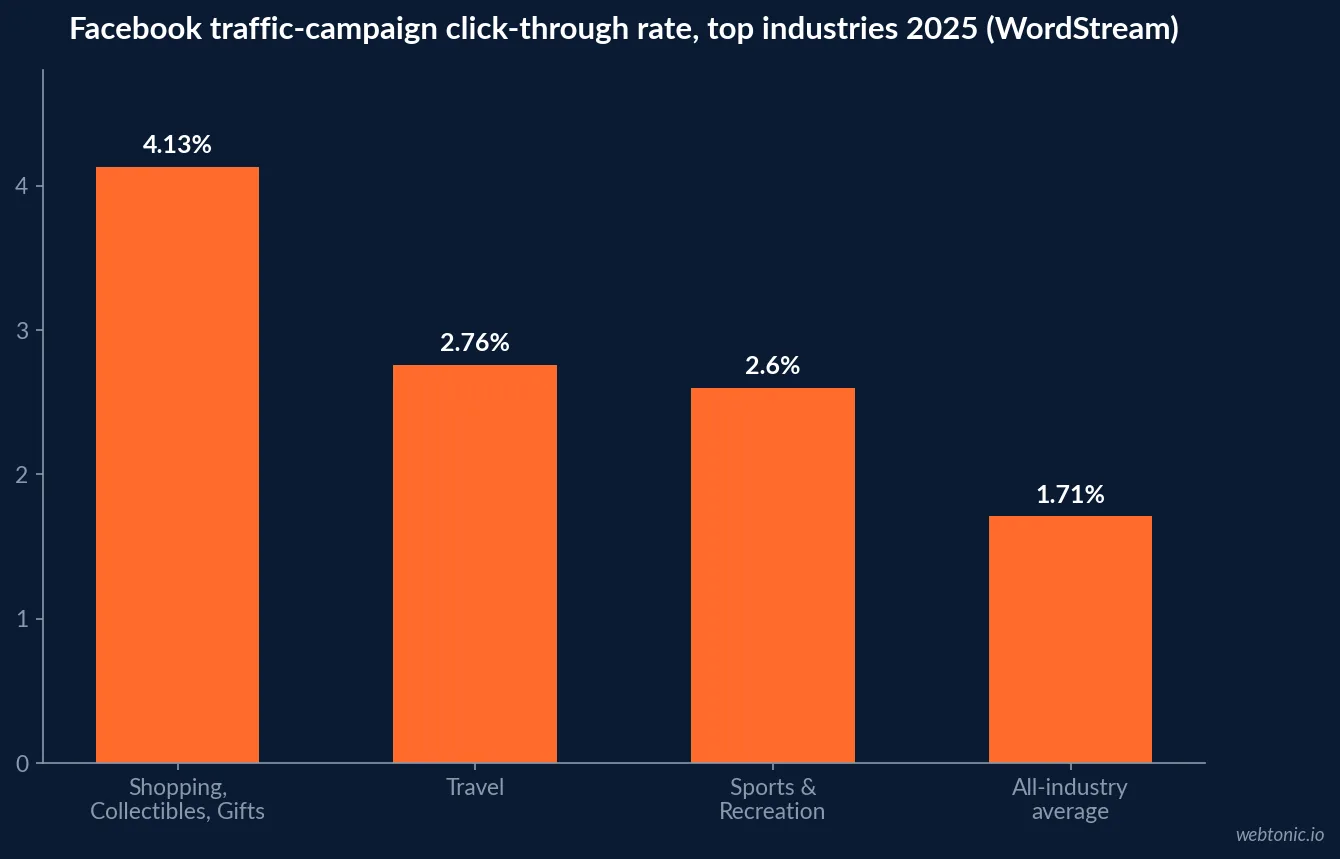
- Travel's Facebook traffic-campaign CTR is 2.76%, the second highest of any tracked industry.
- The all-industry traffic CTR is 1.71%, up from 1.58% a year earlier.
- All-industry lead-campaign CPC is USD 1.92, up 2% year over year.
- All-industry lead-campaign conversion rate is 7.72%, down from 8.67%.
- All-industry lead-campaign cost per lead is USD 27.66, up from USD 22.87.
- No travel row appears in WordStream's CPC, CVR or CPL breakouts — only CTR.
- Travel search CPC is USD 2.14 on Google Ads, the third lowest of 23 industries.
- Travel search CTR is 9.82%, the second highest of any industry.
- Travel search cost per lead fell 39.35% year over year, the steepest drop tracked.
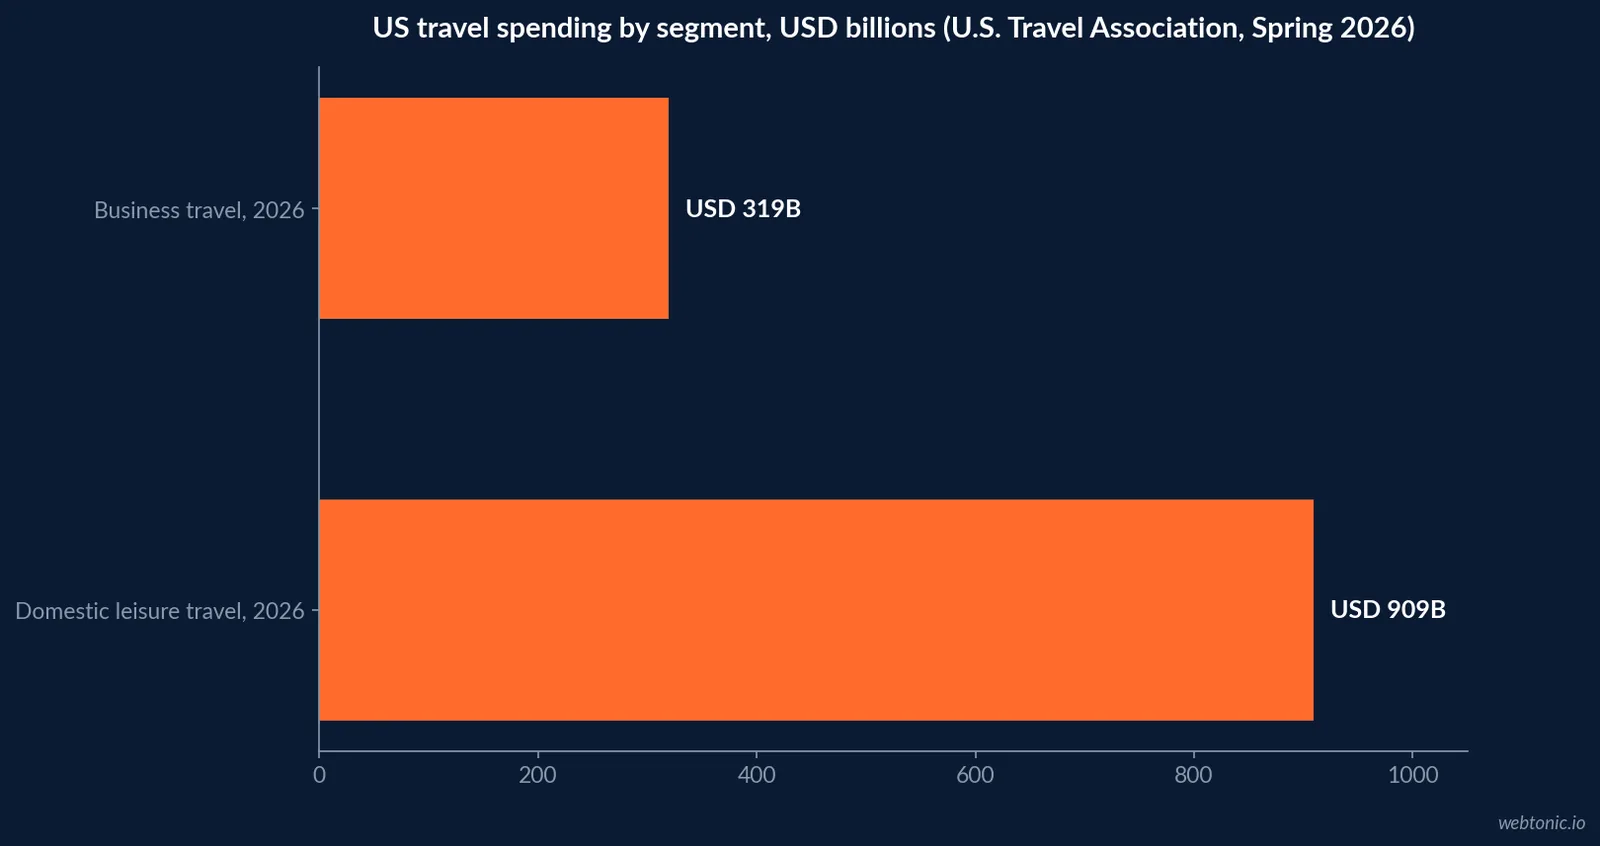
- US domestic leisure travel spending is forecast at USD 909 billion in 2026.
- US business travel spending is forecast at USD 319 billion in 2026.
- AHLA expects hotel guest spending near USD 805 billion in 2026, up 1.7%.
- Hotels paid nearly USD 128 billion in wages and benefits in 2025, rising toward USD 131 billion.
- Expedia's Unpack '26 research surveyed 24,000 travelers across 18 countries.
- Facebook lead ads still cost less than comparable Google lead ads, per WordStream.
- The hotel workforce is projected to grow by more than 30,000 jobs in 2026.
- Shopping, Collectibles and Gifts leads all industries at a 4.13% traffic CTR.
- Automotive repair sits at the bottom of the CTR table at 0.80%, the opposite of travel's pattern.
Why there is no travel line item in the Meta Ads benchmark tables
WordStream's 2025 Facebook Ads Benchmarks report, built from 1,180 campaigns running between April 2024 and June 2025, breaks results out into 22 industries for traffic campaigns and 14 for lead campaigns. Travel appears in exactly one table: click-through rate. It does not appear in the cost-per-click, conversion-rate or cost-per-lead breakouts published in that report, which list industries such as dentists, attorneys and restaurants instead.
That gap is the honest starting point for this page. A travel marketer cannot look up a travel-specific Meta CPL the way a dentist can. The workable substitute is the all-industry benchmark, adjusted for the one signal that is travel-specific.
| Facebook Ads metric (2025, all-industry) | Published figure | Year-over-year | Source |
|---|---|---|---|
| Traffic CTR, all industries | 1.71% | Up from 1.58% | WordStream |
| Lead CPC, all industries | USD 1.92 | Up from USD 1.88 | WordStream |
| Lead conversion rate, all industries | 7.72% | Down from 8.67% | WordStream |
| Lead cost per lead, all industries | USD 27.66 | Up from USD 22.87 | WordStream |
| Travel traffic CTR (the one travel row) | 2.76% | Not broken out YoY | WordStream |
What the one travel data point actually says
WordStream's own explanation for travel's above-average CTR is worth repeating rather than paraphrasing: industries with the highest click-through rates, including travel, tend to sell what the report calls "anytime treats" — categories a browsing user does not need to be actively shopping for to engage with. Contrast that with the lowest-CTR industries, automotive repair (0.80%) and finance and insurance (0.98%), where only in-market users click at all.
The practical read for a 2026 media plan: travel creative earns clicks on curiosity and aspiration, not just active purchase intent. That argues for keeping a meaningful share of Meta spend in upper-funnel, visually led traffic and reach objectives rather than pushing every dollar into narrow lead-form targeting.
| What travel shares with top-CTR industries | What separates it from bottom-CTR industries |
|---|---|
| Aspirational, visual product (a destination, an experience) | Automotive repair and finance need active intent to get a click |
| Browsable without an immediate purchase trigger | Physicians and surgeons rank third lowest at 0.83% CTR |
| A CTR nearly 40% above the trans-industry benchmark | The lowest-CTR industries sit near a third of travel's rate |
Sizing the budget against 2026 demand, not last year's spend
The case for growing rather than freezing a Meta Ads budget rests on demand data, not ad-platform data. The U.S. Travel Association's Spring 2026 forecast puts domestic leisure travel spending at USD 909 billion in 2026, a 0.9% increase, with business travel spending forecast at USD 319 billion, up 0.7% in real terms. Separately, AHLA's 2026 State of the Industry report expects hotel guest spending to reach nearly USD 805 billion in 2026, up 1.7% over 2025, alongside a hotel workforce projected to grow by more than 30,000 jobs.
None of those figures come from an ad platform, and none should be quoted as a media-buying benchmark. What they establish is that the addressable market a travel Meta campaign sells into is still growing, which is the argument for protecting or expanding budget rather than assuming the category is saturated.
| 2026 demand indicator | Figure | Change | Source |
|---|---|---|---|
| Domestic leisure travel spending | USD 909 billion | +0.9% | U.S. Travel Association |
| Business travel spending | USD 319 billion | +0.7% real terms | U.S. Travel Association |
| Hotel guest spending | ~USD 805 billion | +1.7% | AHLA 2026 State of the Industry |
| Hotel wages and benefits | ~USD 131 billion (2026 est.) | Up from USD 128 billion in 2025 | AHLA |
| Hotel workforce growth | +30,000 jobs | To ~2.2 million direct jobs | AHLA |
The cross-channel comparison a travel budget should not skip
WordStream's separate 2026 Google Ads Benchmarks report, built from over 13,000 search campaigns, shows travel search click-through rate at 9.82% — second only to Arts and Entertainment — cost per click at USD 2.14, among the three lowest of 23 industries, and cost per lead down 39.35% year over year, the steepest cost decline the report tracks across any industry.
Read alongside the Meta numbers, the pattern is that both channels got structurally cheaper or more efficient for travel through the benchmark period. That argues against an either/or media plan: Meta's job is the above-average click on an aspirational, not-yet-searching audience; Search's job is capturing the demand that is already typing destination and date queries at a falling cost per lead.
| Channel | Cost metric | 2026 figure | Efficiency signal | Source |
|---|---|---|---|---|
| Meta Ads (traffic) | CTR | 2.76% (travel) | Above the 1.71% all-industry floor | WordStream Facebook Benchmarks |
| Meta Ads (leads, all-industry) | CPL | USD 27.66 | Rose from USD 22.87 YoY | WordStream Facebook Benchmarks |
| Google Search (travel) | CPC | USD 2.14 | Third lowest of 23 industries | WordStream Google Ads Benchmarks |
| Google Search (travel) | CTR | 9.82% | Second highest of 23 industries | WordStream Google Ads Benchmarks |
| Google Search (travel) | CPL change | Down 39.35% YoY | Steepest decline of any tracked industry | WordStream Google Ads Benchmarks |
Where Expedia's own research should inform creative, not cost
Cost benchmarks answer how much a click or a lead costs; they say nothing about what to put in the ad. Expedia Group's Unpack '26 research is proprietary first-party data from Expedia, Hotels.com and Vrbo layered with a global OnePoll consumer survey of roughly 24,000 respondents across 18 countries. It is a demand-signal source, not a cost source, and belongs in the creative brief, not the media plan spreadsheet.
Treating cost data and demand data as two separate inputs — one from WordStream and the Google/Meta benchmark reports, the other from Expedia's own first-party research — avoids the common budgeting mistake of asking a CTR table to also tell you which destination theme to feature.
A simple way to phase a 2026 travel Meta budget
Given the one travel-specific figure available (a 2.76% traffic CTR, roughly 60% above the all-industry floor) and rising cross-channel demand, a defensible phasing keeps a larger share in upper-funnel traffic and reach objectives than the all-industry lead-focused default, then adds lead and retargeting spend as the booking window narrows. This is a planning framework, not a published benchmark — treat it as a starting allocation to test against your own account, not a rate to expect out of the box.
| Booking-window stage | Suggested objective emphasis | Rationale |
|---|---|---|
| 90+ days out | Reach and traffic, visual creative | Travel's above-average CTR rewards top-of-funnel scroll-stopping |
| 30-90 days out | Traffic plus early retargeting | Search CPL falling 39.35% YoY suggests demand is already active |
| 7-30 days out | Lead and conversion objectives | All-industry CPL of USD 27.66 is the honest floor to budget against |
| Under 7 days | Retargeting, urgency-led creative | Booking-window compression favors direct-response creative |
What Google's own research adds to the media mix decision
Google's own Think with Google research reports that 53% of travellers regularly use Google Search to learn about or stay informed on travel content, and that running Search and YouTube campaigns together drives 21% higher ROAS than all other media combined. That is a Search-plus-video finding, not a Meta finding, but it is directly relevant to a 2026 budget conversation: it argues the choice a travel marketer actually faces is rarely Meta versus Search, it is how much of a limited budget goes to upper-funnel visual reach (where Meta and YouTube both compete) versus bottom-funnel search capture.
Separately, the U.S. Travel Association's own Spring 2026 forecast confirms the same record USD 1.37 trillion 2026 spending figure cited above, and CoStar's STR benchmarking arm has separately raised its year-end 2026 RevPAR growth projection to +4.4%, evidence that the demand backdrop firmed up as the year progressed rather than weakening.
| Additional 2026 signal | Figure | Source |
|---|---|---|
| Travellers who regularly use Google Search for travel content | 53% | Google (Think with Google) |
| ROAS lift from combining Google Search and YouTube | 21% higher | Google (Think with Google) |
| STR's revised year-end RevPAR growth projection | +4.4% | CoStar / STR, August 2026 |
What to do next
Start from the all-industry Facebook lead benchmark (CPC USD 1.92, CVR 7.72%, CPL USD 27.66), expect travel's CTR to run above that floor rather than below it, and pair Meta budget with a Search line rather than choosing one channel. Our performance creative team can build the visual-first creative that above-average CTR category rewards, and our breakdown of when Facebook ads are worth the spend covers the ROI side of this same decision. When you are ready to size an actual campaign, talk to our team.
Frequently Asked Questions
How much should a travel business budget for Meta Ads in 2026?
There is no published travel-specific cost-per-lead or cost-per-click figure for Meta Ads, so the honest starting point is the all-industry Facebook Ads benchmark: WordStream puts lead-campaign cost per click at USD 1.92, conversion rate at 7.72% and cost per lead at USD 27.66 across 1,180 campaigns. Layer on the fact that travel already earns an above-average 2.76% click-through rate on traffic campaigns, and a reasonable starting budget assumes travel performs at or slightly better than that floor, not worse.
Why does travel get a higher click-through rate than most industries?
WordStream's 2025 Facebook Ads Benchmarks report puts travel's traffic-campaign CTR at 2.76%, the second highest of the industries it tracks after Shopping, Collectibles and Gifts (4.13%), and well above the 1.71% all-industry average. The report's own explanation is that travel is an 'anytime treat' category: people do not need to be actively booking to stop and engage with an aspirational destination ad, unlike categories such as automotive repair where only in-market users click.
Should the extra budget go to Meta or to Google Search?
Both, but the WordStream data suggests a split rationale. Its 2026 Google Ads Benchmarks report shows travel search cost per click at USD 2.14 and cost per lead falling 39.35% year over year, the steepest CPL decline of any tracked industry, meaning search got measurably cheaper. Meta's advantage is upper-funnel reach at a lower CTR cost; Search's advantage is capturing people already typing a destination or dates. A 2026 budget that only funds one channel is leaving one side of that trade on the table.
Is 2026 travel demand actually growing enough to justify a bigger ad budget?
Yes, on the U.S. Travel Association's own numbers. Its Spring 2026 forecast puts domestic leisure travel spending at USD 909 billion for 2026, up 0.9%, with business travel spending at USD 319 billion, up 0.7% in real terms. AHLA's 2026 State of the Industry report separately expects hotel guest spending to reach roughly USD 805 billion in 2026, a 1.7% rise over 2025. None of the three is a marketing statistic, but all three describe a market that is still expanding, which is the precondition for a marketing budget increase rather than a cut.
What creative should the Meta budget actually buy?
WordStream's finding that travel is an 'anytime treat' category is itself a creative brief: the ad does not need to catch someone mid-search, it needs to be visually strong enough to interrupt a scroll and plant a destination idea. Expedia Group's Unpack '26 research, drawn from first-party Expedia, Hotels.com and Vrbo data across a 24,000-respondent global survey, is the better source for which destination and trip themes are trending this year, since Meta's own benchmarks report stops at cost and click metrics.
Sources
WordStream - Facebook Ads Benchmarks 2025
WordStream - Google Ads Benchmarks 2026
WordStream - Google Ads industry benchmarks (2026)
U.S. Travel Association - U.S. Travel Forecast, Spring 2026
U.S. Travel Association - Spring 2026 Forecast (PDF)
American Hotel & Lodging Association - 2026 State of the Industry
Expedia Group - Unpack '26 travel trends research
Google (Think with Google) - AI in travel marketing: winning the new era of Search
CoStar / STR - U.S. Hotel Forecast Assumptions, August 2026
Web Tonic - Are Facebook Ads worth it? ROI analysis


