



Table of contents
68.9% of Webflow sites pass mobile Core Web Vitals against 49.3% of WordPress sites, and each extra second of mobile load costs an HVAC site roughly 7% of its conversions. For a heating and ventilation contractor those two facts decide how many booked calls a fixed ad budget produces. Here is the 2026 platform data, applied to the trade.
Key Takeaways
- Webflow passes mobile CWV at 68.9% vs WordPress 49.3% (Chrome field data, May 2026).
- Good mobile TTFB: Webflow 55.5% vs WordPress 24.8% — a hosting-quality gap.
- Median mobile LCP 2.4s vs 3.2s in favour of Webflow.
- HVAC sites convert at ~7.8% to lead; phone leads close near 46%.
- Each extra second of mobile load = ~7% fewer HVAC conversions; 5s costs 35%.
- 70%-78% of HVAC searches are mobile, so mobile CWV is the only benchmark.
- Webflow runs 822,000+ live sites, 0.8% of the web but 4.2% of the top 1,000.
- With $104 blended CPL and $15,340 lifetime value, CRO beats buying more clicks.
1. Platform Performance in Field Data
Chrome real-user data via HTTP Archive, May 2026 is the only comparison that matters, because lab scores do not reflect the phones and networks homeowners actually use.
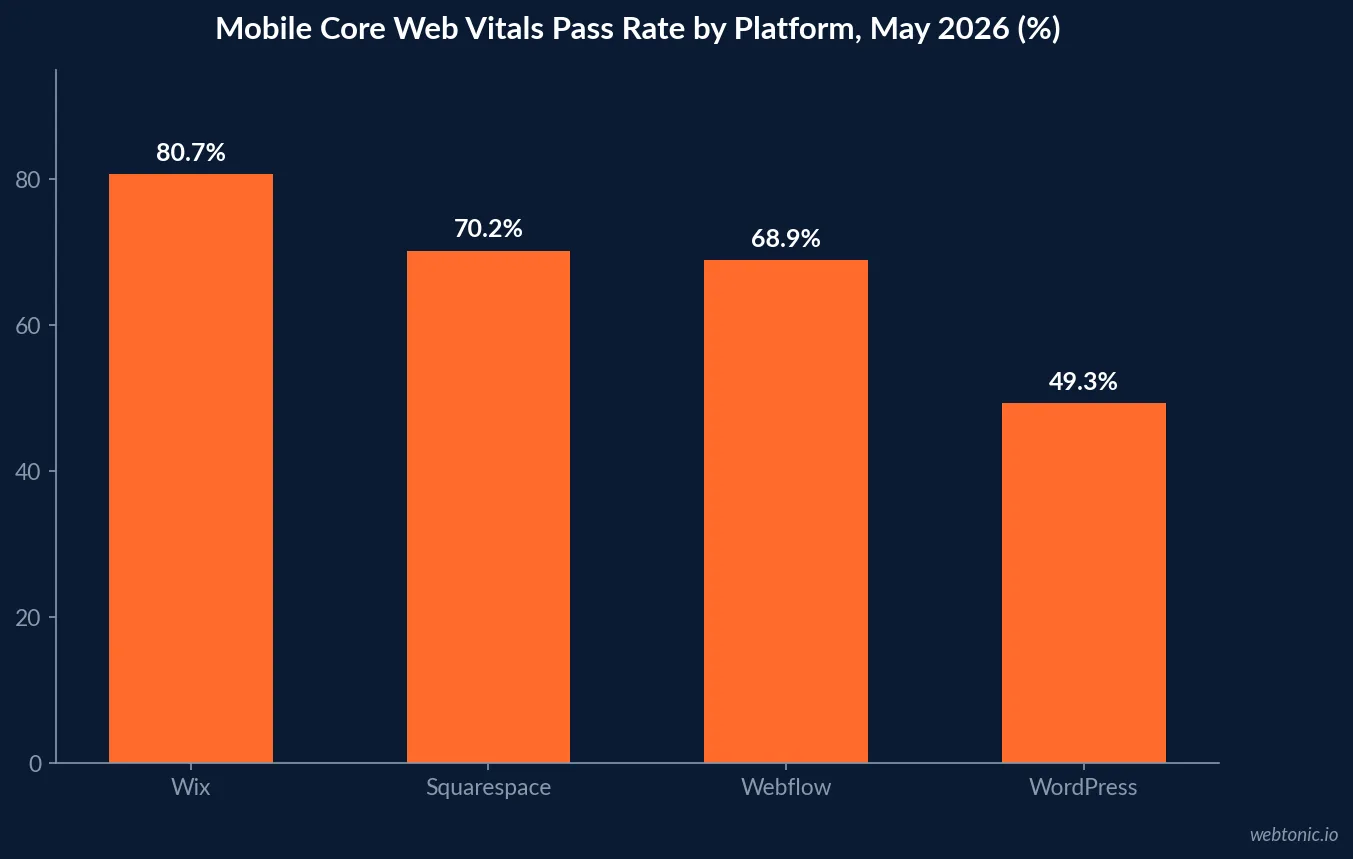
| Platform | Mobile CWV pass | Good mobile TTFB | Note |
|---|---|---|---|
| Wix | 80.7% | 66.9% | Strongest image CDN defaults |
| Squarespace | 70.2% | 80.8% | Best server response |
| Webflow | 68.9% | 55.5% | Clean output, heavy JS payloads |
| WordPress | 49.3% | 24.8% | Hosting quality varies enormously |
The mechanism behind the WordPress number is not the software — it is deployment. Only 24.8% of WordPress origins reach good mobile TTFB in the field, because the platform runs on everything from $3 shared hosting to enterprise infrastructure, and LCP is almost entirely hosting-dependent. On managed hosting at $25 to $200 per month, WordPress performance matches or beats Webflow. On a cheap plan it does not come close. Webflow’s advantage is that a contractor cannot accidentally choose bad hosting.
2. Where Webflow Gives Ground
The same dataset is not a clean win. Webflow ships heavier JavaScript and, notably, no AVIF support in its default image pipeline.
| Asset metric | Webflow | WordPress | Squarespace |
|---|---|---|---|
| Median JS payload | 918KB | 692KB | 1,571KB |
| Median image weight | 855KB | 1,029KB | 1,111KB |
| AVIF support | No | Via plugins | No |
| Lottie animation weight | 200KB-2MB | Plugin-dependent | Limited |
| Platform cost (annual) | $228-$588 | $0-$2,400+ | $300-$2,400 |
| Speed ceiling (achievable LCP) | sub-2.0s | sub-1.8s (tuned) | sub-3.0s |
For an HVAC site that means the platform gets you to a good baseline and then the build discipline decides the outcome. Images and media typically account for 40% to 70% of total page weight, and compression alone delivers a 30% to 60% page-weight reduction on any platform. A Webflow site stuffed with uncompressed hero photography of rooftop units and a full-screen Lottie animation will lose to a well-built WordPress site every time. Independent CMS tracking reports the same rank ordering with different absolute values, and Web Almanac 2026 analysis puts the whole mobile web at 49.2% passing, up from 41.7% — so the bar is rising for everyone.
3. The HVAC Conversion Spectrum
HVAC-specific conversion research gives the benchmark that should govern any website decision in this trade.
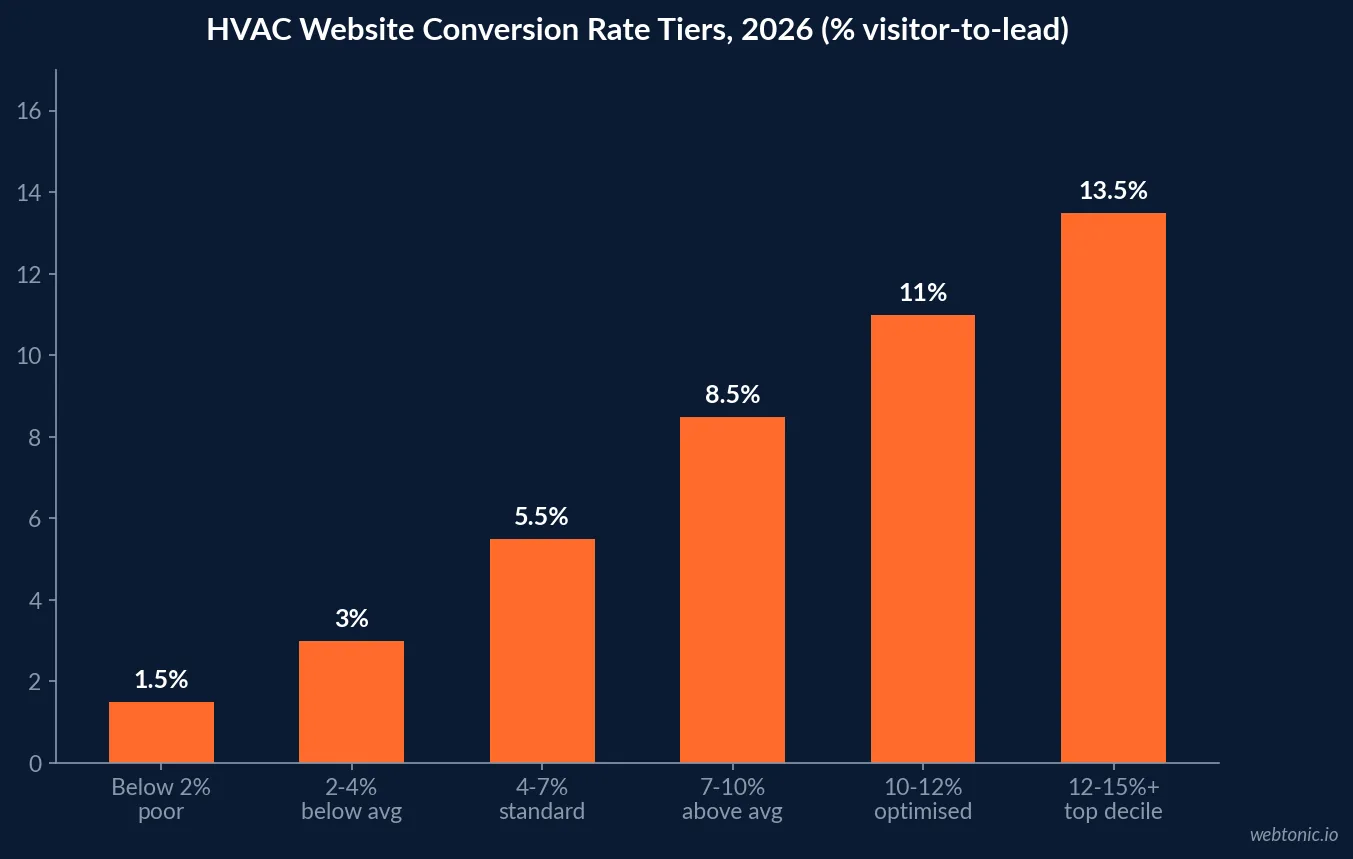
| Conversion rate | Tier | Typical cause |
|---|---|---|
| Below 2% | Poor | Generic pages, slow mobile, buried phone number |
| 2%-4% | Below average | Weak trust signals, long forms |
| 4%-7% | Standard | Reasonable mobile UX, no testing |
| 7%-10% | Above average | Service-page architecture, sticky tap-to-call |
| 10%-12% | Well-optimised | Speed-optimised, schema deployed, low-friction forms |
| 12%-15%+ | Top decile | Source-specific landing pages, sub-2s mobile, A/B tested |
Most operators sit between 2% and 5%. Benchmark data from $14.9M in HVAC ad spend across 816 contractors places the average website-to-lead rate at 7.8%, with blended Google Ads CPL at $104 ($149 non-branded, $72 Performance Max), customer lifetime value averaging $15,340 and net margins near 8%. Their conclusion is the important one: the leak is conversion, not ad spend.
4. Page Speed in Booked Calls
| Speed finding | Effect | Context |
|---|---|---|
| Each +1 second mobile load | ~7% fewer conversions | HVAC-specific measurement |
| 5-second mobile load | −35% of conversions | Lost before content is read |
| Load 1s → 3s | Bounce probability +32% | Google research |
| Speed remediation alone | +20%-40% conversion | Before any design change |
| Mobile LCP target | Under 2.5 seconds | Core Web Vitals threshold |
| Documented rebuild 4.2s → 1.4s | +45% phone leads | Migration case data |
Because 70% to 78% of HVAC searches happen on mobile, desktop scores are close to irrelevant. And the conversion action being protected is a phone tap, not a checkout: phone leads close near 46% against 7.8% for form submissions in this trade, and callers close at about 40% versus 20% for form leads on emergency pages. A layout shift that moves the call button, or a hero image that delays LCP past three seconds, is losing the highest-value action on the site. The technical detail behind those metrics sits in our HVAC technical SEO statistics.
5. Design Decisions With Measured Effects
Contractor website research and CRO analysis converge on a short list of changes that reliably move lead volume.
| Element | Data-backed setting | Measured effect |
|---|---|---|
| Sticky tap-to-call bar (mobile) | Persistent, tel: link | +20%-40% mobile conversion |
| Phone number only in header | Scrolls out of view | −20%-40% conversion |
| Form field count | 3-4 maximum | Each extra field −~10% submissions |
| Button vs text-link CTA | Solid button | Text links underperform 15%-30% |
| Tap target size | 44-48px minimum | Thumb-reachable |
| Phone-primary CTA | Emergency pages | 40% caller close vs 20% form |
| Form-primary CTA | Heat pump / replacement pages | Planned-purchase research intent |
| Call tracking | CallRail / WhatConverts | ROI 5-20x a $50-$300/mo cost |
Note the CTA split, because it is the most commonly botched decision in the trade. Emergency no-heat and no-cool pages should push the phone; heat pump, full-system replacement and financing pages should push a form, because those visitors are researching at a desk and are not ready to talk to a salesperson. Building both patterns as reusable components is exactly the kind of work a visual CMS makes cheap, and it is where a Webflow build pays back — city and service pages ship without developer time.
6. Webflow Adoption and Stability
Platform usage data answers the reasonable question of whether a contractor should trust a niche platform with their primary lead source.
| Adoption metric | Figure | Trend |
|---|---|---|
| Live Webflow sites | 822,550 | From 544,053 two years earlier |
| Share of all websites | 0.8% | 1.2% of CMS-driven sites |
| Share of world’s top 1,000 sites | 4.2% | 3x its overall share |
| Revenue (2024) | $213M | +66% year over year |
| Valuation | $4B | $334.9M raised |
| Employees | 1,292 | Enterprise motion |
| E-commerce sites on platform | 12,501 stores | +647% growth |
| Largest markets | US 160,696 | UK 14,891, DE 14,510 |
The 4.2% share of the top 1,000 websites against 0.8% overall is the most useful signal here: sites that scale successfully are disproportionately on Webflow, which argues against the “toy platform” objection. WordPress remains dominant at roughly 60% of CMS-driven sites, and builder market-share tracking confirms the long tail is consolidating rather than fragmenting.
7. The SEO Question, Settled
The persistent worry that Webflow cannot rank is not supported by the evidence. Platform SEO comparison and a second independent analysis reach the same conclusion from different angles.
| SEO factor | Webflow | WordPress |
|---|---|---|
| Core Web Vitals pass (study figure) | 58% | 42% |
| Clean semantic output | Default | Theme-dependent |
| Structured data | Manual / custom code | Plugin ecosystem |
| Plugin vulnerability exposure | None | 91% of vulns are in plugins |
| Programmatic page generation | CMS collections | Custom development |
| Content team autonomy | High (visual editor) | High (editor) |
| Migration risk | Redirect mapping required | N/A |
The security asymmetry deserves attention for a lead-generating business: 91% of WordPress vulnerabilities live in plugins rather than core, and WordPress core recorded only 6 vulnerabilities in the reference period. A contractor site running fifteen plugins is carrying real risk on the asset that produces their phone calls. Webflow removes that surface entirely at the cost of some extensibility.
8. Replatforming Arithmetic
| Scenario | Before | After | Effect on leads |
|---|---|---|---|
| Conversion rate 3% → 7% | 3% | 7% | 2.3x lead volume, same spend |
| Mobile load 4.2s → 1.4s | 4.2s | 1.4s | +45% phone leads (documented) |
| Speed remediation only | 5s+ load | Under 2.5s | +20%-40% conversion |
| Blended CPL at 3% CVR | $104 | — | Baseline |
| Effective CPL at 7% CVR | — | ~$45 | Same media, better site |
| Value per closed customer | $15,340 LTV | — | ~147x lead cost |
That is the whole business case. A contractor spending $8,000 a month on Google Ads at a 3% site conversion rate is buying roughly half the leads a 7% site would produce from the same budget — and the CRO work is a one-time cost while the media spend recurs monthly. Migration is not risk-free: redirect mapping is the failure point, and documented moves involving 150+ redirects held rankings only because they were mapped before launch. The measurement side of that transition sits in our data intelligence work, and the traffic side in growth marketing.
9. What Top HVAC Sites Actually Do Differently
Design review of high-performing contractor sites shows a consistent pattern that has little to do with aesthetics.
| Pattern | Implementation | Why it works |
|---|---|---|
| Dedicated service pages | One per service, per city | Matches query intent, lifts relevance |
| Sticky mobile call bar | Always visible | Protects the 46%-closing action |
| Contextual review proof | Reviews on the matching service page | Trust at decision point |
| Financing visibility | Above the fold on replacement pages | $5,000-$12,000 ticket friction |
| Emergency triage path | Distinct from planned-purchase path | Different CTA, different urgency |
| Source-specific landing pages | Paid traffic never hits the homepage | Top-decile tier requirement |
| Schema on service and FAQ pages | LocalBusiness, Service, FAQPage | Rich results and AI citation |
None of that requires a platform change on its own — but all of it requires a content team able to ship pages without a developer, which is the practical reason contractors end up on a visual CMS. Pair it with the copy and offer decisions in our HVAC landing page statistics.
10. Recommendations
- Judge the platform on mobile field data. Webflow 68.9% vs WordPress 49.3% on defaults.
- Fix speed before buying more clicks. Remediation alone returns 20%-40% conversion.
- Target sub-2.5s mobile LCP. Every second costs ~7% of HVAC conversions.
- Compress images ruthlessly. Media is 40%-70% of page weight; Webflow has no AVIF.
- Make the phone sticky. +20%-40% mobile conversion; phone leads close near 46%.
- Cut forms to 3-4 fields. Each extra field costs ~10% of submissions.
- Split emergency and replacement journeys. Phone-first versus form-first.
- Instrument call tracking. 5-20x ROI on a $50-$300 monthly cost.
The 2026 summary for heating and ventilation: platform choice buys a better starting line — a 19-point mobile Core Web Vitals advantage over default WordPress — but the money is made in the conversion layer, where most contractors sit at 2% to 5% against a 12%-plus top decile. With a $104 blended cost per lead and a $15,340 lifetime value, doubling site conversion is the cheapest growth available in this trade. Compare the channel economics in our HVAC digital marketing statistics, or bring the site to our team for an audit.
Frequently Asked Questions
Is Webflow faster than WordPress for an HVAC website?
On defaults, yes, and the field data is consistent. Chrome real-user data from May 2026 shows 68.9% of Webflow origins passing all three Core Web Vitals on mobile against 49.3% for WordPress, with good mobile TTFB at 55.5% versus 24.8%. Median mobile LCP is roughly 2.4 seconds on Webflow against 3.2 seconds on WordPress. The gap is mostly hosting: Webflow ships one managed stack with a built-in CDN, while WordPress performance ranges from excellent on managed hosting to poor on $5 shared plans.
What conversion rate should an HVAC website achieve?
Benchmark data across 816 contractors and $14.9M in ad spend puts the average website-to-lead rate at about 7.8%, while inbound phone leads close near 46%. The CRO spectrum for the trade runs 1% to 2% poor, 4% to 7% standard, 7% to 10% above average, 10% to 12% well-optimised and 12% to 15% or higher for the top decile. Most operators sit between 2% and 5%, which means the constraint is usually the website, not the ad account.
How much does page speed affect HVAC lead volume?
Each additional second of mobile load time reduces HVAC conversions by roughly 7%, and a five-second mobile load costs about 35% of conversions before the visitor reads anything. Since 70% to 78% of HVAC searches happen on mobile, the practical target is a Largest Contentful Paint under 2.5 seconds. Documented rebuilds that took mobile load from 4.2 seconds to 1.4 seconds lifted phone leads by about 45%, and speed remediation alone typically produces a 20% to 40% conversion lift.
Is Webflow's market share large enough to trust for a business site?
It is small but growing and structurally stable. Webflow powers roughly 0.8% of all websites and about 1.2% of CMS-driven sites, with more than 822,000 live sites, up from 544,000 two years earlier. Among the world's top 1,000 websites its share is about 4.2%, more than three times its overall share, which suggests the platform performs well when properly implemented. Revenue reached $213M in 2024, up 66%, at a $4B valuation.
When does replatforming an HVAC site to Webflow pay for itself?
When the current site is the bottleneck rather than the traffic. If mobile load exceeds four seconds, the conversion rate sits under 4%, phone numbers are not sticky tap-to-call, and city or service pages cannot be produced without a developer, the arithmetic is favourable: moving from a 3% to a 7% conversion rate doubles lead volume on identical media spend. With a $104 blended cost per lead and a $15,340 average customer lifetime value, that is a far cheaper gain than buying more clicks.
Sources
PageSpeed Matters — WordPress vs Webflow vs Squarespace CWV 2026
CoreWebVitals.io — State of CWV by CMS
Pravin Kumar — Web Almanac 2026 Findings for Webflow Audits
The Alien Design — Webflow Usage Statistics
The Stacc — WordPress vs Webflow SEO
Social Animal — WordPress vs Webflow SEO
Colorlib — Website Builder Market Share
Astra Results — HVAC Website CRO, June 2026
Baadigi — HVAC Benchmarks 2026 (SearchLight data)
PipelineOn — HVAC Website Guide
PxlPeak — Best HVAC Website Designs 2026


