



Table of contents
Measure a growth advisory the way you would measure a capital project: decision quality first, leading indicators next, revenue last. Judging marketing strategy consulting on this month's revenue is how good work gets cancelled early.
Key Takeaways
- Set the measurement frame before the engagement starts. Three layers — decisions made, leading indicators, business outcome — each with its own clock.
- Layer one is binary and immediate: is there a documented ICP, an agreed value proposition, a pricing policy, a funded channel plan and a metric tree? Only 4% of executives say their value proposition is strong and consistently understood.
- Layer two moves inside the quarter: win rate on fit accounts, pipeline coverage against the 3:1 operator benchmark, cost per qualified opportunity, and the share of pipeline outside the ICP (median 31% in B2B SaaS).
- Layer three is revenue efficiency: growth per commercial dollar (leaders earn $0.71 vs $0.54 market), CAC ratio (median $2.00 per $1.00 of new ARR) and payback (14 vs 26 months on and off ICP).
- Pricing changes report fastest: a 1% price improvement is worth about 8.7% of operating profit, visible on the next cohort of deals.
- Instrument first or you will argue about attribution instead of results — only 35% of CEOs say they have the data for confident go-to-market decisions.
Why measurement has to be agreed up front
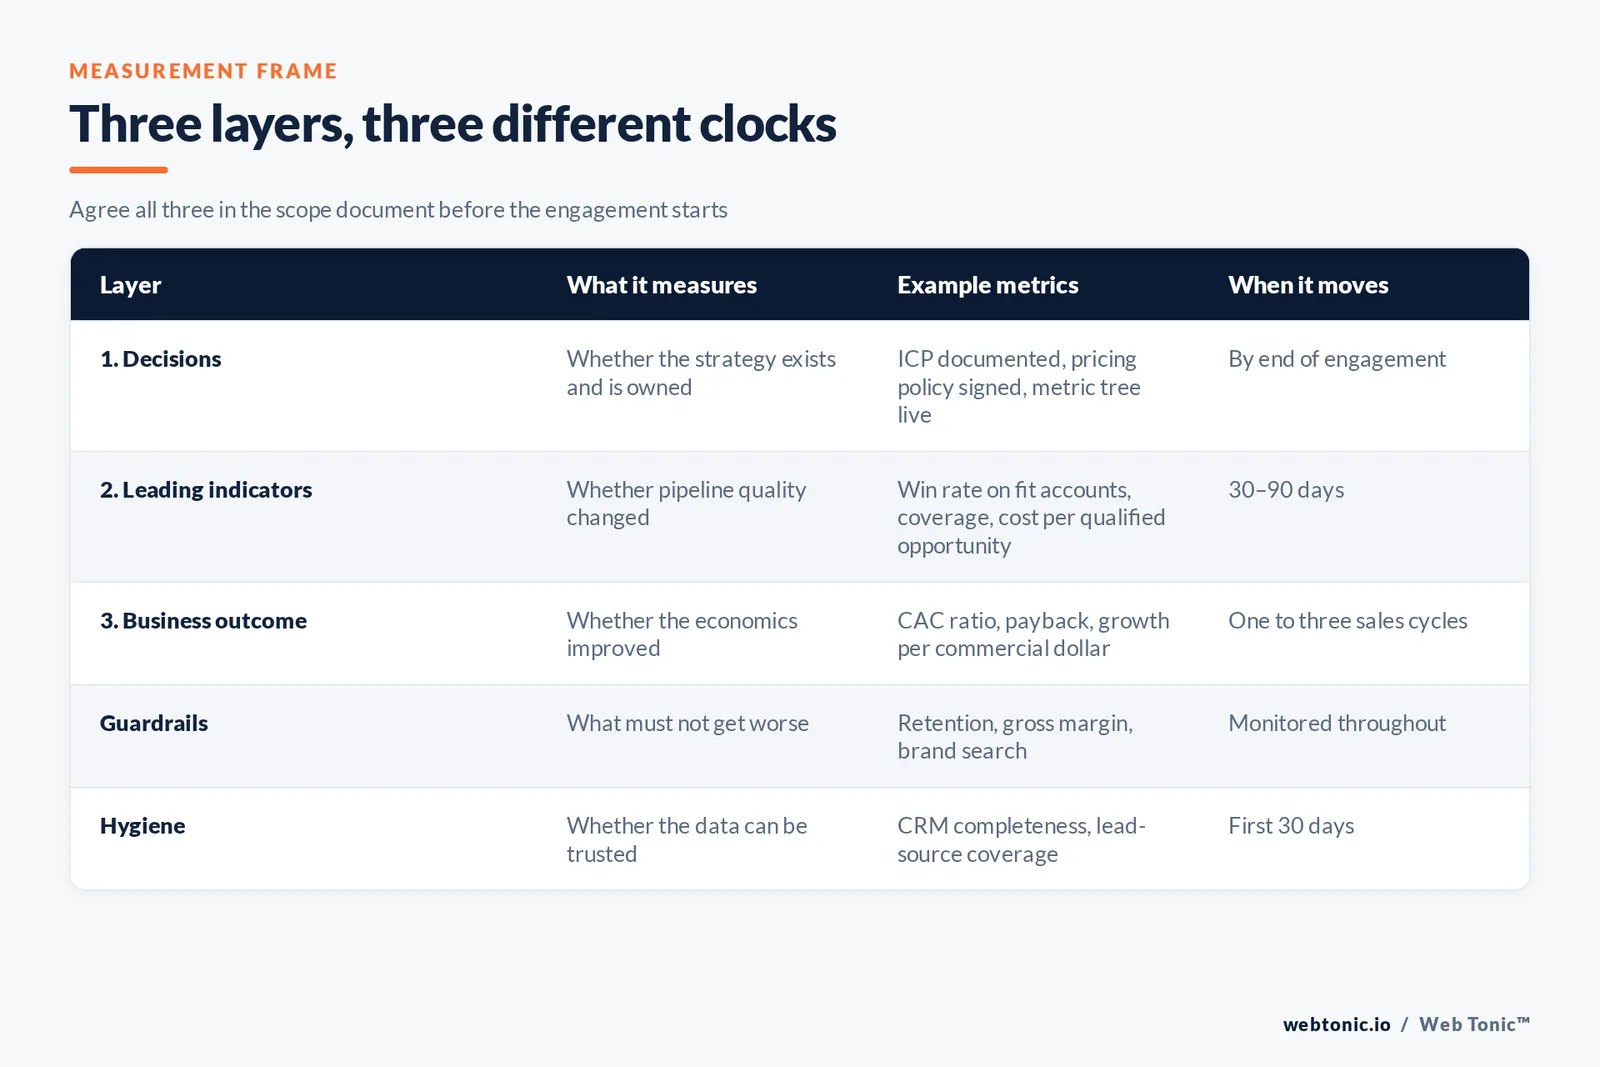
Advisory produces decisions, and decisions take time to become money. If the only agreed metric is revenue, every review in the first two quarters becomes a debate about whether the work is "working" while the sales cycle is still running. Agree the three layers in the scope document, name the owner of each number, and the reviews become boring in the best possible way.
The context is unforgiving. Bain's 2026 B2B Growth Agenda, based on over 1,100 senior executives across 18 industries, found 42% of companies missed 2025 revenue targets, up from 32% in 2024, while 91% stayed confident about the year ahead. Firms with a clear and consistently understood value proposition grew 19% in 2025 against 12% for those without — and only 4% believe they have one. Confidence is not a measurement system.
Layer one: did the decisions actually get made?
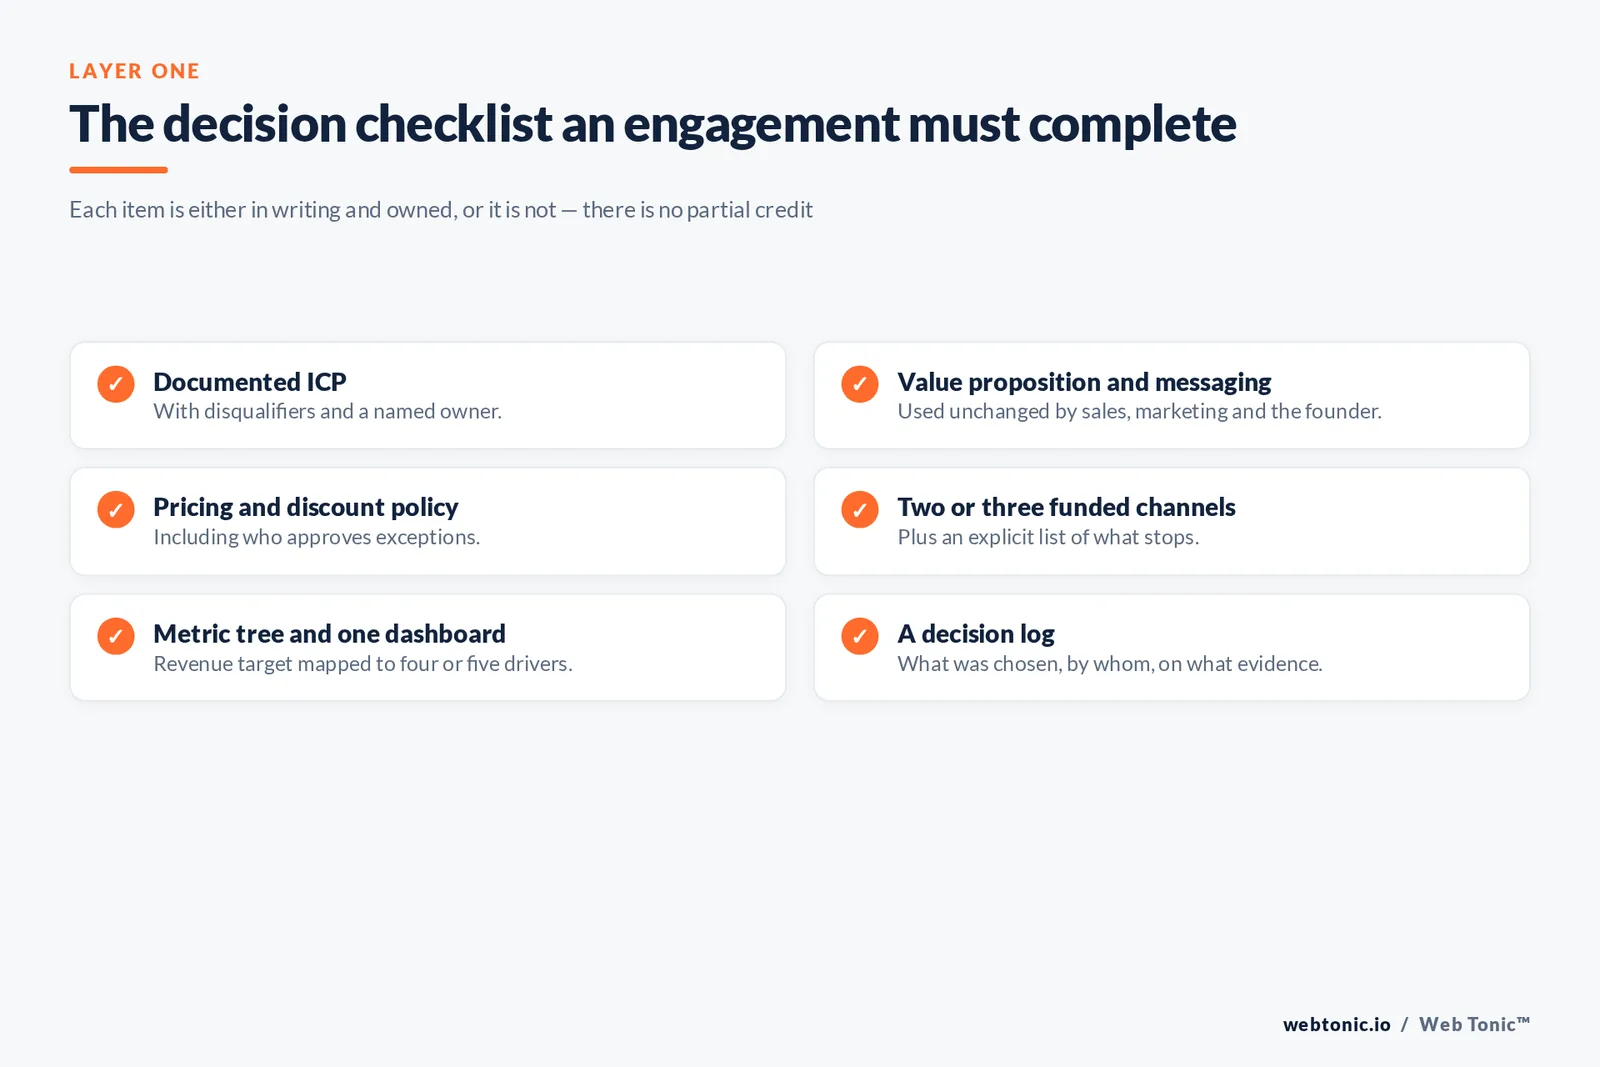
The first layer is a checklist, not a chart, and it should be complete by the end of the engagement. Each item is either in writing and agreed, or it is not.
- Documented ICP with disqualifiers and a named owner.
- Value proposition and messaging that sales, marketing and the founder use unchanged.
- Pricing and discount policy, including who can approve exceptions.
- Two or three funded channels, and an explicit list of what stops.
- Metric tree and one dashboard mapping the revenue target to four or five drivers.
- A decision log recording what was chosen, by whom, and on what evidence.
This layer catches the most common failure mode, which is not bad analysis but unfinished decisions. A marketing plan that names five priority segments has not prioritised; a pricing recommendation nobody signed is not a policy.
| Layer | What it measures | Example metrics | When it should move |
|---|---|---|---|
| 1. Decisions | Whether the strategy exists and is owned | ICP documented, pricing policy signed, metric tree live | By end of engagement |
| 2. Leading indicators | Whether behaviour and pipeline quality changed | Win rate on fit accounts, pipeline coverage, cost per qualified opportunity | 30–90 days |
| 3. Business outcome | Whether the economics improved | CAC ratio, payback, growth per commercial dollar, margin | One to three sales cycles |
| Guardrails | What must not get worse | Retention, gross margin, brand search volume | Monitored throughout |
| Hygiene | Whether the data can be trusted | CRM completeness, lead-source coverage, dashboard uptime | First 30 days |
Layer two: leading indicators inside the quarter
Leading indicators tell you whether the plan is changing behaviour before the revenue arrives. Four are worth the reporting effort.
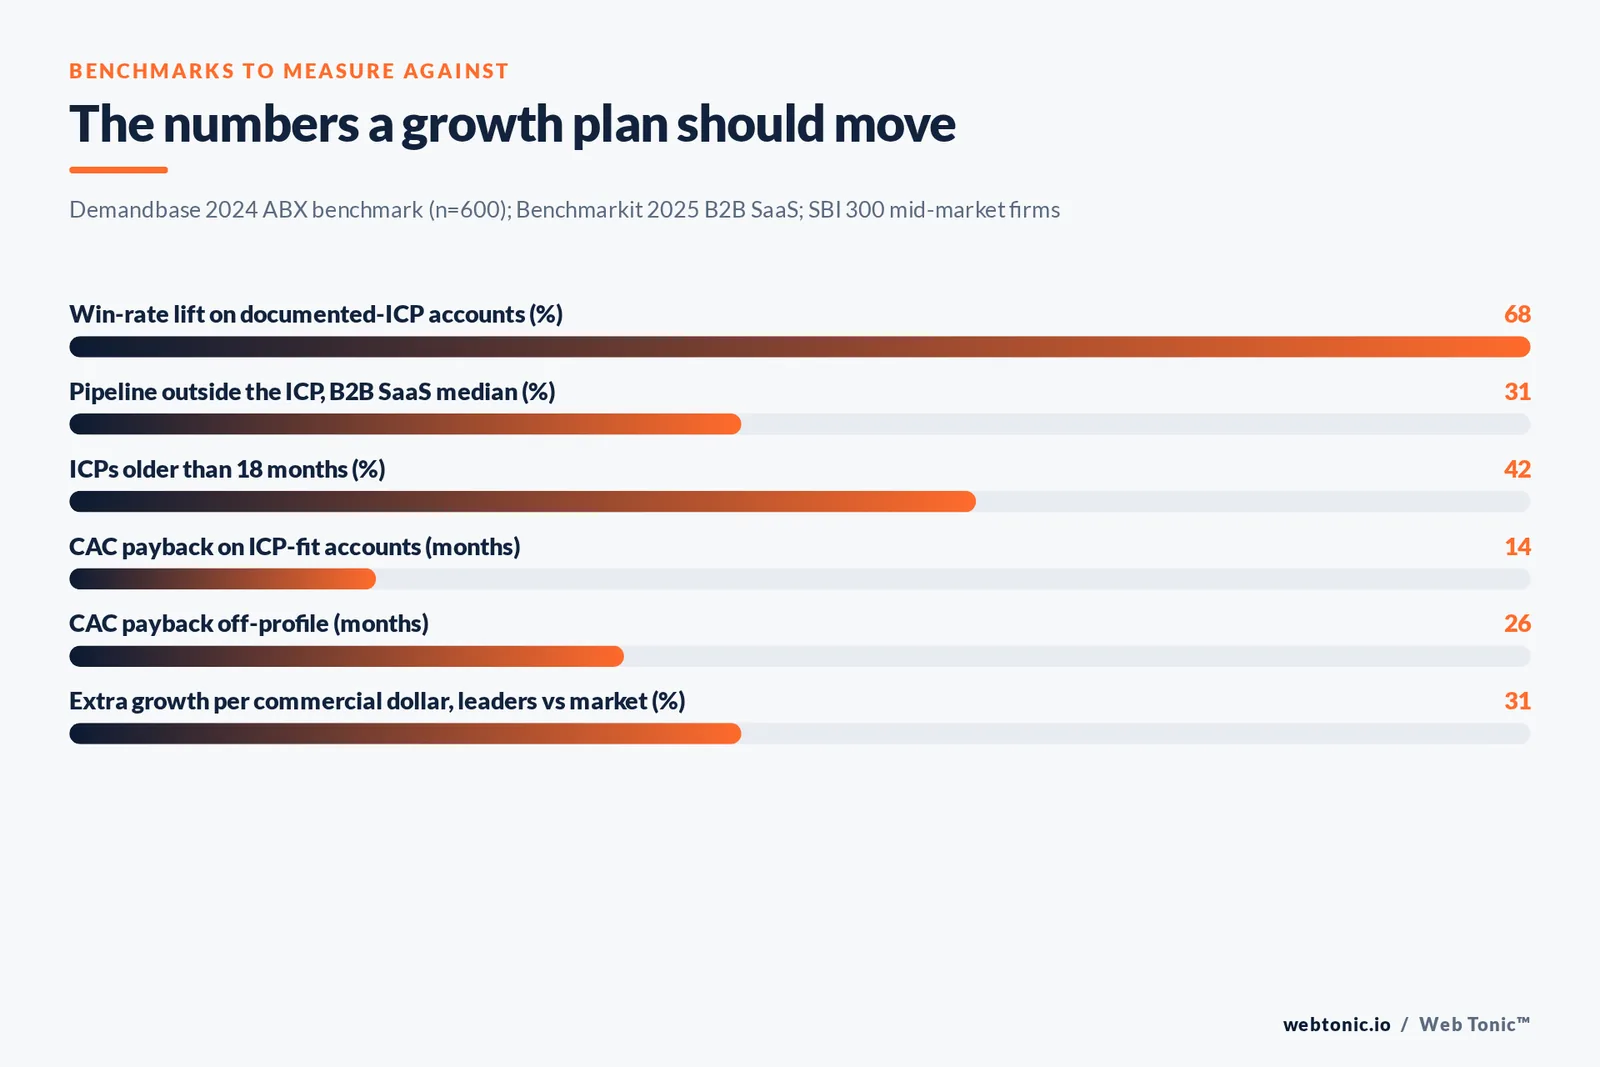
Win rate on ICP-fit accounts. Demandbase's 2024 benchmark of 600 B2B revenue leaders reports a 68% higher account win rate where a validated ICP exists. If your fit-account win rate is not separating from the rest within a couple of cycles, the profile is probably wrong.
Share of pipeline outside the ICP. The same compilation puts the B2B SaaS median at 31%, with 42% of marketers admitting their ICP is more than 18 months old. Watching off-profile share fall is the cleanest early proof that targeting changed.
Pipeline coverage. A 3:1 minimum is the operator benchmark cited in that dataset for quota attainment. Coverage improving while off-profile share falls is the combination you want.
Sales-cycle length and payback. Fit accounts close 1.7x faster, and CAC payback runs 14 months on ICP-fit accounts versus 26 months off-profile. Both are measurable long before the annual number lands.
Layer three: the economics
The business outcome layer answers whether the company converts spend into growth more efficiently than before. Three numbers do most of the work.
Growth per commercial dollar. SBI's analysis of 300 mid-market firms found leaders generating $0.71 of growth per dollar of sales and marketing spend against $0.54 for the market — 31% more growth per dollar. In the same dataset, sales and marketing expenses rose 68% from 2020 to 2024 while expense growth fell from 30% in 2021 to 5% in 2024, and only 53% of companies grew while holding positive EBITDA. Efficiency, not activity, is the differentiator.
CAC ratio and payback. Benchmarkit's 2025 B2B SaaS benchmarks put the median new-customer CAC ratio at $2.00 of sales and marketing spend per $1.00 of new ARR — 14% worse year over year — with the fourth quartile at $2.82, median growth of 26% and net revenue retention of 101%. Improving your own ratio against your own baseline matters more than matching the median.
Price realisation. McKinsey's study of the 1,200 largest public companies, summarised by IndustryWeek, calculated that a 1% price improvement lifts profit 8.7% on average, versus 5.9% for a 1% cut in variable costs and 1.8% for fixed costs. Track average realised price and discount depth by segment; it is the fastest-reporting outcome an advisory engagement produces.
Build the metric tree, then the dashboard
A metric tree decomposes one target into the handful of drivers leadership can actually influence. It stops the dashboard from becoming a wall of charts nobody reads.
| Level | Metric | Owner | Review cadence |
|---|---|---|---|
| Target | New revenue and margin by segment | CEO | Monthly |
| Driver | Qualified opportunities from ICP-fit accounts | Sales lead | Weekly |
| Driver | Cost per qualified opportunity by channel | Marketing lead | Weekly |
| Driver | Win rate and average realised price | Sales lead | Monthly |
| Guardrail | Retention and gross margin | Finance | Monthly |
| Hygiene | CRM field completeness, source coverage | Operations | Monthly |
Two rules keep it usable. Every metric has one owner — shared ownership means nobody explains a miss. And the tree lives in a tool leadership already opens; a beautiful dashboard in a system nobody logs into is decoration. Building that layer properly is what our data intelligence work exists for, because 35% of CEOs having decision-grade data is not a reporting problem, it is a governance one.
Attribution: enough rigour, not maximum rigour
Strategy work rarely produces a clean attribution story, and chasing one wastes the quarter. Three practical methods are usually enough.
- Cohort comparison. Deals opened after the plan went live versus the equivalent period before, same segment, same season.
- Segment holdout. Roll positioning or pricing changes into one segment or region first and compare against an unchanged one.
- Decision-level tracing. Each initiative in the plan names the metric it should move; review only that metric against it, rather than crediting the whole plan with everything good that happens.
Write down in advance what would count as failure. An engagement with no falsifiable claim cannot be evaluated, only defended. Egon Zehnder's survey of over 500 senior revenue leaders, published by Harvard Business Review, found that what separates compounding companies from stalled ones is coherence across the leadership agenda — which is measurable in review discipline long before it is visible in revenue.
Reporting the numbers to a board
Boards do not want the metric tree; they want the argument it supports. A one-page monthly report handles it: the target and where you are against it, the two leading indicators that moved and why, the one that did not, the decision you are asking for, and the risk you are watching. Everything else goes in an appendix nobody reads unless they want to.
Two habits keep those reports credible over a year. First, never change a metric definition mid-quarter without restating the prior periods — a redefined "qualified opportunity" can manufacture a trend on its own. Second, report the guardrails even when they are healthy, so a later dip reads as information rather than as something that was previously hidden. Efficiency gains that quietly cost retention or margin are not gains, and the board will find that out eventually. Given that 42% of companies missed their last revenue targets while 91% stayed confident, a reporting format that makes misses visible early is worth more than one that makes the quarter look tidy.
What not to measure
Four metrics reliably mislead in this context. Deliverable count rewards volume of slides. Hours consumed measures effort, not judgement — and note that in the 2026 Rate Report, consultants above $150,000 a year overwhelmingly use retainers or monthly fees precisely because hourly framing distorts incentives. Raw lead volume goes up whenever targeting gets looser, which is usually the opposite of the plan. And this month's revenue in a business with a six-month sales cycle tells you about decisions made two quarters ago.

Related reading
- Growth Advisory / Growth Consulting: what it costs in 2026
- Fractional CGO / Head of Growth: how to measure it
- EOS / Scorecard & KPI Advisory: how to measure it
- Marketing Strategy Consulting services at Web Tonic
Frequently Asked Questions
How soon should a growth advisory show measurable results?
Layer one by the end of the engagement, layer two within 30–90 days of the plan going live, and layer three after at least one full sales cycle. Businesses with long enterprise cycles should push the revenue read past month nine and rely on pipeline quality until then.
What is the single best metric for marketing strategy consulting?
If forced to one: cost per qualified opportunity from ICP-fit accounts. It combines targeting, messaging and channel efficiency, and it moves fast enough to steer by. Pair it with average realised price so efficiency gains are not bought with discounts.
How do we measure it if our data is a mess?
Fix hygiene inside the first 30 days: lead source on every record, one definition of a qualified opportunity, one revenue source of truth. A rough baseline captured before the plan launches is worth more than a perfect dashboard delivered in month four.
Should the consultant be paid on results?
Partly, and only against metrics they control. Tying fees to closed revenue in a business with a nine-month cycle and a separate sales team penalises the wrong party. Milestone-based structures tied to delivered decisions and leading indicators are cleaner and easier to arbitrate.
What does failure look like in the numbers?
Decisions unmade at the end of the engagement, off-profile pipeline share unchanged after two cycles, cost per qualified opportunity flat or worse with no explanation, and a dashboard nobody has opened in a month. Any two of those together mean stop and re-scope rather than renew.
Where to take this next
Agree the three layers before the kickoff, not at the first review. Our growth advisory engagements are scoped against exactly these measures, growth marketing executes against the resulting plan, the full services lineup covers what comes after, and there is more method detail on the blog. If you want a measurement frame reviewed before you sign anything, send it over.
Sources
Bain & Company — 2026 B2B Growth Agenda survey
The Starr Conspiracy — ICP Benchmarks for B2B GTM 2025
SBI Growth — While Growth Slows for Most, Leaders Take a Different Approach
Benchmarkit — 2025 B2B SaaS Performance Metrics
IndustryWeek / McKinsey — The Payoff from Investing in Pricing Capabilities
Harvard Business Review / Egon Zehnder — Why Some Companies Grow Rapidly While Others Stall
Sam Landenwitsch — The 2026 Rate Report


