Table of contents
In Google Shopping the feed is the targeting: DataFeedWatch's 15,000-store study found 7% of feed items rejected for data errors, and shipping plus image problems caused 44% of disapprovals. This hub collects the feed-management figures a PPC manager can actually defend - each one with its issuer, sample and year.
Key Takeaways
- 7% of Google Shopping feed items were rejected for data errors (DataFeedWatch, 15,000+ stores).
- Shipping and images caused 44% of product ad disapprovals.
- Shopify sellers: 5.47% disapproved; Magento: almost 10%.
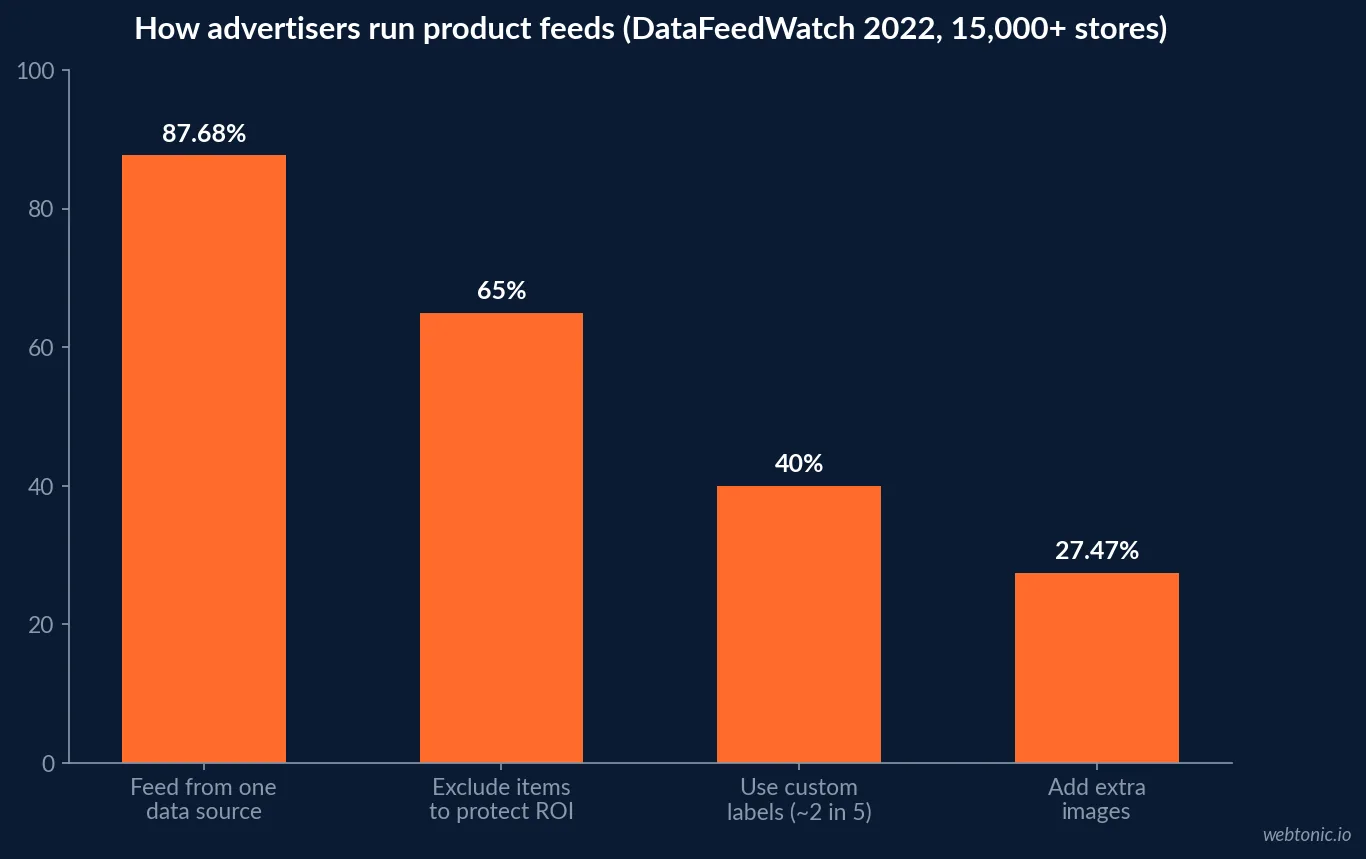
- 87.68% of advertisers feed channels from a single data source.
- 65% exclude some items from feeds to protect ROI.
- Titles are capped at 150 characters; up to 10 additional images are allowed.
- Up to 5 custom labels per product, 1,000 unique values each.
- A single GS1 US GTIN licence costs USD 30, one time.
- Performance Max took 62% of Shopping spend in Q4 2025 (Tinuiti).
- PMax conversion rates ran 3% below standard Shopping.
- The Shopping Graph holds 50 billion+ listings, 2 billion updated hourly.
- 54% of shoppers abandoned a purchase over conflicting product information (Salsify 2025).
How often feeds fail, and why
The largest public feed-health dataset is DataFeedWatch's Feed Marketing Report 2022, built on samples from more than 15,000 online stores across over 20 e-commerce sectors. It found 7% of Google Shopping feed items rejected because of data errors, with shipping settings and images responsible for 44% of product ad disapprovals. Platform mattered: Shopify sellers showed 5.47% disapproved listings, while almost 10% of Magento sellers' ads were affected.
The study is a vendor's own dataset and dates from 2022, so it is a baseline rather than a live benchmark. It is still the only one of its size with a stated sample, which is why it anchors this section instead of the unsourced "feed statistics" lists that circulate.
| Feed health finding (DataFeedWatch 2022) | Value | What a PPC manager does with it |
|---|---|---|
| Feed items rejected for data errors | 7% | Baseline for a monthly diagnostics review |
| Disapprovals from shipping + images | 44% | Audit these two attributes first |
| Shopify sellers' disapproved listings | 5.47% | Platform choice affects error load |
| Magento sellers affected | almost 10% | Complex back ends need feed rules |
| Advertisers using a single data source | 87.68% | Supplemental feeds are underused |
| Advertisers adding extra images | 27.47% | Additional images are a gap to close |
| Advertisers excluding items for ROI | 65% | Exclusion is standard practice |
The attribute limits that shape every feed
Google's product data specification sets hard limits that feed rules have to respect. Titles are plain text with a maximum of 150 characters. Merchants can submit up to 10 additional product images. Custom labels run from custom_label_0 to custom_label_4 - 5 per product - with no more than 1,000 unique values per label across the account. Sale price effective dates should sit less than 30 days in the future.
Custom labels are where feed management meets bidding. DataFeedWatch found about 2 in 5 advertisers create them to group products for bidding - margin tiers, seasonality, bestsellers - which means most advertisers still bid on Google's default product groupings.
| Attribute (Google spec) | Rule | Why it matters for performance |
|---|---|---|
| title | Max 150 characters | Primary query-matching field |
| additional_image_link | Up to 10 extra images | Images drive a large share of disapprovals |
| custom_label_0-4 | 5 labels, 1,000 unique values each | Bidding groups by margin or season |
| gtin | Required for new products with a manufacturer GTIN | Matching and visibility |
| identifier_exists | Used when no GTIN/MPN exists | Avoids false identifier errors |
| sale_price_effective_date | Under 30 days in the future | Prevents stale promotion data |
Product identifiers and what they cost
Google's unique product identifier guidance recommends a valid GTIN for every product, warns that products with an assigned GTIN submitted without one "may have limited visibility", and says incorrect identifiers can lead to disapproval. It recommends submitting GTIN, brand and MPN together.
For brands creating their own identifiers, GS1 US licenses a single GTIN for a one-time USD 30 with no renewal fee, while a company prefix costs USD 250 to USD 10,500 up front to identify 10 to 100,000 products, renewed annually. Retailers reselling branded goods should use the manufacturer's GTIN, never invent one.
The identifier bill is small next to the visibility risk. Even the largest GS1 US prefix tier costs less up front than many brands spend on Shopping clicks in a week, and it removes a whole class of Merchant Center warnings for private-label and own-brand catalogs.
| Identifier item | Published rule or price | Issuer |
|---|---|---|
| Single GS1 US GTIN | USD 30 one time, no renewal | GS1 US |
| GS1 US company prefix | USD 250 - 10,500 initial, annual renewal | GS1 US |
| Prefix capacity | 10 to 100,000 products | GS1 US |
| GTIN in Merchant Center | Required for new products with a manufacturer GTIN | |
| Missing assigned GTIN | May have limited visibility | |
| Incorrect identifiers | Products may be disapproved |
What Merchant Center will not list
Before any feed work, confirm eligibility. Google's Unsupported Shopping content policy bars, among other things, services - defined as "labor, time, effort, expertise, or actions, which do not result in ownership" - and immovable property: "Property not physically movable ... Real estate, non-portable homes, plots of land." Future event and transport tickets, most financial products and eBooks are also listed. Software subscriptions are allowed only when prepaid and auto-renewing annually.
Google notes that violations do not trigger immediate suspension: a warning is issued at least 7 days before an account is suspended. For service businesses the practical answer is Local Services Ads, Search or Performance Max - which Google describes as accessing all Google Ads inventory from one campaign - rather than Shopping.
| Content type | Shopping eligibility (Google policy) | Alternative Google format |
|---|---|---|
| Physical products you sell | Eligible | Shopping, PMax, free listings |
| Services (repair, legal, accounting, cleaning) | Unsupported | Local Services Ads, Search, PMax |
| Real estate and land | Unsupported (immovable property) | Search, Display, PMax |
| Event and transport tickets | Unsupported | Search, events ticketing campaigns |
| Annual prepaid software subscriptions | Allowed | Shopping or Search |
| In-store stock at physical locations | Eligible via local inventory ads | Local inventory ads |
Performance Max versus standard Shopping
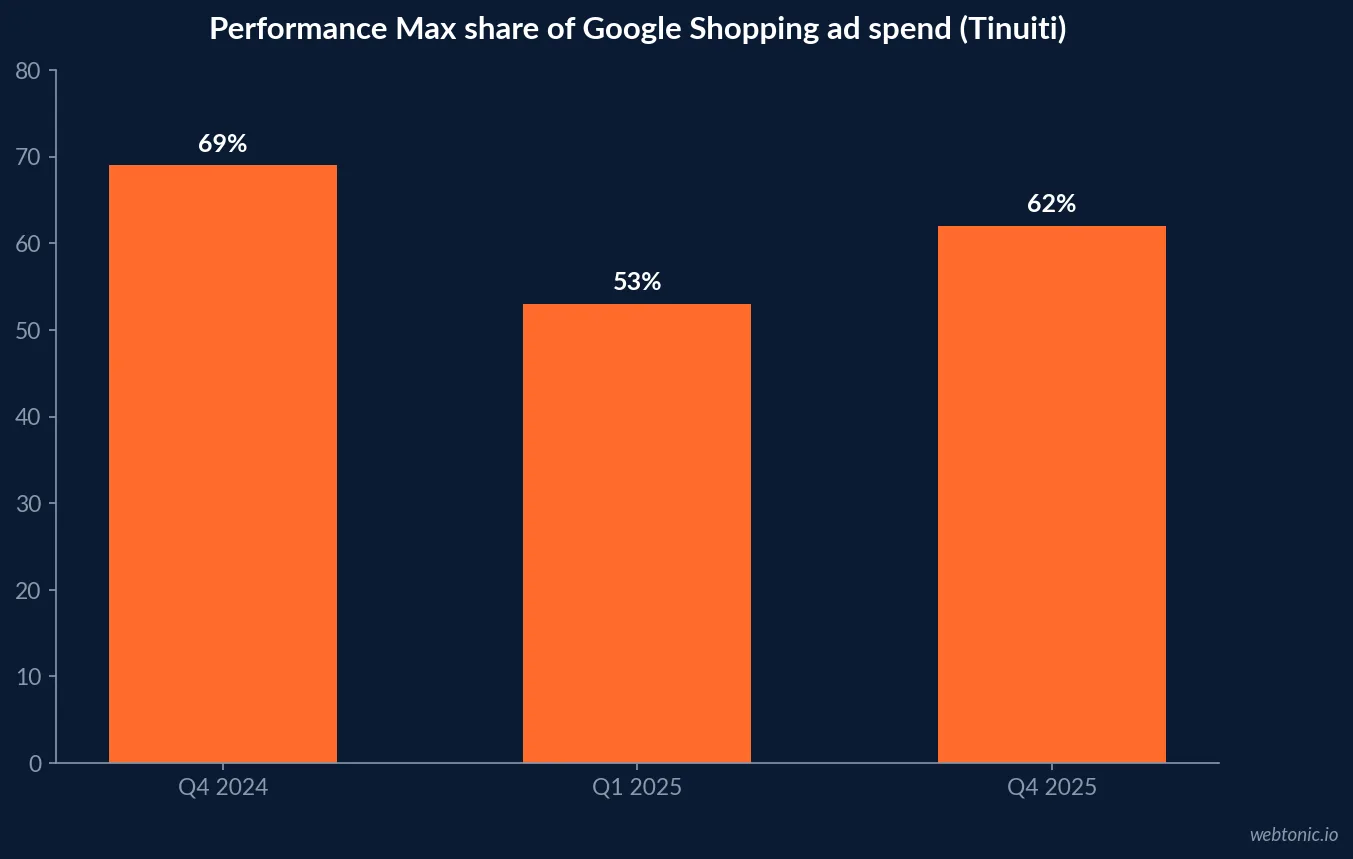
Tinuiti's Q4 2025 Digital Ads Benchmark Report (agency client data) shows that among brands running both, Performance Max accounted for 62% of Google Shopping ad spend in Q4 2025, down from 69% a year earlier but up from a low of 53% in Q1 2025. PMax produced 61% of Shopping ad sales. Its conversion rate was 3% below standard Shopping and its ROAS 1% lower, after a quarter in which PMax had a 2% conversion advantage.
Feed quality affects both campaign types equally - PMax draws its Shopping inventory from the same Merchant Center feed - but custom labels and product-group exclusions give standard Shopping more direct control, which is one reason advertisers keep a split.
| PMax vs standard Shopping (Tinuiti) | Value | Period |
|---|---|---|
| PMax share of Shopping spend | 62% | Q4 2025 |
| PMax share of Shopping spend a year earlier | 69% | Q4 2024 |
| PMax share low point | 53% | Q1 2025 |
| PMax share of Shopping ad sales | 61% | Q4 2025 |
| PMax conversion rate vs standard Shopping | -3% | Q4 2025 |
| PMax ROAS vs standard Shopping | -1% | Q4 2025 |
The auction the feed is competing in
Tinuiti's Q4 2025 report says Amazon stopped running nearly all US Google Shopping ads in July 2025, Google search spend rose 13% year on year for its advertisers, clicks rose 13% - the strongest growth since early 2021 - and Shopping CPC fell 1%. Skai's Q2 2026 quarterly trends release reported paid search spend up 17% with CPCs rising and clicks roughly flat. Different client bases give different readings; both are vendor data and should be quoted with their quarter.
On Google's side, the Shopping Graph now holds more than 50 billion product listings, 2 billion of which update every hour, and the US Census Bureau puts Q2 2026 e-commerce at 17.1% of total retail sales (seasonally adjusted). A feed that updates price and stock once a day is being compared against an index that refreshes constantly.
Why content quality shows up in shopper behaviour
Salsify's 2025 Consumer Research Report (1,910 US and UK online shoppers) found 54% dropped a purchase because of conflicting product information and 71% returned an item over an inaccurate description, while 41% will scroll to page three of results to find the right product. Feed titles and descriptions are the same content shoppers read on the listing, so feed hygiene is also a returns problem.
Local inventory: the omnichannel feed
Retailers with physical stores can extend the same catalog to local inventory ads and free local product listings, which Google makes available in more than 40 countries including the US, Canada and the UK. Participants must follow Shopping ads policies plus local-specific rules, and submit store-level availability, so the feed now needs a stock figure per location rather than one online number.
A feed audit order for PPC managers
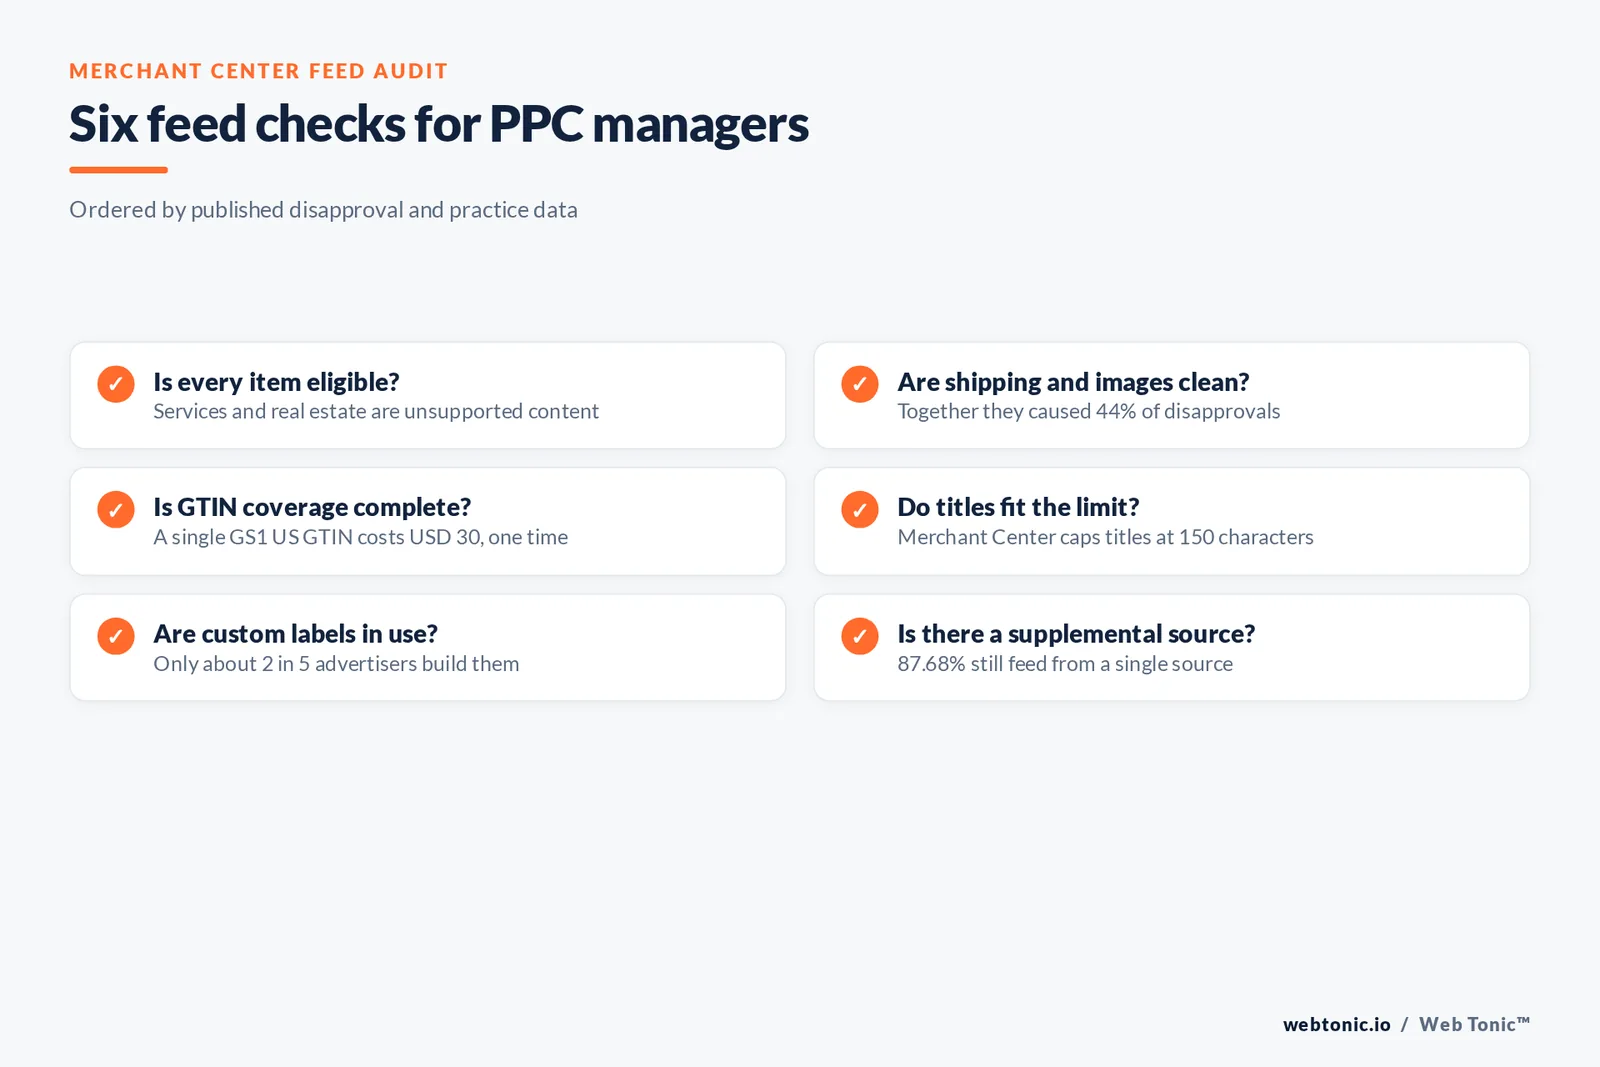
- Confirm eligibility against the Unsupported Shopping content policy.
- Fix shipping and images first - 44% of disapprovals in the DataFeedWatch data.
- Check GTIN coverage and use identifier_exists only where no GTIN exists.
- Rewrite titles inside 150 characters with the query terms buyers use.
- Build custom labels for margin and season; only about 2 in 5 advertisers do.
- Add a supplemental source; 87.68% still rely on a single feed.
- Decide the PMax / standard split by how much product-level control you need.
Related paid media data
For cost context, read our Google Ads pricing guide and our Google Ads strategy tips. The broader channel picture is in our advertising statistics, and our data intelligence team builds feed and ROAS reporting.
Frequently Asked Questions
What share of Google Shopping feed items get disapproved?
DataFeedWatch's Feed Marketing Report 2022, built on data from more than 15,000 online stores, found 7% of items in Google Shopping feeds were rejected because of data errors. Shipping settings and images together caused 44% of product ad disapprovals. Shopify sellers had the lowest rate at 5.47%, while almost 10% of Magento sellers' listings were affected. It is a 2022 dataset, so treat it as a baseline, not a current benchmark.
Is a GTIN mandatory in Merchant Center?
Google's product data specification marks GTIN as required for all new products that have a GTIN assigned by the manufacturer. Google's identifier guidance adds that products with an assigned GTIN submitted without one may have limited visibility, and that made-up or incorrect identifiers can get products disapproved. Custom or handmade goods without a GTIN use the identifier_exists attribute instead.
Can a service business run Google Shopping ads?
No. Google's Unsupported Shopping content policy lists services - labour, time, effort, expertise or actions that do not result in ownership of a product - and immovable property such as real estate as content that cannot be listed. Service businesses use Local Services Ads, Search or Performance Max instead, and can use Shopping only for physical products they actually sell.
Does Performance Max replace standard Shopping campaigns?
Not entirely. Tinuiti's Q4 2025 Digital Ads Benchmark Report found that among brands running both, Performance Max took 62% of Google Shopping ad spend, down from 69% a year earlier, and generated 61% of Shopping ad sales. PMax conversion rates were 3% below standard Shopping and ROAS 1% lower that quarter, so many advertisers keep both.
How many product listings does Google's Shopping Graph hold?
Google says its Shopping Graph includes more than 50 billion product listings, 2 billion of which are updated every hour. That scale is why feed freshness matters: price and availability mismatches are compared against a constantly refreshed index.
Sources
Google Merchant Center Help - Unsupported Shopping content
Google Merchant Center Help - Product data specification
Google Merchant Center Help - About unique product identifiers
Google Merchant Center Help - Local inventory ads policies
Google Ads Help - About Performance Max campaigns
DataFeedWatch - Feed Marketing Report 2022
Tinuiti - Digital Ads Benchmark Report Q4 2025
Skai - Q2 2026 Quarterly Trends press release
Google - Agentic checkout and AI shopping (The Keyword)
US Census Bureau - Quarterly Retail E-Commerce Sales
GS1 US - Company prefix and barcode FAQs
Salsify - 2025 Consumer Research Report press release