Table of contents
Quality Score is a 1–10 diagnostic Google reports for each keyword, built from expected click-through rate, ad relevance and landing page experience. It is not used in the ad auction itself — it tells you where auction-time ad quality is likely weak.
Key Takeaways
- Quality Score has three components, each rated Below average, Average or Above average against other advertisers on the same keyword over the previous 90 days.
- Keywords without enough exact-match search impressions report a dash instead of a number — a null Quality Score is not a 0.
- Google's own guidance is explicit: Quality Score is a diagnostic, and Ad Rank is what decides position and cost per click, using your bid, auction-time ad quality, Ad Rank thresholds, auction context and expected impact of assets.
- The highest-leverage component is usually expected CTR, because it is scored relative to competitors — all-industry paid search averages sit near a 6.64% CTR and $5.42 CPC, which is the bar your ads are measured against.
- Landing page experience is the slowest component to move and the one most often ignored: 1 shared landing page across 40 ad groups almost guarantees a Below average rating.
- Work at the ad group level. Fixing the 10 keywords carrying the most spend with Below average components beats a bulk account-wide sweep.
This guide covers how Google calculates Quality Score, what each component actually measures, the diagnostic workflow we run inside client accounts at Web Tonic, and the specific fixes that move each rating. If you are still setting campaigns up, start with how to run Google Ads.
What Quality Score is — and what it is not
Google's Quality Score documentation describes it as an estimate of the quality of your ads, keywords and landing pages, reported on a 1–10 scale at keyword level in Search campaigns. Higher quality experiences generally mean lower prices and better ad positions, but the score in your interface is a summary of historical performance — not the number plugged into each auction.
The auction uses Ad Rank, which combines your bid amount, auction-time ad and landing page quality, the Ad Rank thresholds, the context of the person's search, and the expected impact of your assets and ad formats. That distinction matters in practice: a keyword showing Quality Score 6 can still win the top slot in a specific auction because the query, device and location context favoured it.
Advertisers who want the underlying history can pull it from the API. The ad group criterion resource exposes quality info fields for the composite score plus the creative, post-click and predicted-CTR components, which is how agencies build Quality Score trend reports the UI does not provide.
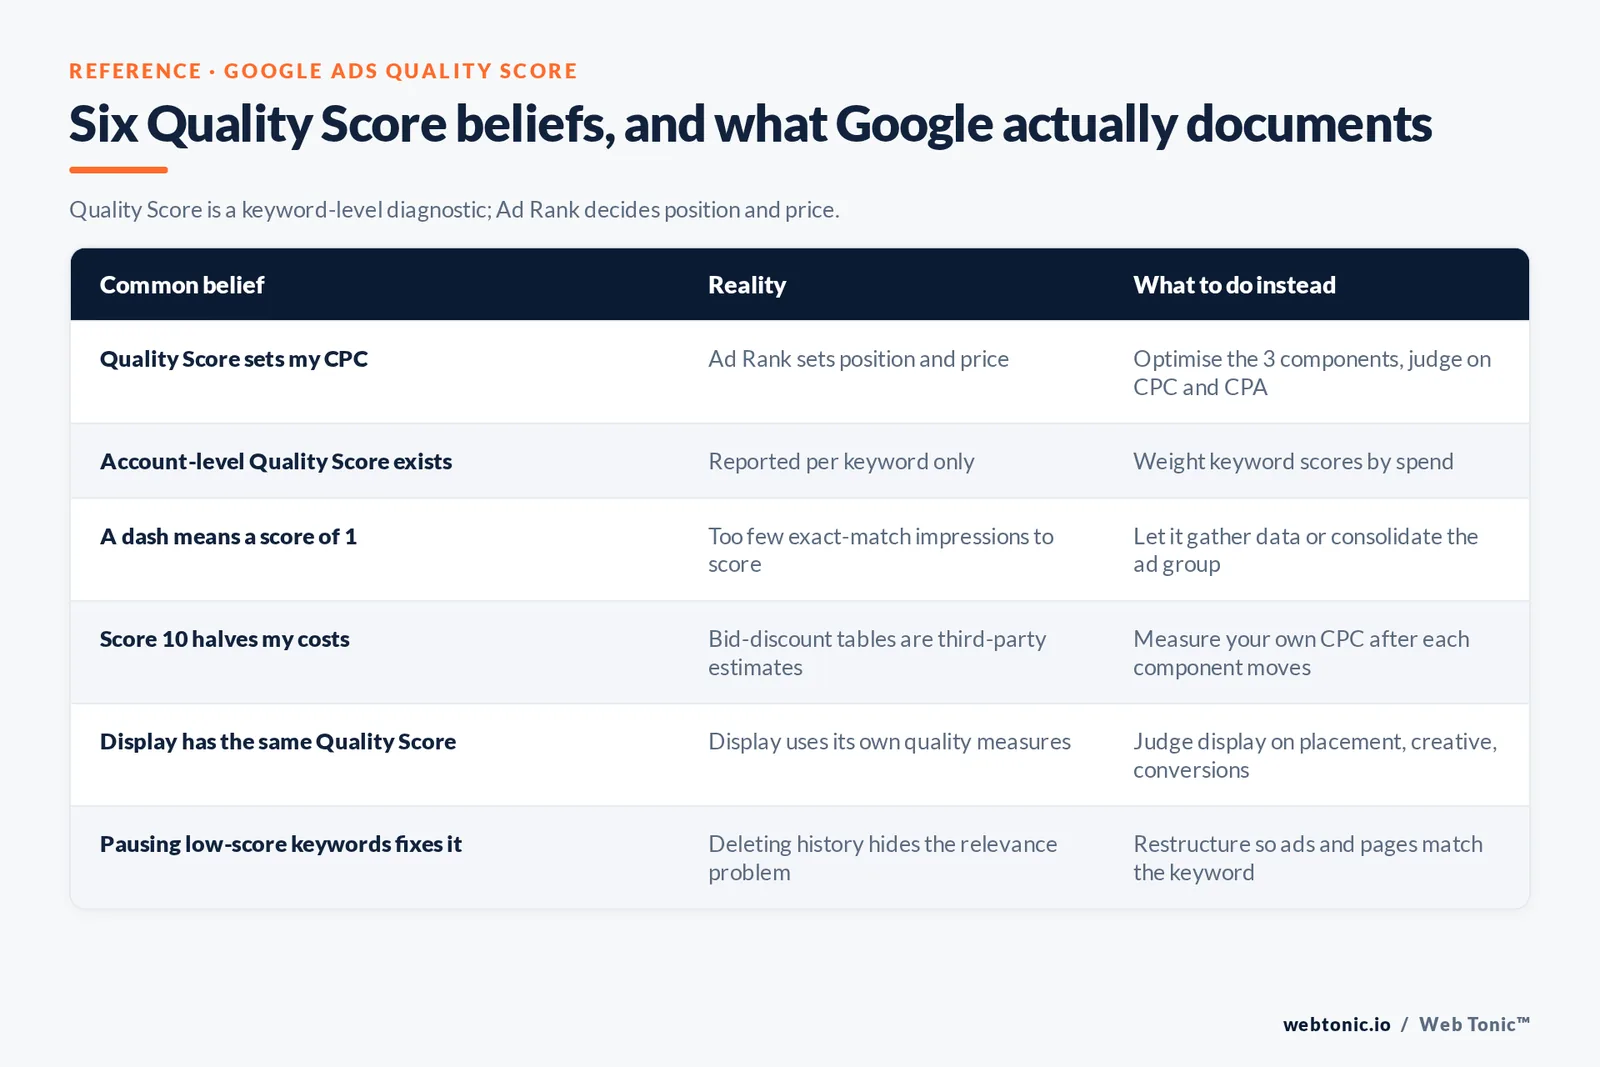
| Common belief | Reality | What to do instead |
|---|---|---|
| "Quality Score sets my CPC" | Ad Rank sets position and price; Quality Score is a reported diagnostic | Optimise the 3 components, then judge results by actual CPC and CPA |
| "Account-level Quality Score exists" | Google reports Quality Score per keyword, not per account | Weight keyword scores by spend to get a meaningful account view |
| "A dash means a score of 1" | A dash means too few exact-match search impressions to score | Let the keyword accumulate data or consolidate it into a stronger ad group |
| "Quality Score 10 halves my costs" | Bid-discount tables circulating since 2013 are third-party estimates, never published by Google | Measure your own CPC change after each component moves up |
| "Display campaigns have the same Quality Score" | The Display Network uses its own quality measures, not Search Quality Score | Judge display quality by placement, creative and conversion data |
| "Pausing low-score keywords fixes the account" | Deleting history removes the diagnostic, not the underlying relevance problem | Restructure the ad group so ads and landing pages match the keyword |
The three components, decoded
Each component is a comparative rating, not an absolute. Below average means other advertisers competing on that keyword are doing better on that dimension — which is why the same ad can be Above average on one keyword and Below average on another.
| Component | What Google measures | Strongest levers | Time to move |
|---|---|---|---|
| Expected click-through rate | How likely your ad is to be clicked when shown for that keyword, normalised for position | Keyword in headline 1, matched search intent, tighter match types, negative keywords | 1–3 weeks |
| Ad relevance | How closely your ad copy matches the intent behind the keyword | Ad groups of 5–20 tightly themed keywords, pinned headline, exact query language | 1–2 weeks |
| Landing page experience | Relevance, usefulness, transparency and ease of navigation of the page after the click | Dedicated pages per theme, H1 matching the keyword, mobile speed, visible contact and policy info | 3–8 weeks |
Google's guidance on using Quality Score for optimisation recommends reading the component columns rather than the composite number, precisely because the components tell you which of the three problems you have.
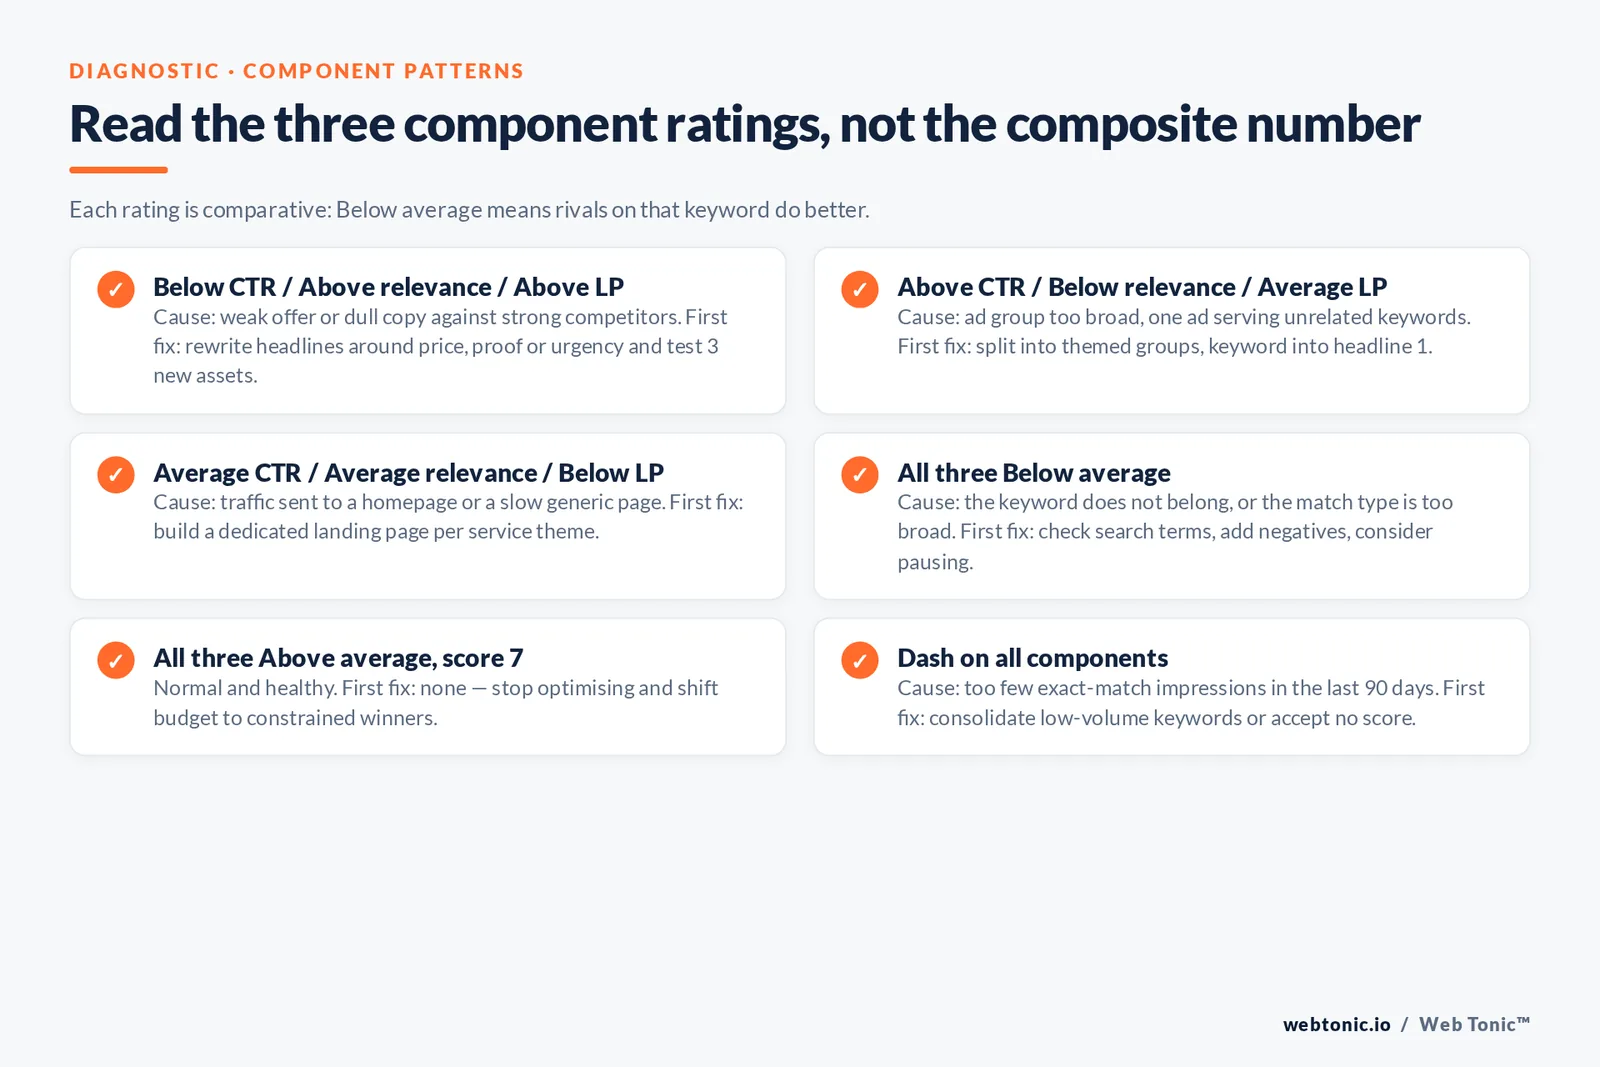
| Component pattern | Most likely cause | First fix |
|---|---|---|
| Below CTR / Above relevance / Above LP | Weak offer or unappealing ad copy against strong competitors | Rewrite headlines around price, proof or urgency; test 3 new assets |
| Above CTR / Below relevance / Average LP | Ad group too broad — one ad serving many unrelated keywords | Split into themed ad groups; put the keyword in headline 1 |
| Average CTR / Average relevance / Below LP | Traffic sent to a homepage or a slow, generic page | Build a dedicated landing page per service theme |
| All three Below average | Keyword does not belong in the account, or the match type is too broad | Check the search terms report, add negatives, consider pausing |
| All three Above average, score 7 | Normal — a 7–8 with three Above average ratings is a healthy keyword | Stop optimising; shift budget to constrained winners |
| Dash on all components | Too few exact-match search impressions in the last 90 days | Consolidate low-volume keywords or accept no score |
How to improve Quality Score: the 7-step workflow
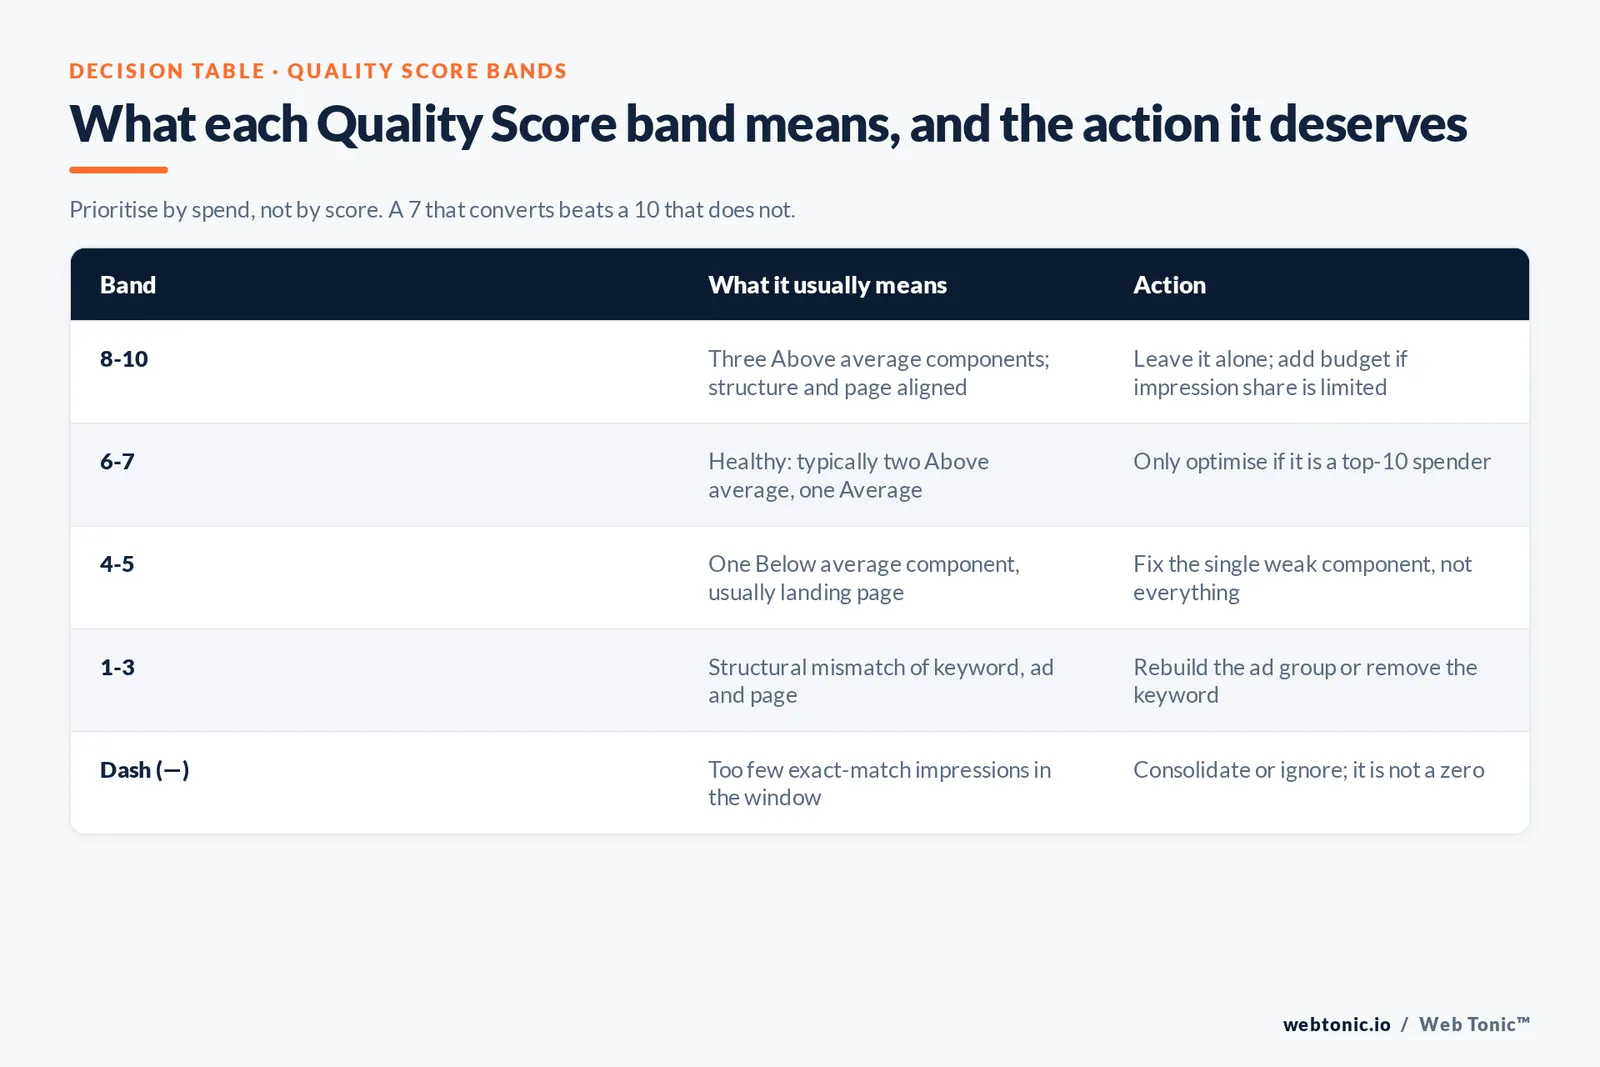
- Step 1 — add the columns. In the Keywords view, add Quality Score plus Exp. CTR, Ad relevance and Landing page exp. Nothing useful happens until all four are visible.
- Step 2 — sort by cost, not by score. Export keywords with spend in the last 30 days and rank by cost. Your first target list is the top 10 spenders with any Below average component.
- Step 3 — clean the queries. Open the search terms report and negate irrelevant matches. Irrelevant impressions suppress expected CTR faster than anything else.
- Step 4 — tighten the ad groups. Aim for 5–20 keywords sharing one intent per ad group, with the primary phrase in headline 1 of every responsive search ad.
- Step 5 — match the page. The landing page H1 should echo the keyword, the offer should be visible without scrolling, and the form should sit above the fold on mobile.
- Step 6 — fix speed. Test the page in PageSpeed Insights; a Largest Contentful Paint under 2.5 seconds is the threshold to clear on mobile.
- Step 7 — re-measure after 3–4 weeks. Components use a rolling window, so judge nothing sooner. Track CPC and CPA alongside the score.
| Fix | Component it moves | Effort | Typical lead time |
|---|---|---|---|
| Negative keyword sweep | Expected CTR | Low — 1–2 hours | 2–3 weeks |
| Keyword in headline 1 | Ad relevance | Low — 1 hour per campaign | 1–2 weeks |
| Ad group split by intent | Ad relevance + expected CTR | Medium — 1 day | 3–4 weeks |
| Match type tightening | Expected CTR | Low | 2–4 weeks |
| Dedicated landing page | Landing page experience | High — 1–2 weeks build | 4–8 weeks |
| Mobile speed work | Landing page experience | Medium | 4–6 weeks |
| Adding sitelinks and callouts | Expected impact of assets (Ad Rank) | Low — 2 hours | 1–2 weeks |
| Trust content on the page | Landing page experience | Low | 3–6 weeks |
What "good" looks like against real benchmarks
Because expected CTR is relative, you need to know what typical performance looks like in paid search. LocaliQ's 2026 Google Ads benchmark study across hundreds of thousands of campaigns puts the all-industry search averages at a 6.64% CTR, a $5.42 CPC, an 8.18% conversion rate and a $66.69 cost per lead. Sector variation is wide: dentists average an $8.00 CPC with a 5.66% CTR, while physicians and surgeons average $4.76 and 12.43% conversion.
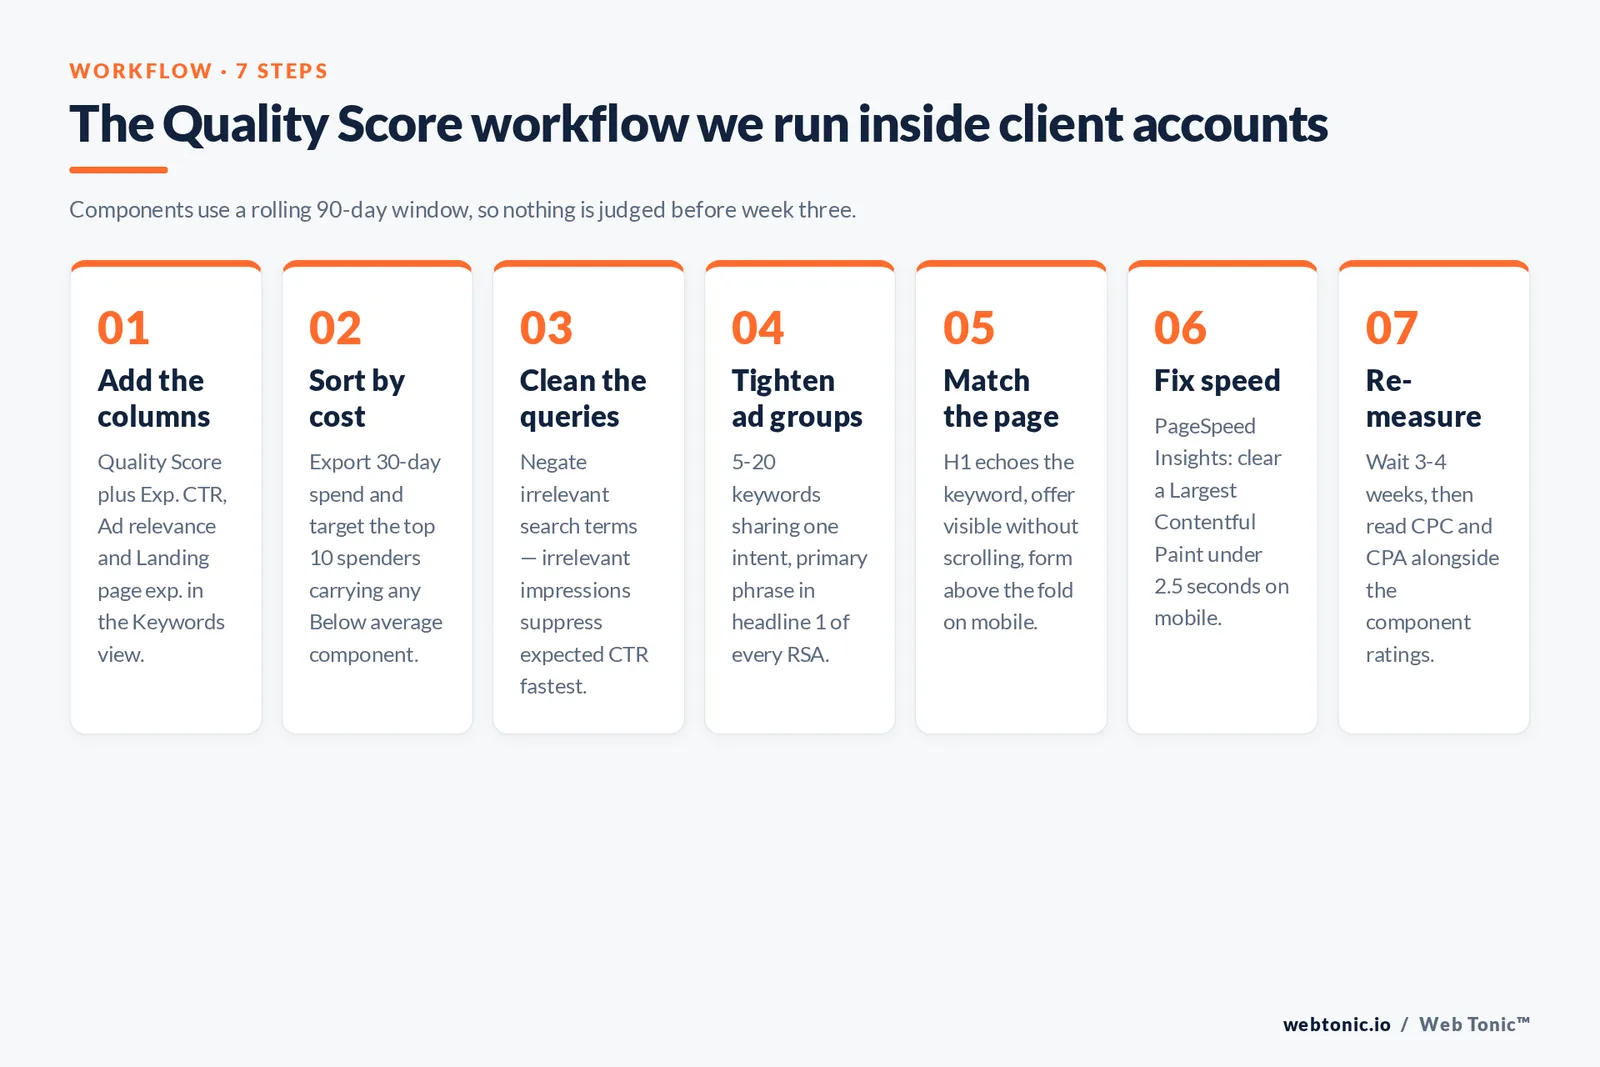
| Quality Score band | What it usually means | Action |
|---|---|---|
| 8–10 | Three Above average components; structure and page are aligned | Leave it alone; increase budget or bids if impression share is limited |
| 6–7 | Healthy. Typically two Above average and one Average component | Only optimise if the keyword is a top-10 spender |
| 4–5 | One Below average component, usually landing page experience | Fix the single weak component; do not rewrite everything |
| 1–3 | Structural mismatch between keyword, ad and page | Rebuild the ad group or remove the keyword |
| Dash (—) | Insufficient exact-match impressions in the scoring window | Consolidate or ignore; never treat it as a failure |
Quality Score by campaign type and platform
Search campaigns are the only place a keyword-level Quality Score is reported. That does not mean quality stops mattering elsewhere — it means the diagnostic changes shape.
| Campaign type | Quality diagnostic available | What to optimise instead |
|---|---|---|
| Search | Quality Score 1–10 plus 3 component ratings | Keyword–ad–page alignment, negatives, asset quality |
| Shopping | No keyword Quality Score | Feed titles, images, price competitiveness, product data quality |
| Performance Max | No Quality Score; asset ratings only | Asset group strength, audience signals, landing page relevance |
| Display | Separate quality measures, no Search Quality Score | Placement exclusions, creative refresh, conversion tracking |
| Video / Demand Gen | No Quality Score | Hook rate, view-through rate, landing experience |
| Microsoft Advertising Search | Its own 1–10 quality score with the same 3 components | Same levers; see the Microsoft quality score documentation |
Microsoft's implementation is a useful control: because it scores the same three dimensions on a different competitive set, importing a Google campaign unchanged often produces different quality ratings on identical keywords — which is the clearest proof that these components are relative, not absolute. Microsoft publishes platform changes on the Microsoft Advertising blog.
Landing page experience: the component most accounts lose
Expected CTR and ad relevance are cheap to fix inside the ads interface. Landing page experience requires web work, so it is the component that quietly caps thousands of accounts. Google evaluates relevance to the search, usefulness, transparency and navigability — and mobile behaviour is judged on the same page.
| Page element | Below average signal | Above average standard |
|---|---|---|
| Headline | Generic brand slogan | H1 repeats the keyword and the outcome |
| Offer position | CTA below 2 screens of scroll | Primary CTA visible within the first screen |
| Load speed | LCP over 4 seconds on mobile | LCP under 2.5 seconds; images compressed and lazy-loaded |
| Content match | 1 page serving 20 unrelated ad groups | 1 page per service or product theme |
| Transparency | No pricing signal, no contact details, no policies | Visible contact info, privacy policy, pricing guidance, real proof |
| Navigation | Popups and interstitials blocking content | Clean layout, 1 conversion path, no forced interstitials |
| Forms | 10+ fields for a first enquiry | 3–5 fields, with progressive profiling after submission |
Google's own research library on search behaviour, published at Think with Google, and long-running analyses like WordStream's Quality Score resource reach the same conclusion from different directions: relevance compounds across the whole click path, and one weak step drags the rest down. Our web development team usually builds the dedicated pages before we touch bids.
A 30-day Quality Score improvement plan
| Week | Focus | Deliverable | Metric to watch |
|---|---|---|---|
| Week 1 | Diagnose | Export of all keywords with spend, score and 3 component ratings | Share of spend on Below average components |
| Week 2 | Query hygiene and copy | Negative keyword list plus 3 new headline assets per top ad group | CTR by ad group |
| Week 3 | Structure | Top 5 broad ad groups split into themed groups of 5–20 keywords | Ad relevance ratings |
| Week 4 | Landing pages | 2 dedicated pages live, LCP under 2.5s, forms cut to 4 fields | Conversion rate and landing page exp. |
| Week 5–6 | Re-measure | Before/after report on CPC, CPA and weighted Quality Score | CPC change at equal impression share |
Need this run for you? See what we do, browse more PPC playbooks on the blog, or get in touch.
FAQ
What is a good Google Ads Quality Score?
Anything from 7 to 10 is healthy, and 6 with three Average or better components is fine for competitive commercial keywords. Chasing 10 across an account is not a good use of time; a keyword at 7 that converts profitably beats a keyword at 10 that does not. Prioritise by spend, not by score.
How does Google calculate Quality Score?
Google combines three component estimates — expected click-through rate, ad relevance and landing page experience — measured against other advertisers who competed on the same keyword over roughly the previous 90 days, and reports the result on a 1–10 scale. It is a historical summary; the auction itself evaluates quality in real time as part of Ad Rank.
Does Quality Score lower my cost per click?
Indirectly. Higher auction-time ad quality can win a better position at the same bid, or the same position at a lower cost per click. The widely circulated bid-discount tables are third-party estimates, not Google figures, so measure your own CPC at a comparable impression share before and after each component improves.
Why does my keyword show a dash instead of a Quality Score?
The keyword has not accumulated enough exact-match search impressions in the scoring window for Google to produce a reliable estimate. It is not a penalty and not a zero. Either consolidate the keyword into an ad group with more volume, or accept that low-volume terms will not report a score.
How long does it take to improve Quality Score?
Ad relevance and expected CTR usually respond within one to three weeks of a copy or structure change, because both are driven by recent impression and click data. Landing page experience typically takes three to eight weeks, since the page needs enough new traffic to be re-evaluated.
Sources
Google Ads Help: About Quality Score for Search campaigns, About Ad Rank, Using Quality Score to guide optimisations, About the search terms report · Google Ads API reference, ad group criterion quality info fields · Microsoft Advertising Help, quality score documentation, and the Microsoft Advertising blog · web.dev Largest Contentful Paint guidance and PageSpeed Insights · Think with Google search marketing research · WordStream Quality Score resource · LocaliQ 2026 Google Ads benchmarks. All sources accessed August 2026.