



Table of contents
General contracting and remodeling has the worst search-ad conversion rate of any home-services category on record: 2.61%, against a category average of 7.33%. That gap exists while renovation demand itself keeps setting records for spend per project. This page prices what a landing page has to do differently for a five-figure remodel decision than for a $150 drain cleaning, using the 2026 benchmark studies from LocaliQ, WordStream, NAHB, Harvard's Joint Center for Housing Studies and Houzz.
Key Takeaways
- Construction & Contractors converts at just 2.61% on search ads, the lowest of 16 home-services categories.
- The home-services category average is 7.33%, nearly 3x higher.
- Cleaning services convert at 17.65%, the highest of the 16 categories measured.
- Conversion rate fell 14.96% year over year across home services overall.
- Home & Home Improvement's Google Ads CTR is 6.47%, near the cross-industry norm.
- The overall Google Ads conversion rate is 8.18% across 23 industries in 2026.
- NAHB's Remodeling Market Index held at 61 in Q2 2026, in positive territory for a year.
- The large-project component sits at 64, versus 74 for small remodels under $20,000.
- The leads-and-backlog Future Indicators Index slipped to 52 from 54 the prior quarter.
- JCHS projects $519 billion in annual remodeling and repair spending through mid-2027.
- Median Houzz renovation spend held at $20,000 in 2025, with the top 10% at $150,000+.
- Planned 2026 renovation activity fell to 50% of homeowners, down from 52% in 2025.
- Planned median spend for 2026 dropped to $15,000, from $20,000 the year before.
- 91% of 2026 planners say they will move forward with their project regardless.
- Material prices rose 6.7% on average in the same period, per NAHB's Q2 2026 survey.
- 67% of committed remodelers keep or expand scope rather than cut it back.
The conversion gap that names the problem
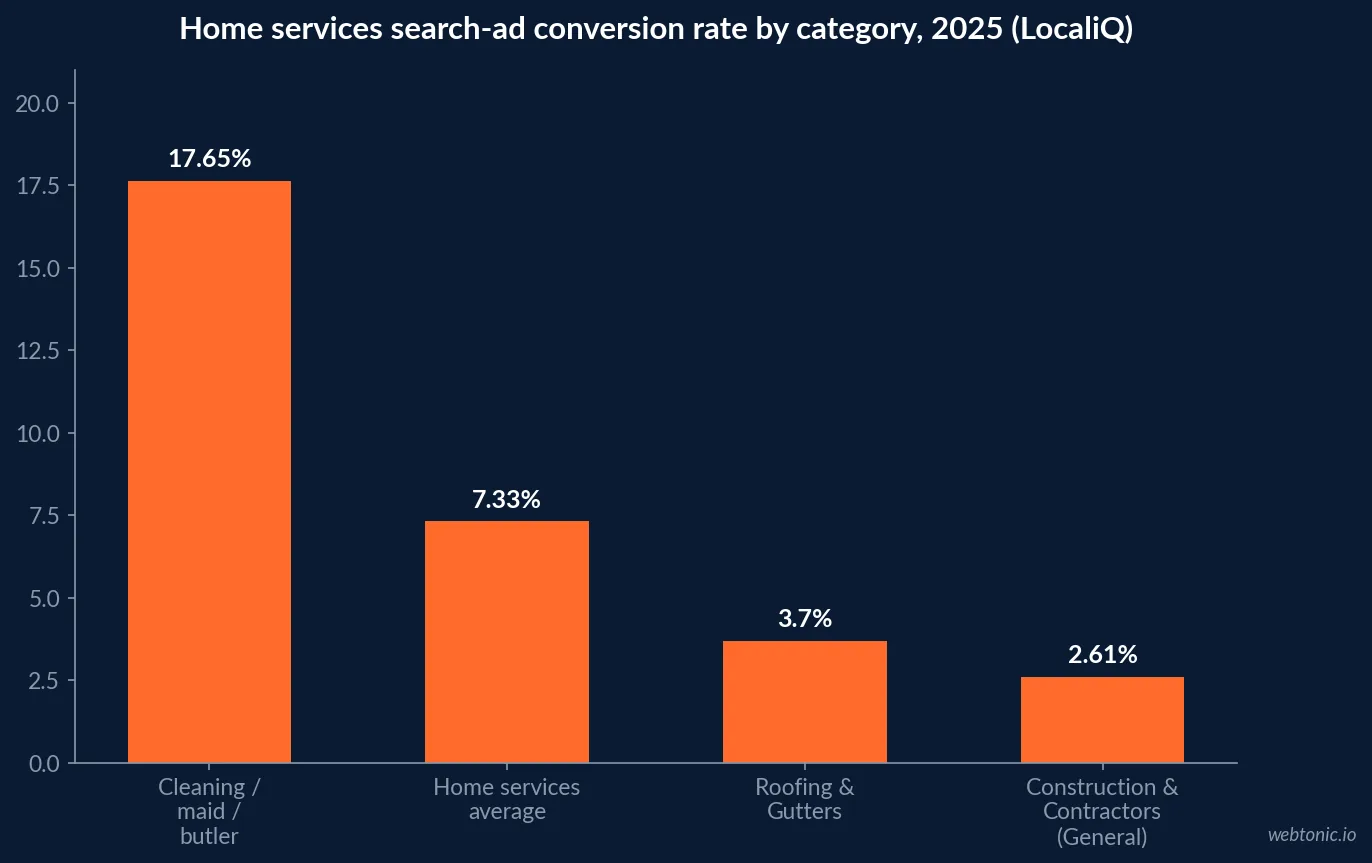
LocaliQ's Home Services Search Advertising Benchmarks report, built from more than 3,000 customer campaigns running April 2024 through March 2025, ranks Construction & Contractors (General) dead last on conversion rate at 2.61%, behind Roofing & Gutters (3.70%) and Doors & Windows Sales (4.41%), and far behind Cleaning/Maid/Butler Services (17.65%) and Window Cleaning (13.58%). The category-wide average across all 16 home-services subcategories is 7.33%, itself down 14.96% year over year as more ad formats crowd the results page.
The pattern is not random. Cheap, fast, low-commitment services convert on the first page. A kitchen remodel or whole-home addition does not, and a landing page built for the first kind of decision will keep losing the second kind of click.
| Home services subcategory (LocaliQ 2025) | Avg. conversion rate | Where it sits |
|---|---|---|
| Cleaning/Maid/Butler Services | 17.65% | Highest of 16 |
| Window Cleaning | 13.58% | 2nd highest |
| Handyman Services | 13.45% | 3rd highest |
| Home services average | 7.33% | Category benchmark |
| Doors & Windows Sales | 4.41% | 3rd lowest |
| Roofing & Gutters | 3.70% | 2nd lowest |
| Construction & Contractors (General) | 2.61% | Lowest of 16 |
The click is fine; the page is where it breaks
WordStream's 2026 Google Ads Benchmarks report, drawn from 13,474 campaigns across 23 industries running April 2025 through March 2026, shows Home & Home Improvement pulling a 6.47% click-through rate, comfortably inside the normal 5.6-9.3% band every industry sits in. The average Google Ads conversion rate across all 23 industries is 8.18% in 2026. Home & Home Improvement's blended conversion figure sits close to that overall average at the account level, which is a different, broader bucket than LocaliQ's narrower "Construction & Contractors (General)" subcategory used above; the two studies are not directly comparable line for line, but both agree the ad itself is not the weak link. If the click arrives at a normal rate and still fails to convert, the landing page carries the blame.
| Metric (2026, cross-industry) | Home & Home Improvement / Construction | All-industry figure |
|---|---|---|
| Google Ads CTR | 6.47% | 5.6% - 9.3% typical range |
| Google Ads conversion rate (WordStream, broader category) | 8.05% | 8.18% average |
| LocaliQ search-ad conversion rate (narrower subcategory) | 2.61% | 7.33% home-services average |
| YoY conversion rate change, home services | -14.96% | +6.84% overall search ads |
What the traffic is actually worth
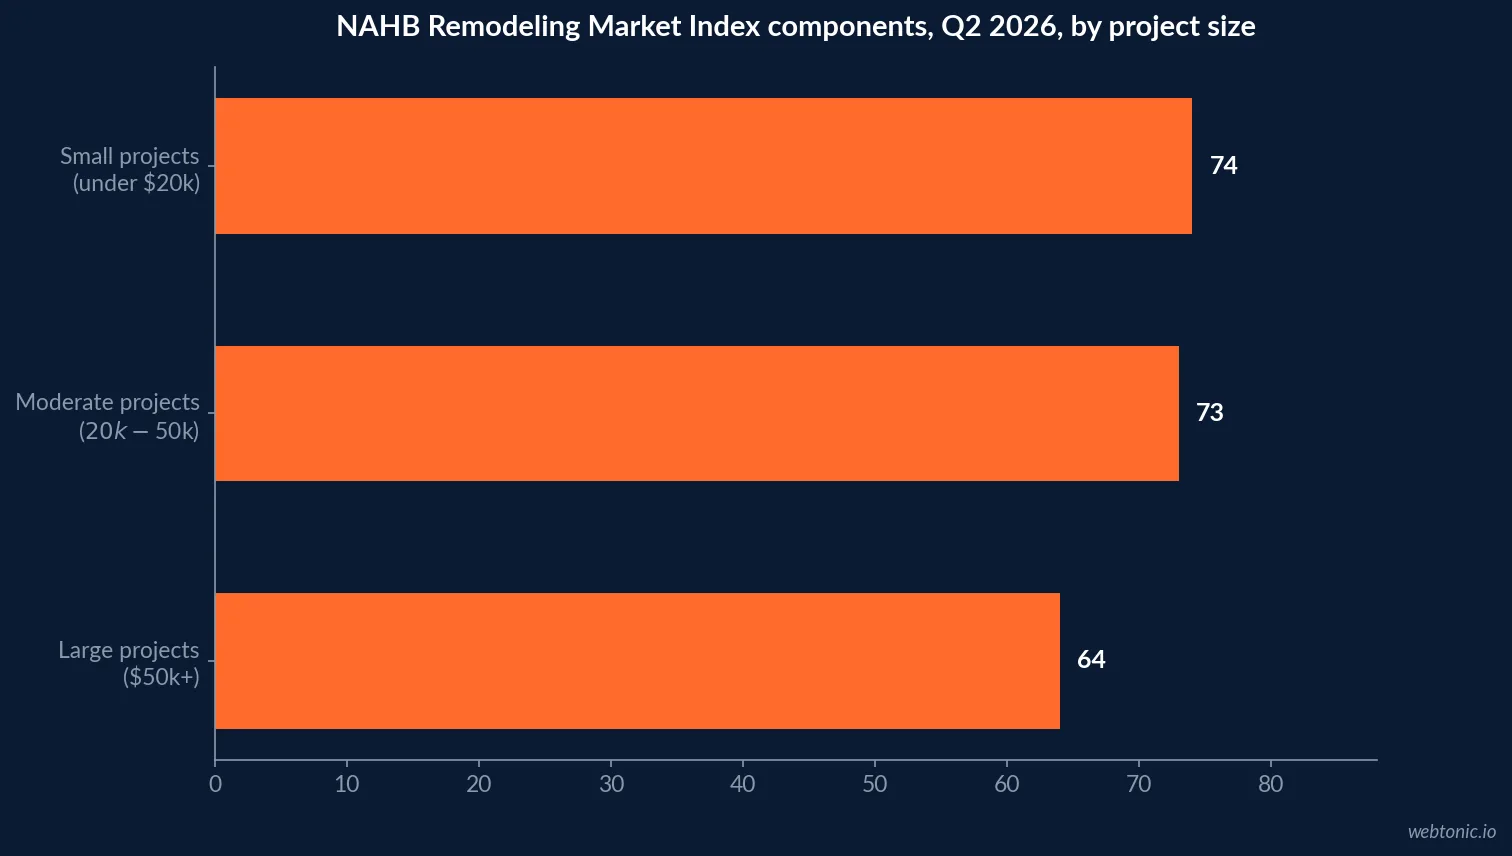
Every one of those clicks is chasing a bigger prize than most home-services categories offer. NAHB's Remodeling Market Index (RMI) posted 61 in Q2 2026, down one point from the prior quarter but holding in the low 60s for a full year, a level NAHB attributes to mortgage rate lock-in and record home equity pushing owners to renovate instead of move. Harvard's Joint Center for Housing Studies (JCHS) projects annual home improvement and repair spending of $519 billion through mid-2027, even as growth decelerates. Houzz's 2026 U.S. Houzz & Home Study found median renovation spend held at $20,000 in 2025, with the top 10% of projects reaching $150,000 or more, up from $140,000 the year prior.
| Remodeling demand indicator (NAHB/JCHS/Houzz, 2026) | Figure |
|---|---|
| NAHB Remodeling Market Index, Q2 2026 | 61 (positive territory) |
| RMI large-project component ($50k+) | 64 |
| RMI moderate-project component ($20k-$50k) | 73 |
| RMI small-project component (under $20k) | 74 |
| RMI leads-and-inquiries component | 51 |
| JCHS projected annual remodeling spend through mid-2027 | $519 billion |
| Houzz median renovation spend, 2025 | $20,000 |
| Houzz top 10% of project spend, 2025 | $150,000+ |
The pipeline is softening even as commitment holds
The same Houzz study that tracks record top-end spend also shows caution building underneath it: 50% of homeowners plan a 2026 renovation, down from 52% in 2025, and planned median spend fell from $20,000 to $15,000. NAHB's own Future Indicators Index, the half of the RMI that tracks current lead flow and project backlog, slipped to 52 in Q2 2026 from 54 the prior quarter, with the leads-and-inquiries component alone down to 51. Material prices rose an average of 6.7% over the same window, per NAHB, adding pressure to a homeowner already trimming scope.
Yet Houzz's separate 2026 Renovation Plans study found 91% of homeowners with a planned project say they will move forward regardless, and 67% will keep or expand scope rather than cut it. Softer intent numbers do not mean the buyer disappears; they mean the buyer is pickier about who gets the job, which is exactly the moment a landing page's proof elements start to matter more than its ad spend.
| Signal | 2025 | 2026 | Direction |
|---|---|---|---|
| Homeowners planning a renovation | 52% | 50% | Softening |
| Planned median renovation spend | $20,000 | $15,000 | Softening |
| NAHB Future Indicators Index (leads/backlog) | 54 | 52 | Softening |
| Homeowners moving forward regardless of caution | n/a | 91% | Resilient |
| Homeowners keeping or expanding project scope | n/a | 67% | Resilient |
Five fixes a 2.61%-converting landing page is usually missing
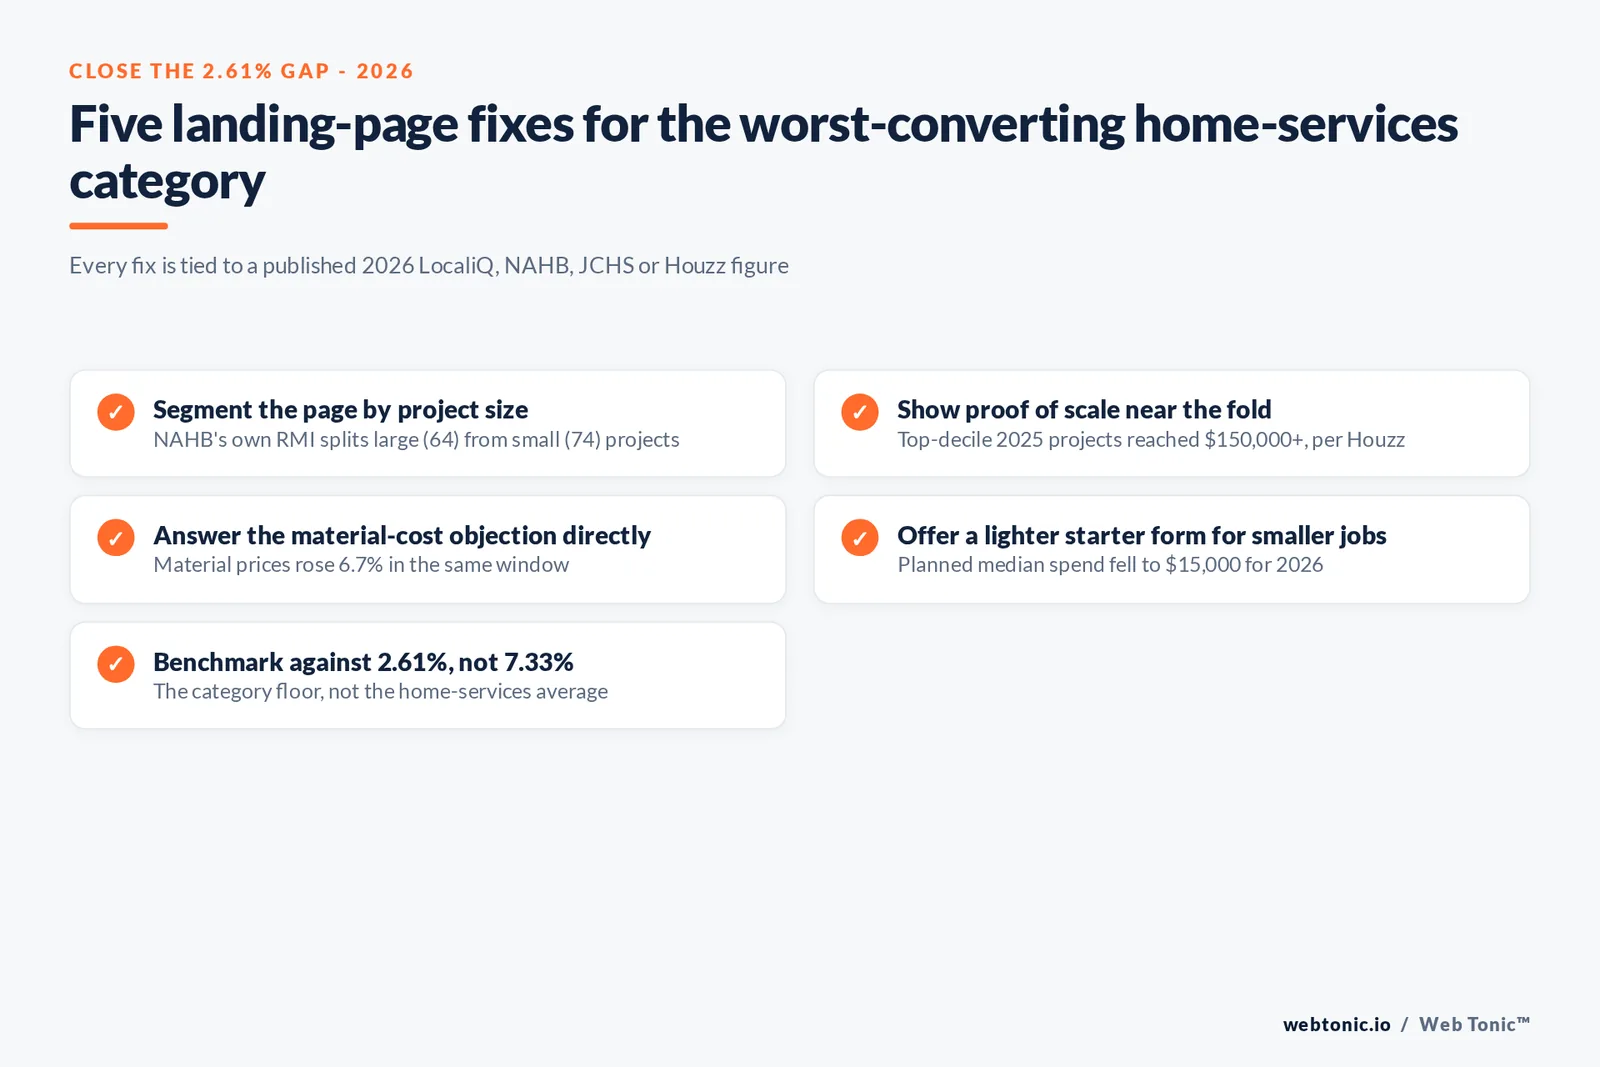
- Segment by project size. NAHB's own components (64 large vs. 74 small) show buyers behave differently by budget tier; one generic "get a quote" form ignores that split.
- Put proof of scale near the fold. With top-decile projects now at $150,000+, a page needs a past-project gallery sized to match, not a handyman-style before/after strip.
- Answer the material-cost question directly. A 6.7% material price jump is a live objection; a financing or price-lock section addresses it before the visitor bounces.
- Shorten the form for the softening segment. With planned median spend down to $15,000, some visitors are now closer to a handyman decision; a lighter-weight starter form can capture them without losing the large-project path.
- Track conversion rate against the 2.61% category floor, not the 7.33% home-services average. Judging a remodeling landing page against the wrong benchmark hides real gains.
The trust layer a landing page has to pass first
Before a remodeling click ever converts, it clears a review filter most home-services categories do not face at the same intensity. BrightLocal's 2026 Local Consumer Review Survey, a representative panel of over 1,000 U.S. adults, found 41% of consumers now "always" read reviews before choosing a local business, up from 29% in 2025, and 31% will not use a business rated below 4.5 stars, nearly double the 17% who said the same a year earlier. A remodeling landing page that sends traffic straight to a quote form without visible reviews above the fold is losing a meaningful share of that 2.61% before the form ever loads.
Volume matters as much as the score: BrightLocal also found 47% of consumers will not use a business with fewer than 20 reviews, and 74% only trust reviews from the last three months. A remodeling company's landing page and its Google Business Profile are now part of the same conversion funnel, not two separate assets.
| BrightLocal 2026 Local Consumer Review Survey signal | 2025 | 2026 |
|---|---|---|
| Consumers who "always" read reviews first | 29% | 41% |
| Require a 4.5+ star rating minimum | 17% | 31% |
| Require at least a 4-star rating | 55% | 68% |
| Will not use a business with under 20 reviews | n/a | 47% |
| Only trust reviews from the last 3 months | n/a | 74% |
What the click is actually telling the contractor
CallRail's "From Conversations to Conversions" report, built from 1.1 million de-identified leads across seven industries including home services, found the same three channels driving the most conversations in every industry measured: Google Ads at 37%, Google My Business at 23%, and organic search at 22%. For qualified leads specifically, the order shifts to Google Ads (47%), organic search (23%) and Google My Business (15%). A landing page built for search-ad traffic is therefore built for the channel already carrying the largest share of qualified volume, which raises the stakes on fixing its 2.61% conversion rate rather than assuming a different channel will quietly outperform it.
| Channel (CallRail, 1.1M leads across industries) | Share of all conversations | Share of qualified leads |
|---|---|---|
| Google Ads | 37% | 47% |
| Google My Business | 23% | 15% |
| Organic search | 22% | 23% |
Where this fits with the rest of the funnel
Landing-page CRO only pays off once qualified traffic is already arriving; our Google Ads pricing breakdown and conversion rate benchmarks cover the channel side of that equation. If your remodeling company's landing pages are still judged against a generic home-services average instead of the category's real 2.61% floor, our performance creative team can rebuild the page around the project-size segmentation above, or talk to us about where the biggest gap sits.
Frequently Asked Questions
Why does general contracting convert worse than other home services on search ads?
LocaliQ's 2025 Home Services Search Advertising Benchmarks report, built from more than 3,000 customer campaigns running April 2024 through March 2025, puts the average conversion rate for Construction & Contractors (General) at just 2.61%, the lowest of the 16 subcategories it tracks, against a home-services average of 7.33% and a category high of 17.65% for cleaning services. A remodeling click carries a five- or six-figure decision behind it, so visitors compare several contractors before ever filling out a form, and a landing page built like a cleaning-service page cannot close that gap.
Is the problem the ad or the landing page?
Both LocaliQ studies isolate the page from the click. WordStream's 2026 Google Ads Benchmarks report, covering 13,474 campaigns across 23 industries from April 2025 through March 2026, puts Home and Home Improvement's average click-through rate at 6.47%, roughly in line with the 6-9% band most industries sit in, meaning the ad itself is doing its job. The conversion rate is where the category falls apart, which points at the landing page and the offer on it, not the targeting.
How big is the renovation demand this traffic represents?
Large and growing more resilient than new construction. NAHB's Remodeling Market Index held at 61 in Q2 2026, in positive territory for a full year, and Harvard's Joint Center for Housing Studies projects annual home improvement and repair spending of $519 billion through mid-2027. Houzz's 2026 U.S. Houzz & Home Study found median renovation spend held at $20,000 in 2025 with the top 10% of projects reaching $150,000 or more, so every wasted click is a shot at a five-figure job.
What is softening in the pipeline right now?
Planned activity, not completed spend. Houzz's 2026 Renovation Trends Study found 50% of homeowners plan a project in 2026, down from 52% in 2025, with median planned spend falling to $15,000 from $20,000, while NAHB's Future Indicators Index (leads and backlog) slipped to 52 in Q2 2026 from 54 the prior quarter. A softer pipeline makes every landing-page conversion point worth more, not less.
What should a remodeling contractor's landing page test first?
Match the page to the project size the ad targeted, since NAHB's own RMI splits large ($50,000+), moderate ($20,000-$50,000) and small (under $20,000) projects, and each behaves differently: the large-project component sat at 64 in Q2 2026 versus 74 for small jobs, a resilience gap the landing page should mirror with different proof (financing, past large-project galleries) rather than one generic quote form for every budget tier.
Sources
LocaliQ/WordStream - Home Services Search Ads Benchmarks 2025
LocaliQ - 2025 Search Ad Benchmarks for Home Services
WordStream - Search Advertising Benchmarks by Industry 2026
WordStream - Google Ads Benchmarks 2026
NAHB - Remodeling Market Index, Q1 2026
NAHB - Remodeling Market Index Full Report, Q2 2026
Harvard Joint Center for Housing Studies - Leading Indicator of Remodeling Activity, July 2026
Houzz - 2026 U.S. Houzz and Home Renovation Trends Study
Houzz - 2026 U.S. Houzz & Home Study press release
Houzz - 2026 U.S. Homeowner Renovation Plans Report
BrightLocal - Local Consumer Review Survey 2026
CallRail - From Conversations to Conversions: How Small Businesses Can Market Smarter


