



Table of contents

Franchise lifecycle marketing has two audiences — the consumer who returns to a location, and the franchisee who renews, transfers or exits the system — and only the second one has real disclosure-grade data behind it. This page uses Franchise Disclosure Document (FDD) churn tables and IFA/FRANdata's own economic model, not SaaS-style net revenue retention.
Key Takeaways
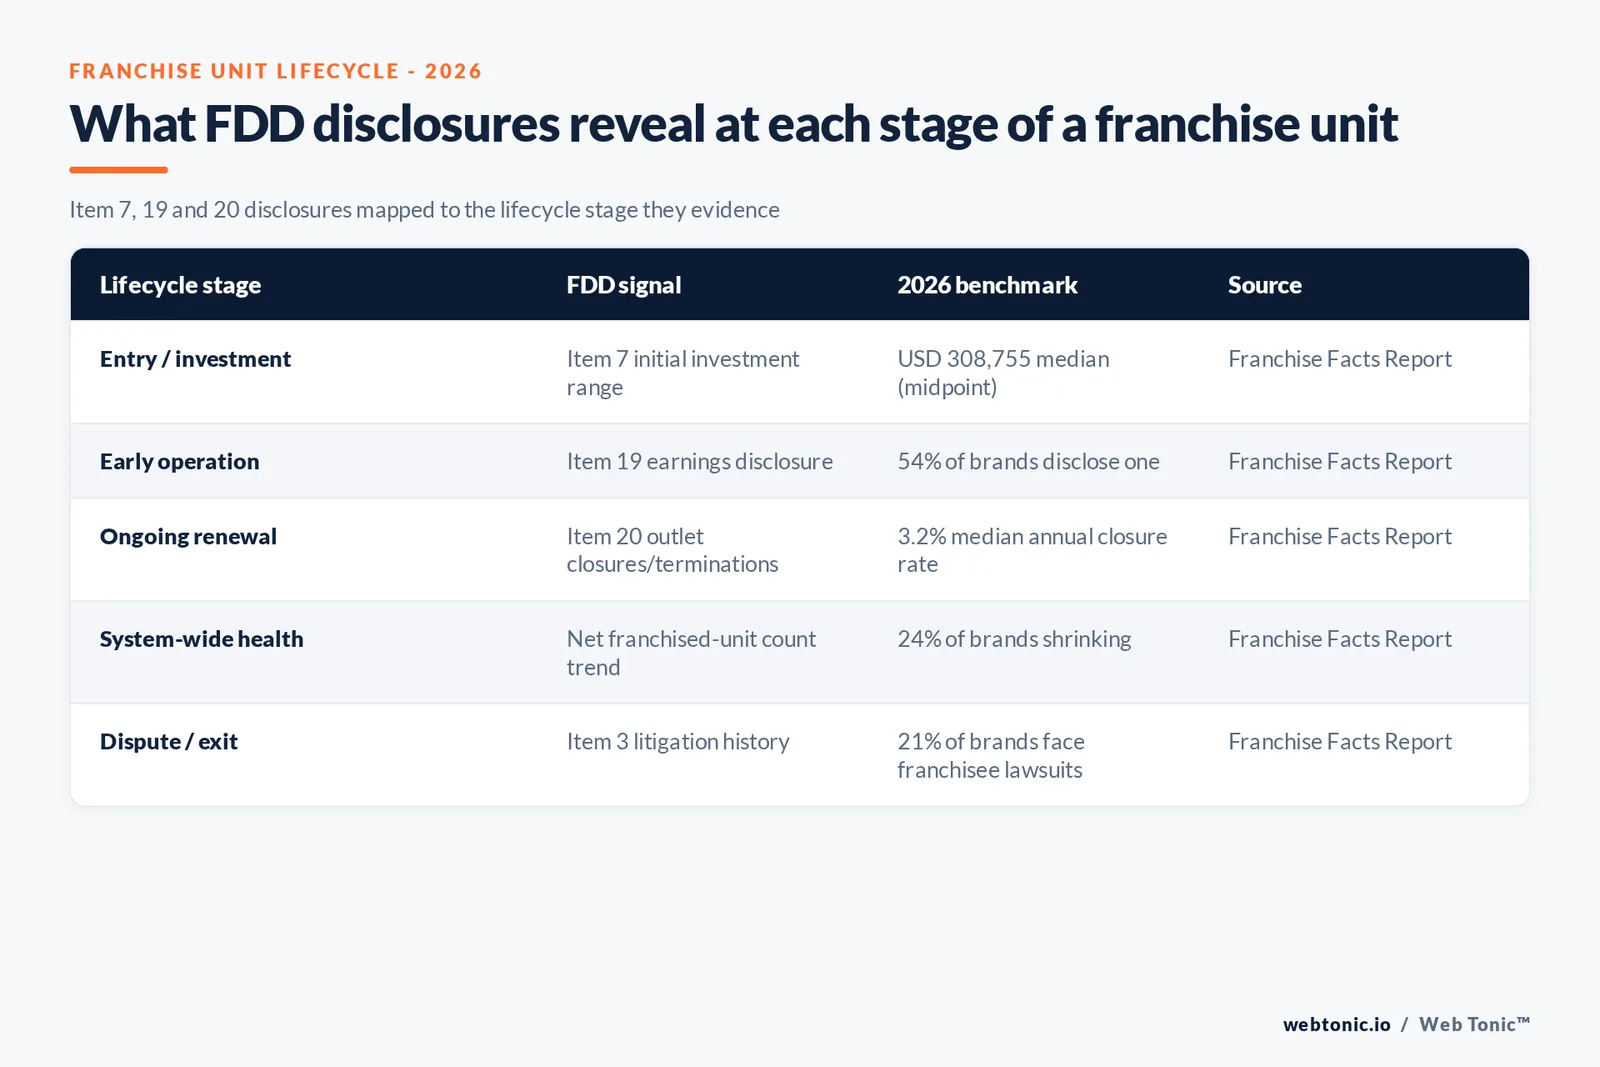
- Median annual franchised-outlet closure rate is 3.2%, from 1,446 brands with parsed FDD Item 20 tables.
- 24% of 2,430 brands had a shrinking franchised network in their latest reported year.
- 21% of brands face at least one franchisee-initiated lawsuit, 1,324 total across the corpus.
- Median total initial investment is USD 308,755 across 2,483 brands.
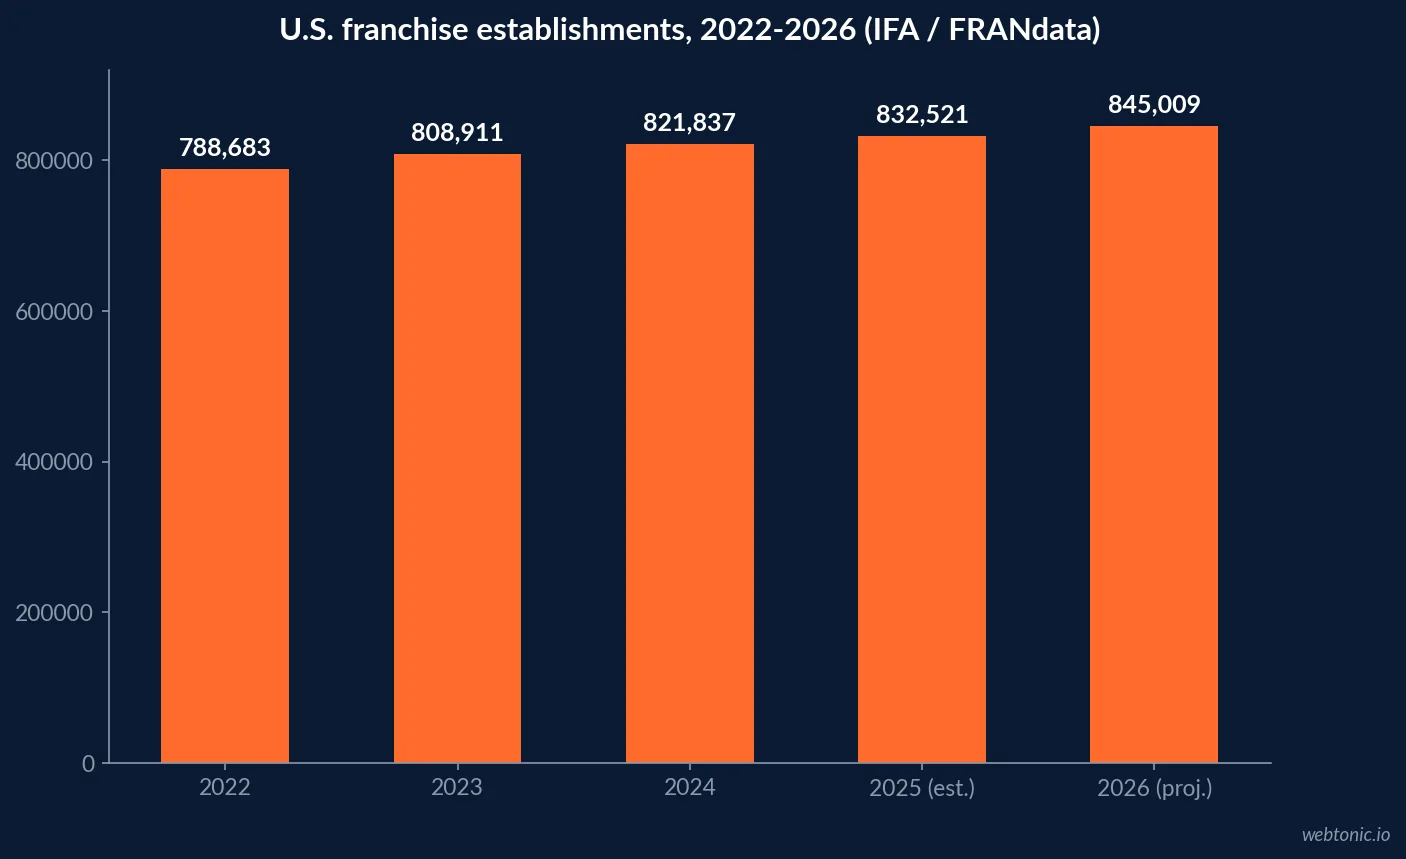
- U.S. franchise establishments are projected to grow 1.5% to ~845,000 units in 2026.
- That is up from 832,521 in 2025 and 788,683 in 2022.
- Franchise employment is projected to grow 1.8% to nearly 8.9 million jobs.
- Franchise GDP output is projected at USD 558.4 billion, almost 3% of U.S. GDP.
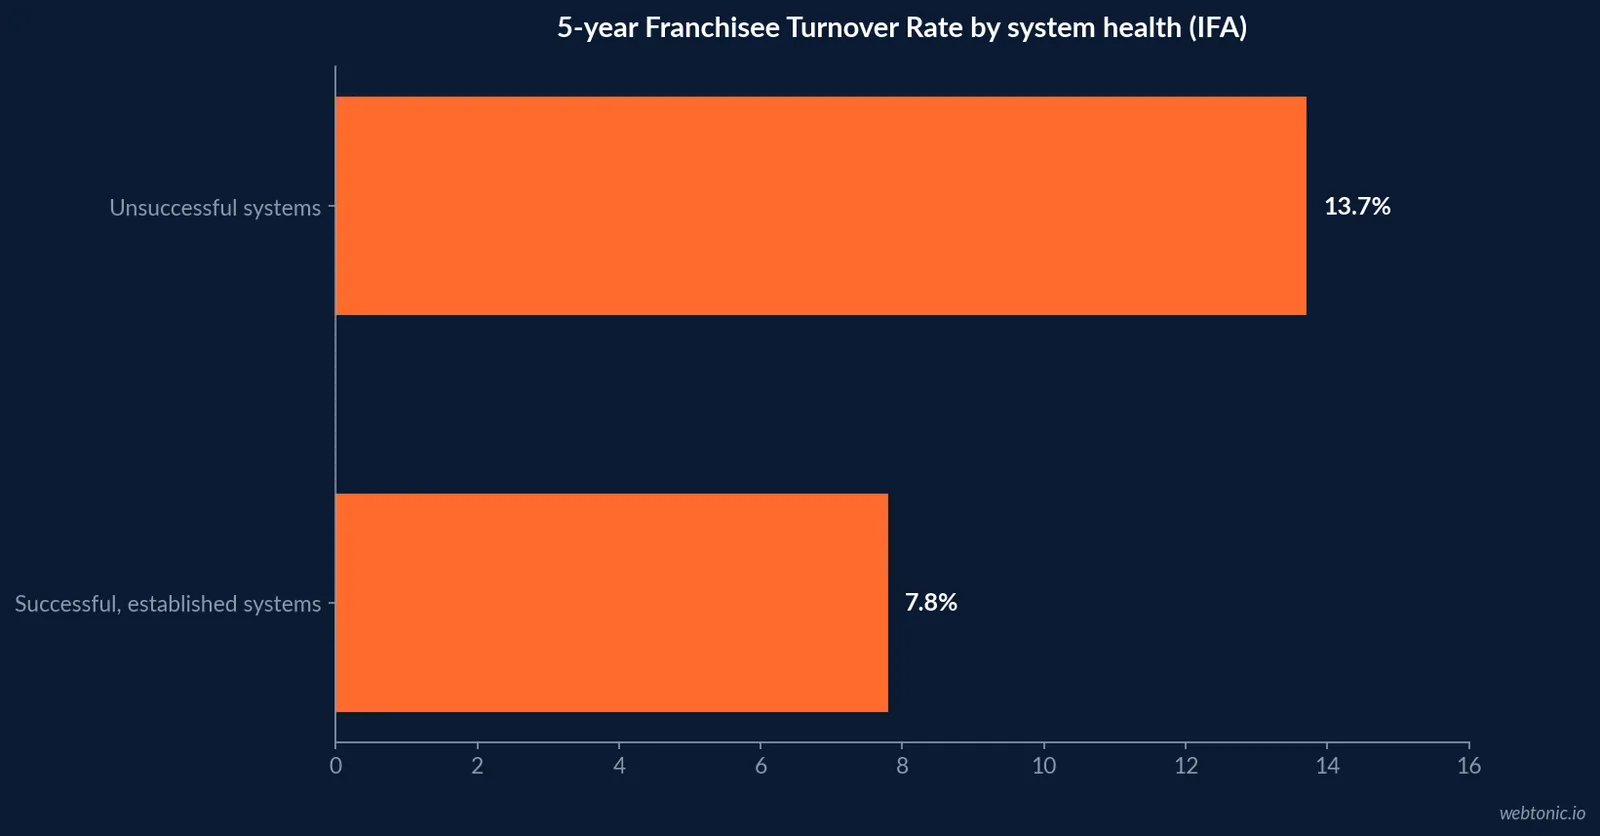
- Successful franchise systems run a 7.8% five-year Franchisee Turnover Rate (IFA).
- Unsuccessful systems run 13.7% — nearly double.
- 54% of franchise brands disclose an Item 19 earnings representation; the rest disclose none.
- 47% of franchisees cited labor as a significant challenge in 2023, easing to 26% in 2024 (IFA Annual Franchisee Report).
Benchmarks at a glance
| Metric | Figure | Source |
|---|---|---|
| Median annual outlet closure rate (FDD Item 20) | 3.2% | Franchise Facts Report (2026, 1,446 brands) |
| Share of brands with shrinking networks | 24% (582 of 2,430) | Franchise Facts Report (2026) |
| Franchisee Turnover Rate, successful systems | 7.8% | IFA (2016) |
| Franchisee Turnover Rate, unsuccessful systems | 13.7% | IFA (2016) |
| Franchise establishments, 2026 projected | ~845,000 | IFA/FRANdata 2026 Outlook |
| Franchise GDP contribution, 2026 projected | USD 558.4B (~3% of GDP) | IFA/FRANdata 2026 Outlook |
The only disclosure-grade churn number: FDD Item 20
No federal or state agency publishes a franchise "failure rate." The closest measurable signal is Item 20 of the Franchise Disclosure Document, where franchisors are legally required to disclose outlet closures, terminations, non-renewals and transfers. Franchise Facts Report parsed over 3,000 FDDs filed 2023-2026 and, among the 1,446 brands whose Item 20 churn tables parse cleanly, found a median annual franchised-outlet closure rate of 3.2%. Separately, among 2,430 brands with usable outlet counts, 24% (582 brands) had a shrinking franchised network in their latest reported year — a broader and arguably more useful retention signal than the closure rate alone, since it nets closures against new unit openings.
What separates low-churn systems from high-churn systems
IFA's Metrics of Successful Franchise Systems analysis (2016 — dated, but still the clearest published comparison of this kind) found successful, established franchise systems run a 7.8% Franchisee Turnover Rate versus 13.7% for unsuccessful systems, where turnover is measured as outlets terminated or that ceased operating over a five-year window. Successful systems also skew toward transfers between existing franchisees rather than outright terminations, which is a materially healthier way to lose a unit than a termination or non-renewal.
| System type | 5-yr Franchisee Turnover Rate | Turnover composition |
|---|---|---|
| Successful, established systems | 7.8% | More transfers, fewer terminations |
| Unsuccessful systems | 13.7% | More terminations and ceased operations |
Legal and cost signals that track lifecycle health
Litigation volume is itself a lifecycle indicator: 413 of 1,987 brands with countable Item 3 disclosures (21%) disclose at least one franchisee-initiated proceeding, totalling 1,324 franchisee-vs-franchisor lawsuits across the Franchise Facts Report corpus. On entry cost, the median total initial investment across 2,483 brands is USD 308,755 (the midpoint of each brand's disclosed Item 7 range), though category medians vary widely and higher entry cost alone does not predict lower churn in the published data.
Operating conditions also move the retention needle: IFA's 2024 Annual Franchisee Report found labor recruitment and retention concerns eased from 47% of franchisees citing it as a significant challenge in 2023 to 26% in 2024, even as 87% still reported moderate to substantial impact from inflationary pressure and 80% reported lower business earnings that year.
| Signal | Figure | Read |
|---|---|---|
| Brands with an Item 19 earnings disclosure | 54% (1,627 of 3,018) | Rest disclose no earnings at all |
| Brands with a franchisee lawsuit disclosed | 21% (413 of 1,987) | 1,324 total lawsuits in corpus |
| Median total initial investment | USD 308,755 | Midpoint of Item 7 range, 2,483 brands |
| Franchisees citing labor as top challenge | 26% (2024) | Down from 47% in 2023 |
The sector-level growth picture
Against that unit-level churn picture, the IFA/FRANdata 2026 Franchising Economic Outlook projects continued net growth: franchise establishments up 1.5% to about 845,000 units in 2026 (from 832,521 estimated for 2025 and 788,683 in 2022), employment up 1.8% to nearly 8.9 million jobs, and franchise GDP output up 1.8% to USD 558.4 billion, almost 3% of total U.S. GDP. Net sector growth and a 24% shrinking-network share are not a contradiction — they describe an industry where new brands and expanding systems are offsetting churn concentrated in a minority of underperforming systems.
| Year | Franchise establishments | Employment | GDP output |
|---|---|---|---|
| 2022 | 788,683 | 8,421,798 | $499.2B |
| 2023 | 808,911 | 8,596,340 | $531.8B |
| 2024 | 821,837 | 8,735,908 | $543.7B |
| 2025 (est.) | 832,521 | 8,788,313 | $549.9B |
| 2026 (proj.) | 845,009 | 8,944,955 | $558.4B |
Franchise vs. independent small business retention signals
| Dimension | Franchise (disclosure data) | Independent small business |
|---|---|---|
| Retention proxy | FDD Item 20 outlet closures/terminations | No standardized public disclosure |
| System-level split | 7.8% turnover (successful) vs 13.7% (unsuccessful) | Rarely measured comparably |
| Growth trajectory | +1.5% establishments projected for 2026 | Varies by NAICS code, less centralized data |
| Legal exposure signal | 21% of brands disclose franchisee lawsuits | Not centrally disclosed |
Reading the FDD churn data without over-claiming
Two caveats matter for anyone using this data in a marketing deck. First, the 1,446-brand closure sample and the 2,430-brand shrinking-network sample are not identical cohorts — some brands disclose clean Item 20 tables but not usable outlet counts, or vice versa, so the two percentages describe overlapping but distinct populations, not the same 3.2% number restated. Second, FDD disclosures are franchisor-reported, not independently audited by a third party, so a system with unusually clean Item 20 tables is not automatically a system with unusually clean operations — it may simply have better legal and compliance resourcing.
Where franchise marketing teams should point lifecycle budget
- Track the Item 20 closure/shrinking-network signal for your own system and against category peers — it is the only disclosure-grade retention number that exists.
- Bias franchisee-facing retention programs toward converting terminations into transfers, since that is the structural difference between the 7.8% and 13.7% cohorts.
- Treat the 26%-citing-labor-as-top-challenge figure as a leading indicator — franchisee operating stress in 2023-2024 preceded, rather than followed, unit closures in that window.
- Report unit-level retention to prospective franchisees alongside the sector's 1.5% growth headline, not instead of it.
- Pair FDD-derived churn data with brand-level SBA charge-off rates when evaluating a system's real unit-level risk — the two data sources rarely move together, and the gap itself is informative.
Common mistakes in franchise lifecycle marketing
- Quoting a single sector-wide "franchise failure rate" when no agency publishes one — Item 20 closure data is brand-specific and should be reported that way.
- Ignoring the transfer-vs-termination distinction, which is the real difference between a 7.8% and a 13.7% turnover system, not the headline number alone.
- Treating sector growth (+1.5% establishments) as proof of unit-level health, when 24% of brands are simultaneously shrinking.
What SBA loan data shows about franchise-level risk
The SBA Franchise Index, a third-party analysis built directly from the SBA's own public 7(a) loan-level FOIA records (FY2010-2026, 81,779 loans totalling USD 66.2 billion), aggregates 7(a) charge-off rates by individual franchise brand — a lender's-eye view of which systems are actually defaulting, separate from the FDD-based closure data above. Charge-off rates in the published index range from under 0.5% for brands like The UPS Store (0.2%) and Primrose Schools (0.0%) up to 7.1% for Anytime Fitness and 5.7% for Subway, illustrating that unit-level financial risk varies far more by brand than any single sector-wide churn number suggests.
| Franchise brand (example) | SBA 7(a) charge-off rate | SBA loans (FY2010-2026) |
|---|---|---|
| The UPS Store | 0.2% | 1,573 |
| Primrose Schools | 0.0% | 571 |
| Ace Hardware | 2.2% | 800 |
| Firehouse Subs | 4.6% | 612 |
| SUBWAY | 5.7% | 1,276 |
| Anytime Fitness | 7.1% | 1,128 |
What the IFA/FRANdata franchisee survey adds on labor and cost pressure
The 2024 IFA/FRANdata Franchisee Survey Report, representing 290 brands and 1,407 respondents who collectively own more than 8,200 franchise units across 26 industries, found 68% of franchisees faced labor difficulties in the prior year and 87% reported a moderate to substantial inflation impact, both of which are leading indicators for the unit-level churn captured in Item 20 disclosures a year or two later. FRANdata's own economic outlook archive is the modeling engine behind the IFA growth projections cited above, tracking roughly 9,000 franchise brands directly from FDD filings and macroeconomic indicators.
Related benchmarks
For adjacent lifecycle and retention data outside franchising, see Web Tonic's customer retention statistics page, or the growth marketing and contact pages for how a franchise-system retention program gets scoped.
Frequently Asked Questions
What is the actual franchise unit closure rate?
No agency publishes an official "failure rate." The closest measurable proxy is FDD Item 20, where franchisors disclose outlet closures, terminations and non-renewals. Franchise Facts Report's analysis of 1,446 brands with cleanly parsed Item 20 churn tables (from a corpus of over 3,000 disclosure documents filed 2023-2026) puts the median annual franchised-outlet closure rate at 3.2%, and separately finds 24% of 2,430 brands with outlet counts had a shrinking franchised network in their latest reported year.
How fast is the franchise sector growing overall?
IFA and FRANdata's 2026 Franchising Economic Outlook projects U.S. franchise establishments to grow 1.5% to about 845,000 units in 2026, up from 832,521 estimated for 2025 and 788,683 in 2022. Employment is projected to grow 1.8% to nearly 8.9 million jobs, and franchise GDP contribution to grow 1.8% to USD 558.4 billion, or almost 3% of total U.S. GDP.
What separates a low-churn franchise system from a high-churn one?
IFA's older Metrics of Successful Franchise Systems analysis (2016, and still the clearest published comparison) found successful, established franchise systems run a 7.8% Franchisee Turnover Rate (units terminated or that ceased operating over five years) versus 13.7% for unsuccessful systems. Successful systems also show more of their turnover coming from transfers between franchisees rather than outright terminations, which is a healthier churn mix even at a similar headline number.
Do franchisees actually get sued by their franchisors, or the reverse?
Franchise Facts Report's corpus shows 413 of 1,987 brands with countable Item 3 disclosures (21%) disclose at least one franchisee-initiated legal proceeding, totalling 1,324 franchisee-vs-franchisor lawsuits across the dataset. That is a lifecycle signal in itself: litigation volume tends to concentrate in systems already showing higher unit turnover.
What does it cost to buy into a franchise, and does that affect retention?
The median total initial investment across 2,483 brands in the Franchise Facts Report corpus, taken as the midpoint of each brand's FDD Item 7 range, is USD 308,755. Category medians vary widely. Higher entry cost does not map cleanly to lower churn in the published data, but IFA's turnover comparison suggests system support and unit economics matter more than sticker price for whether a franchisee stays through a full unit lifecycle.
Sources
Franchise Facts Report — Franchise Disclosure Statistics (2026, 3,000+ FDDs)
International Franchise Association — 2026 Franchising Economic Outlook
IFA / FRANdata — 2026 Franchising Economic Outlook (full report)
IFA — The Metrics of Successful Franchise Systems (2016)
IFA — 2024 Annual Franchisee Report
SBA Franchise Index — 7(a) Loan Charge-Off Rates by Brand
FRANdata — Franchising Economic Outlook 2026 (report archive)


