Table of contents
A franchise brand runs two demand-generation funnels, not one. One sells territories to prospective franchise owners; the other sells to end customers at each of the roughly 845,000 US franchise locations open in 2026 (IFA/FRANdata). They use different budgets, different buying-group dynamics and different channel mixes, and treating them as a single "franchise marketing" line item is the fastest way to misallocate both.
Key Takeaways
- US franchising supports 845,000 establishments in 2026, up 1.5% year over year (IFA/FRANdata).
- Franchise economic output reached USD 921.4 billion in 2026, up 1.6%.
- More than 12,000 new franchised businesses were projected to open in 2026.
- Local/regional co-op marketing funds run 1% to 3% of franchisee revenue in most systems (Franchising.com).
- 50% of surveyed service (non-storefront) franchises require a 5% local fund contribution.
- The national fund draws 1% to 2% of franchisee revenue for most systems, per Franchise Update Media's AFMR.
- Enterprise B2B buying groups average 5 to 11 stakeholders (Gartner) - the closest proxy for franchise-candidate decisions.
- The 95-5 rule (Ehrenberg-Bass Institute / LinkedIn B2B Institute) puts only 5% of a B2B audience in-market at once.
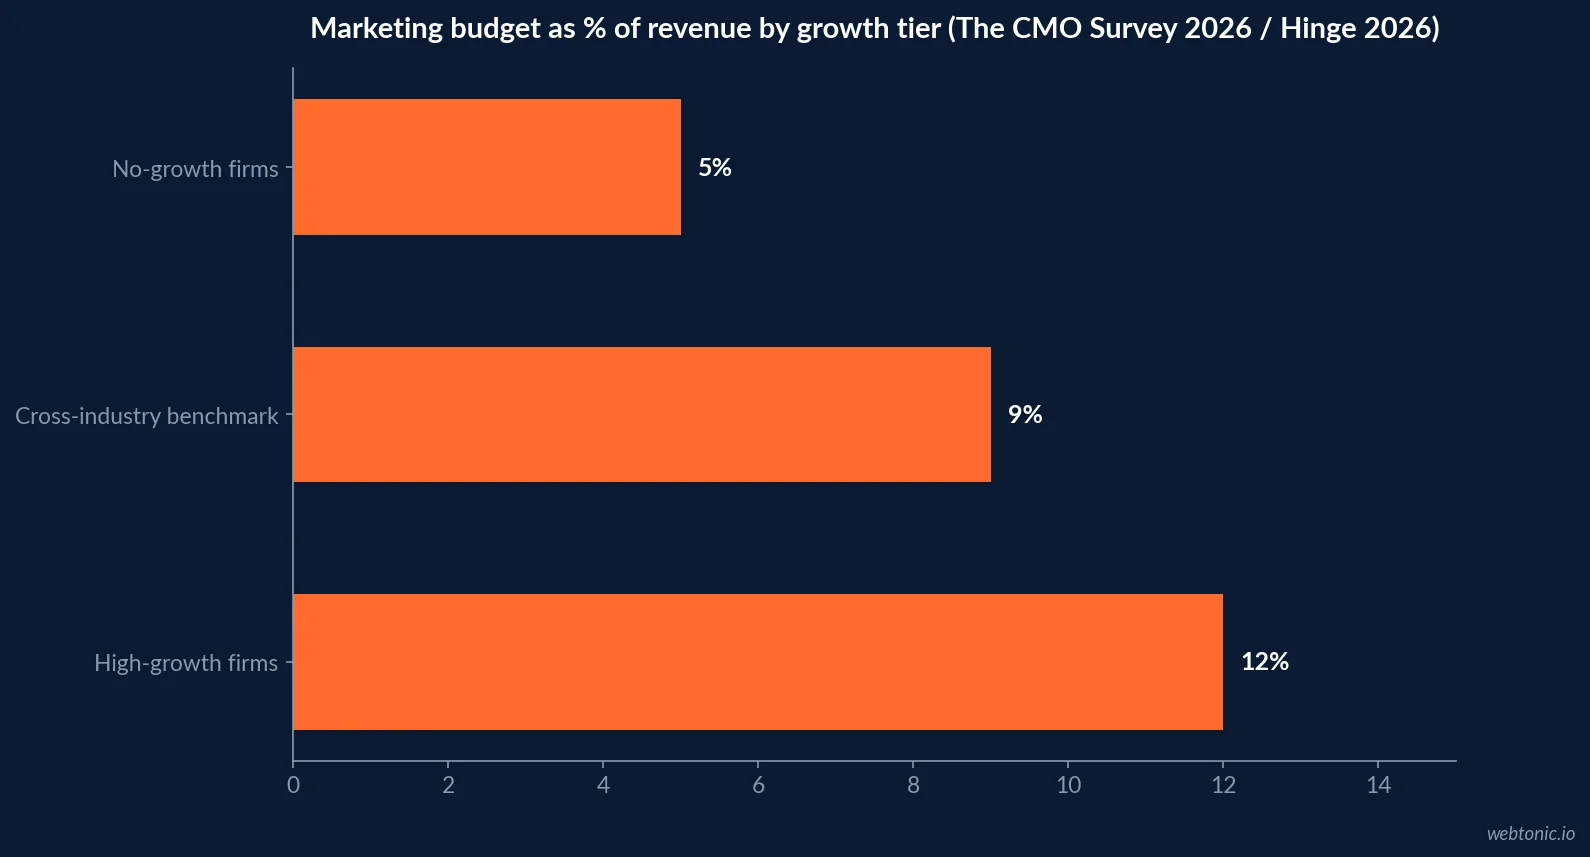
- The CMO Survey 2026 puts overall marketing budgets at 9.0% of revenue, the baseline most local operators start a plan from.
- High-growth professional/franchise-adjacent service firms spend roughly 12% of revenue on marketing versus 5% for no-growth firms (Hinge 2026).
- BrightLocal's 2026 data shows 47% of consumers reject a business with fewer than 20 reviews - a location-level demand-gen headwind, not a brand-level one.
- 74% of consumers only weigh reviews from the last 3 months, meaning demand generation and reputation work compound at the location level.
| Franchise system scale (2026) | Figure | Source |
|---|---|---|
| US franchise establishments | 845,000, +1.5% YoY | IFA / FRANdata |
| Franchise employment | 8.9 million, +1.8% YoY | IFA / FRANdata |
| Franchise economic output | USD 921.4 billion, +1.6% YoY | IFA / FRANdata |
| New franchised businesses projected to open | 12,000-plus | IFA / FRANdata via PR Newswire |
Two funnels, two buyers, one brand
Franchise development demand generation exists to fill a pipeline of qualified candidates for territories - a low-volume, high-consideration funnel closer to enterprise sales than to consumer marketing. Location-level demand generation exists to fill the door of each of the 845,000 operating US franchise establishments (IFA's 2026 Franchising Economic Outlook with FRANdata) with ordinary consumer-style tactics. A brand that reports one blended "marketing ROI" number across both is hiding which funnel is actually underperforming.
The system generated USD 921.4 billion in economic output in 2026 and is projected to add more than 12,000 new units - both figures describe the location-level funnel's scale, since a franchise agreement itself is a one-time transaction that development marketing exists to produce, not a repeat purchase.
Funnel 1: selling territories to franchise candidates
No franchise-specific version of the major B2B buyer-behavior surveys exists, so the closest documented proxy is general enterprise B2B buying research, labeled here as a cross-industry benchmark rather than a franchise-measured figure. Forrester's B2B buying-group research frames purchases as decided by buying networks rather than single buyers, and Gartner's published B2B buying-journey framework puts the average enterprise buying group at 5 to 11 stakeholders spanning roughly five distinct functions. A franchise agreement - often a six-figure commitment involving a spouse, an accountant, and sometimes a lender - maps onto that multi-stakeholder shape more closely than a single-visit retail sale.
The 95-5 rule, credited to Professor John Dawes of the Ehrenberg-Bass Institute and popularized through the LinkedIn B2B Institute, holds that only about 5% of a B2B category is in-market to buy at any given moment. For franchise development, that argues for sustained brand-awareness spend (webinars, founder content, press) that reaches the 95% not ready to sign yet, rather than funding candidate demand entirely from bottom-funnel lead capture.
| Franchise development demand-gen lever | What it does | Buying-group stage it serves |
|---|---|---|
| Franchise portals and broker networks | Aggregates active searchers, high intent | Late-stage, in-market 5% |
| Founder/brand content, press, webinars | Builds category awareness ahead of search | Early-stage, out-of-market 95% |
| Existing-franchisee referral | Converts social proof from a peer already in the system | Mid-to-late stage, trust-building |
| Paid search on brand + concept terms | Captures active researchers self-identifying by name | Mid-stage, active research |
| Discovery days / validation calls | Lets multiple household stakeholders vet the decision together | Late-stage, buying-group consensus |
Funnel 2: filling the door at the location
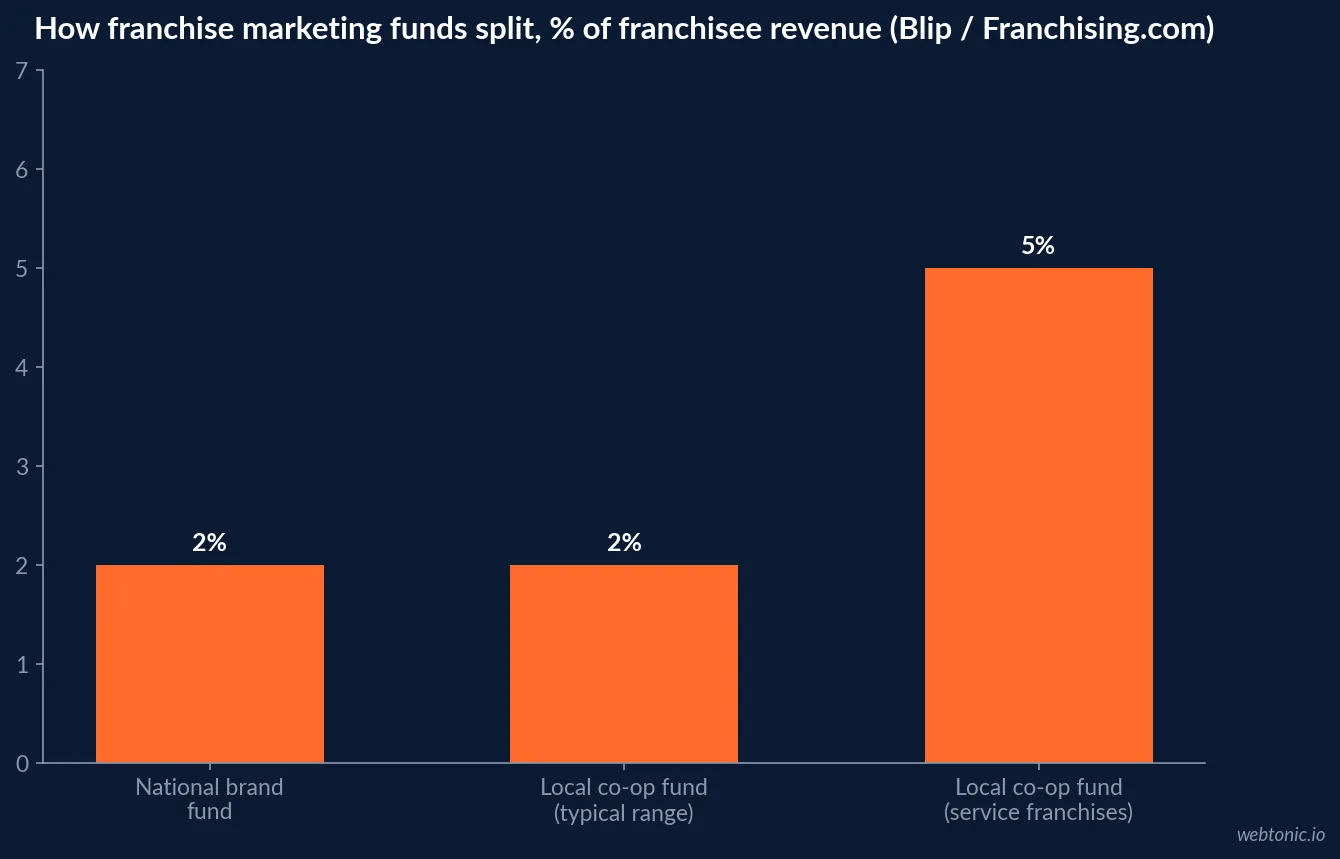
Location-level demand generation is funded differently and behaves like ordinary local consumer marketing. A Franchise Update Media's 2025 Annual Franchise Marketing Leadership Report, via Franchising.com found franchisee contributions to a co-op, local or regional marketing fund clustering between 1% and 3% of revenue for most systems, with 50% of surveyed service (non-brick-and-mortar) franchises requiring 5% of franchisee revenue. Franchise systems that pool location-level spend into a single collective-buying program can secure meaningfully better media rates than any single franchisee negotiating alone, which is the underlying economic case for the co-op fund in the first place.
That collective-buying advantage is franchising's structural edge in demand generation over an independent local business: the same media dollar reaches further when 4,500 locations negotiate as one buyer instead of 4,500 separate ones.
| Funding source | Typical share of franchisee revenue | Source | Primarily funds |
|---|---|---|---|
| National brand marketing fund | 1%-2% typical (3% for a third of brick-and-mortar service franchises) | Franchise Update Media AFMR 2025 | Brand awareness, creative, national media |
| Local / regional co-op fund | 1%-3% typical, 5% for many service franchises | Franchising.com survey | Location-level channel spend |
| Individual location discretionary spend | Above and beyond required funds, varies widely | Not centrally surveyed | Local promotions, hyper-local paid social |
What the location funnel is competing against
Location-level demand generation now runs into the same reputation gate every local business faces. BrightLocal's 2026 Local Consumer Review Survey found 47% of consumers will not use a business with fewer than 20 reviews and 68% expect at least a 4-star average, while 74% only weigh reviews from the last 3 months - meaning a new location's demand-gen spend is discounted by consumers until its own review base catches up, regardless of brand tenure elsewhere. That is a genuinely different constraint than franchise development marketing faces, where brand history (not location-level review freshness) is the trust signal candidates weigh.
Where the two funnels genuinely overlap
The one channel both funnels depend on is proof from existing franchisees and existing customers. Franchise Performance Group's, a franchise-development consultancy, notes from its own client work that franchise buyers independently research a concept online regardless of which channel the lead was originally attributed to - meaning a strong location-level reputation (the output of funnel 2) quietly improves franchise-development conversion (funnel 1) even though no dollar was spent to make that connection. That interdependence is the argument for treating location review management as part of the brand's development marketing budget, not purely a local operating cost.
| Budget/context fact | Figure | Source | Relevance to franchise demand gen |
|---|---|---|---|
| Overall marketing budgets | 9.0% of revenue | The CMO Survey 2026 | Baseline any location plan is built from |
| High-growth services firm marketing spend | ~12% of revenue | Hinge 2026 High Growth Study | Growth-stage systems can justify higher local spend |
| No-growth services firm marketing spend | ~5% of revenue | Hinge 2026 High Growth Study | Mature systems trim to defensive spend levels |
| Enterprise B2B buying group size | 5-11 stakeholders | Gartner (cross-industry benchmark) | Franchise-candidate decisions likely mirror this shape |
| Share of B2B audience in-market at any time | ~5% (95-5 rule) | Ehrenberg-Bass Institute / LinkedIn B2B Institute | Argues for sustained brand spend in franchise development |
Seasonality and speed-to-lead differ between the two funnels too
Franchise development inquiries do not follow a retail calendar - candidate interest tracks tax season, severance windows after layoffs, and the January "new year, new business" search spike, none of which line up with the seasonality a location-level demand-gen plan is built around (holiday retail peaks, back-to-school, summer home-service demand). A brand running one combined content calendar for both funnels typically under-serves whichever one is off-cycle relative to the other.
Speed-to-lead also means something different in each funnel. A franchise-candidate inquiry that waits three days for a callback is competing against other franchisors the candidate is simultaneously evaluating, so response time is a competitive signal, not just a service-quality one. A location-level customer lead - a quote request, a booking form - competes against the same local urgency BrightLocal's review-reply data describes: consumers who expect a reply within a day or a week, not a quarter.
| Signal | Franchise development funnel | Location-level customer funnel |
|---|---|---|
| Peak inquiry season | Tax season, layoff windows, January | Category-specific (holiday retail, summer home-service) |
| Cost of a slow reply | Lost to a competing franchise opportunity | Lost to a competing local business, per BrightLocal's reply-speed data |
| Typical consideration length | Months, often 3-9 with due diligence | Minutes to days for most consumer categories |
| Who owns follow-up | Franchise development team or broker | Individual location owner or manager |
How to plan the split without one budget line hiding the other
Report the two funnels separately, even if one team manages both: franchise development against candidate volume and cost per qualified inquiry, location demand generation against the co-op fund's own documented 1%-5% range and location-level review velocity. Our growth marketing practice builds that split reporting before touching channel mix, our cost-per-lead benchmarks by industry are a useful cross-check once location-level paid spend is broken out from the co-op fund, and our data and analytics practice is where that dual-funnel reporting typically gets built.
Frequently Asked Questions
Is franchise demand generation about getting customers or getting franchisees?
Both, and the two funnels do not share a budget. Franchise development demand generation sells territories to prospective owners - a B2B-shaped, long-consideration purchase closer to enterprise buying behavior. Location-level demand generation sells to end customers at each of the roughly 845,000 US franchise establishments open in 2026 (IFA/FRANdata) and behaves like ordinary local consumer marketing. Any 'state of demand gen' claim for franchising has to specify which funnel it is describing.
How is the marketing budget actually split between national brand and local franchisee spend?
Franchising.com's 2025 marketing-fund survey found franchisee contributions to a co-op, local or regional marketing fund cluster mostly between 1% and 3% of revenue, with 50% of surveyed service (non-storefront) franchises requiring 5%. Neither of those is a demand-generation channel budget on its own - they are the pool that a local marketing plan then has to allocate across channels.
Do franchise candidates behave like typical B2B buyers?
Directionally yes, though no franchise-specific version of the major B2B buyer surveys exists, so this is a labeled cross-industry benchmark, not a franchise-specific one. Forrester's B2B buying-group research describes purchases as decided by multiple stakeholders rather than one buyer, and Gartner's B2B buying journey research puts the average enterprise buying group at 5 to 11 stakeholders. A franchise sale - often a six-figure investment involving a spouse, an accountant and sometimes a lender - fits that buying-group shape more than a single-decision-maker retail purchase.
What is the '95-5 rule' and does it apply to franchise development marketing?
The 95-5 rule, attributed to Professor John Dawes of the Ehrenberg-Bass Institute and popularized by the LinkedIn B2B Institute, holds that only about 5% of a B2B category is in-market to buy at any given time, with the other 95% out-of-market but future buyers. It is a general B2B marketing finding, not one measured on franchise candidates specifically, but it maps onto franchise development well: most of the audience a franchisor's brand marketing reaches in a given quarter is not ready to sign an agreement yet, which is the argument for sustained brand-awareness spend alongside bottom-funnel lead capture.
Where does referral fit against paid channels for a franchise system?
The honest answer is channel-specific and rarely disclosed publicly by franchise brands themselves, so this page states ranges rather than a single household figure. What is well documented at the industry level: franchise development lead sources include portals, broker networks, paid digital and referral from existing franchisees, and Franchise Performance Group's own research on lead behavior found that buyers still independently research a concept online regardless of which channel first generated the lead - meaning the attributed source undercounts how much organic and branded search influences the eventual decision.
Sources
International Franchise Association - 2026 Franchising Economic Outlook
FRANdata - 2026 Franchising Economic Outlook report
Franchise Update Media - 2025 Annual Franchise Marketing Leadership Report (via Franchising.com)
Forrester - Get to know your B2B buying group
LinkedIn B2B Institute - Why you should follow the 95-5 rule
Franchise Performance Group - Behavior differences between franchise leads and franchise buyers
BrightLocal - Local Consumer Review Survey 2026
The CMO Survey - Highlights and Insights Report 2026
Hinge Marketing - 2026 High Growth Study