



Table of contents
Franchise account-based marketing does not target consumers - it targets named territory buyers and multi-unit operators, priced against cross-industry B2B ABM benchmarks because no study prices ABM by franchise brand. This page pairs those B2B figures with the real franchise-universe account counts a development team is actually working against.
Key Takeaways
- 28% of the 2022 marketing budget went to ABM, per Momentum ITSMA's benchmarking study.
- 71% of companies planned to increase ABM spend in 2023, up 13.1% year on year.
- 13 people sit inside the average B2B buying group, plus 9 more from outside it (Forrester 2025).
- 73% of B2B purchases involve three or more departments (Forrester 2025).
- 42,891 multi-unit operators control 56% of all franchised units, the highest-value ABM account tier (Franchising.com 2024).
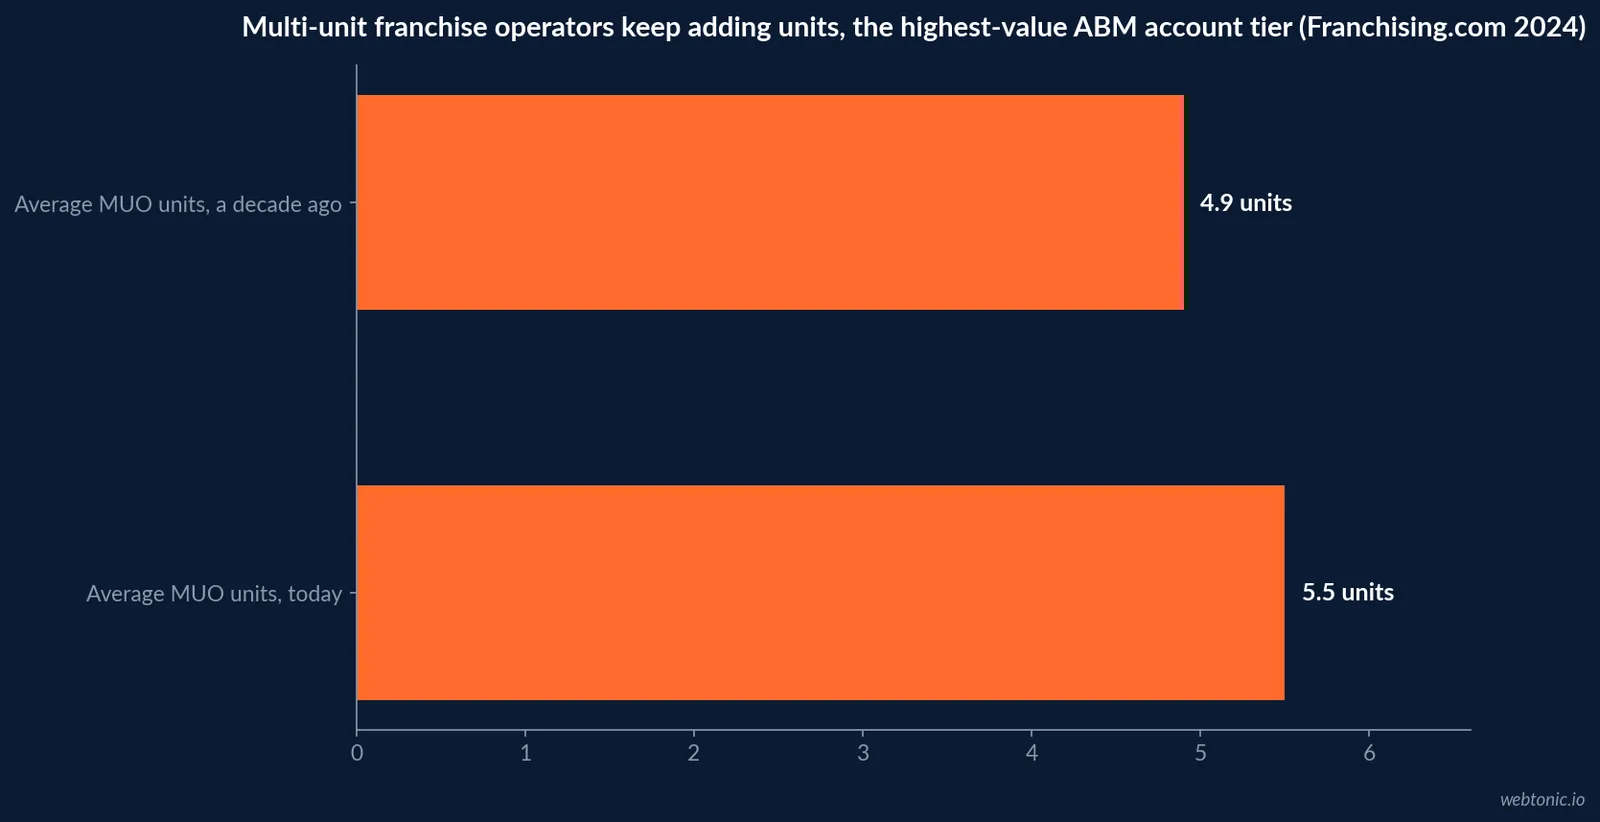
- 5.5 units is the average per multi-unit operator, up from 4.9 a decade ago.
- 851,000 total franchise establishments are projected for 2025 - the broad universe an ABM program filters down from (IFA).
- 1,062,000 franchise development leads tracked industry-wide in 2025, most outside the ABM-worthy tier (FranConnect).
- 18.9% conversion rate for internal-network leads shows why named-account, relationship-based targeting already outperforms mass outreach in this industry.
- 62% of ABM practitioners run the program through their existing CRM; 52% through a Marketing Automation Platform (ABM Leadership Alliance 2025).
- 37% of ABM practitioners report using AI tools in the process.
- 58.7% win rate for accounts engaged with four advertising products, a 71% lift over zero, in Demandbase's own 1,452-instance dataset.
- $17,550 average cost per franchise sale in 2025 sets the ceiling an ABM-style program has to beat on its highest-value accounts.
| Metric | Figure | Source | Franchise ABM read |
|---|---|---|---|
| ABM share of marketing budget | 28%-30% | Momentum ITSMA / ABM Leadership Alliance | Cross-industry anchor for budget weighting |
| Buying group size | 13 inside + 9 outside = 22 | Forrester Buyers' Journey Survey 2025 | A territory or MUO deal plausibly involves several of these roles |
| Multi-unit operator account universe | 42,891 MUOs, 56% of units | Franchising.com 2024 Dominators | The named-account tier ABM should prioritize |
| Total franchise establishments | 851,000 projected (2025) | International Franchise Association | The broad universe a franchise ABM program filters down from |
| Cost per franchise sale | $17,550 (2025) | Franchise Update Media AFDR | The economics an ABM-style program on top accounts must beat |
Who a franchise ABM program actually targets
Franchise account-based marketing means treating a qualified territory buyer or an existing multi-unit operator the way a B2B marketer treats a named enterprise account: research the specific account, build content and outreach around its actual situation (available territories, unit economics, financing profile), and coordinate sales and marketing around that one account rather than a generic funnel stage. Franchising.com's 2024 Dominators report puts a number on the highest-value tier of that universe: 42,891 multi-unit operators controlling 241,380 units - 56% of all franchised units - and owning an average of 5.5 units each, up from 4.9 a decade ago. Those operators are known, named, and evaluable before the first outreach, which is exactly the account profile ABM was built for.
How much of the budget should go to named-account targeting
Momentum ITSMA's annual ABM benchmarking study found 28% of the 2022 marketing budget dedicated to ABM, with 71% of companies planning to increase spend in 2023, up 13.1% year on year. Neither figure is franchise-specific, but the logic transfers cleanly: FranConnect's 2025 Franchise Sales Index counted 1,062,000 development leads industry-wide, and the overwhelming majority will never close - which argues for weighting spend toward the identifiable, higher-value multi-unit-operator tier rather than spreading it evenly across a million largely unqualified leads.
| ABM budget benchmark | Figure | Year | Source |
|---|---|---|---|
| Share of marketing budget on ABM | 28% | 2022 | Momentum ITSMA |
| Companies increasing ABM spend | 71% | Planned for 2023 | Momentum ITSMA |
| Year-on-year ABM spend growth | 13.1% | 2022 to 2023 | Momentum ITSMA |
| Industry-wide franchise leads (unqualified pool) | 1,062,000 | 2025 | FranConnect Franchise Sales Index |
| Blended lead-to-agreement conversion | 1.50% | 2025 | FranConnect Franchise Sales Index |
The buying committee behind a territory or multi-unit decision
Forrester's Buyers' Journey Survey, 2025 found 73% of B2B purchases involve three or more departments, with an average of 13 people inside the buying organization and nine more from outside it - 22 influencers in total. A franchise purchase is a smaller organization than most B2B software deals, but a multi-unit operator evaluating a new territory typically brings in a business partner or spouse, an accountant, a lender and often a franchise attorney before signing - several distinct roles that content and outreach for a single named account has to address, not just the operator alone.
| Stakeholder group | Average count | Share of purchases involving 3+ departments | Source |
|---|---|---|---|
| Inside the buying organization | 13 people | 73% | Forrester Buyers' Journey Survey 2025 |
| Outside the buying organization (advisors, family, lenders) | 9 people | 73% | Forrester Buyers' Journey Survey 2025 |
| Total influencers on a typical purchase | 22 people | 73% | Forrester Buyers' Journey Survey 2025 |
What the ABM tooling and tech stack actually cost
ABM platform vendors mostly sell on custom, sales-gated quotes rather than published list pricing - Demandbase's own pricing page states plainly that a plan is customized after a form submission, with a platform fee plus a flat per-user fee and no dollar figures disclosed. The ABM Leadership Alliance's 2025 benchmark survey found 62% of ABM practitioners running the program through their existing CRM and 52% through a Marketing Automation Platform, with only 22% using a fully integrated dedicated ABM platform. For a franchise development team working a few hundred qualified multi-unit and territory accounts, that CRM-plus-MAP foundation is the realistic starting stack, not a six-figure dedicated ABM platform contract sized for enterprise account volumes.
| Tool category | Share of ABM practitioners using it | Fit for franchise development | Source |
|---|---|---|---|
| CRM (existing stack) | 62% | Tracking territory/MUO accounts through the sales process | ABM Leadership Alliance 2025 |
| Marketing Automation Platform | 52% | Sequencing content to a named account list | ABM Leadership Alliance 2025 |
| Dedicated ABM platform | 22% | Only once account volume justifies the seat cost | ABM Leadership Alliance 2025 |
| AI tools inside the process | 37% | Scoring which MUOs are expansion-ready | ABM Leadership Alliance 2025 |
The only named win-rate study, and its limits
The single recent ABM performance study with a stated sample is Demandbase's own 2026 benchmark set, built from 1,452 instances of its platform: accounts engaged with four advertising products saw a 58.7% win rate, a 71% lift over accounts using none. That describes one vendor's own customer base, is not franchise-specific, and should be read as directional evidence for multi-channel account engagement, not a guaranteed lift for a franchise territory program. The more directly relevant franchise-side evidence is FranConnect's own finding that internal-network, relationship-based leads already convert at 18.9% against 0.9% for cold internet leads - proof that named, relationship-driven targeting outperforms mass outreach in this industry specifically, independent of any cross-industry ABM study.
| Evidence type | Figure | Franchise-specific? | Source |
|---|---|---|---|
| ABM win-rate lift (4 ad products) | 58.7% vs 34.3% baseline (71% lift) | No - cross-industry vendor data | Demandbase, 1,452 platform instances |
| Internal-network lead conversion | 18.9% | Yes | FranConnect 2025 |
| Internet/cold-lead conversion | 0.9% | Yes | FranConnect 2025 |
| Relationship-channel advantage | 21x (18.9% vs 0.9%) | Yes | FranConnect 2025 |
The wider franchise economy an ABM program sits inside
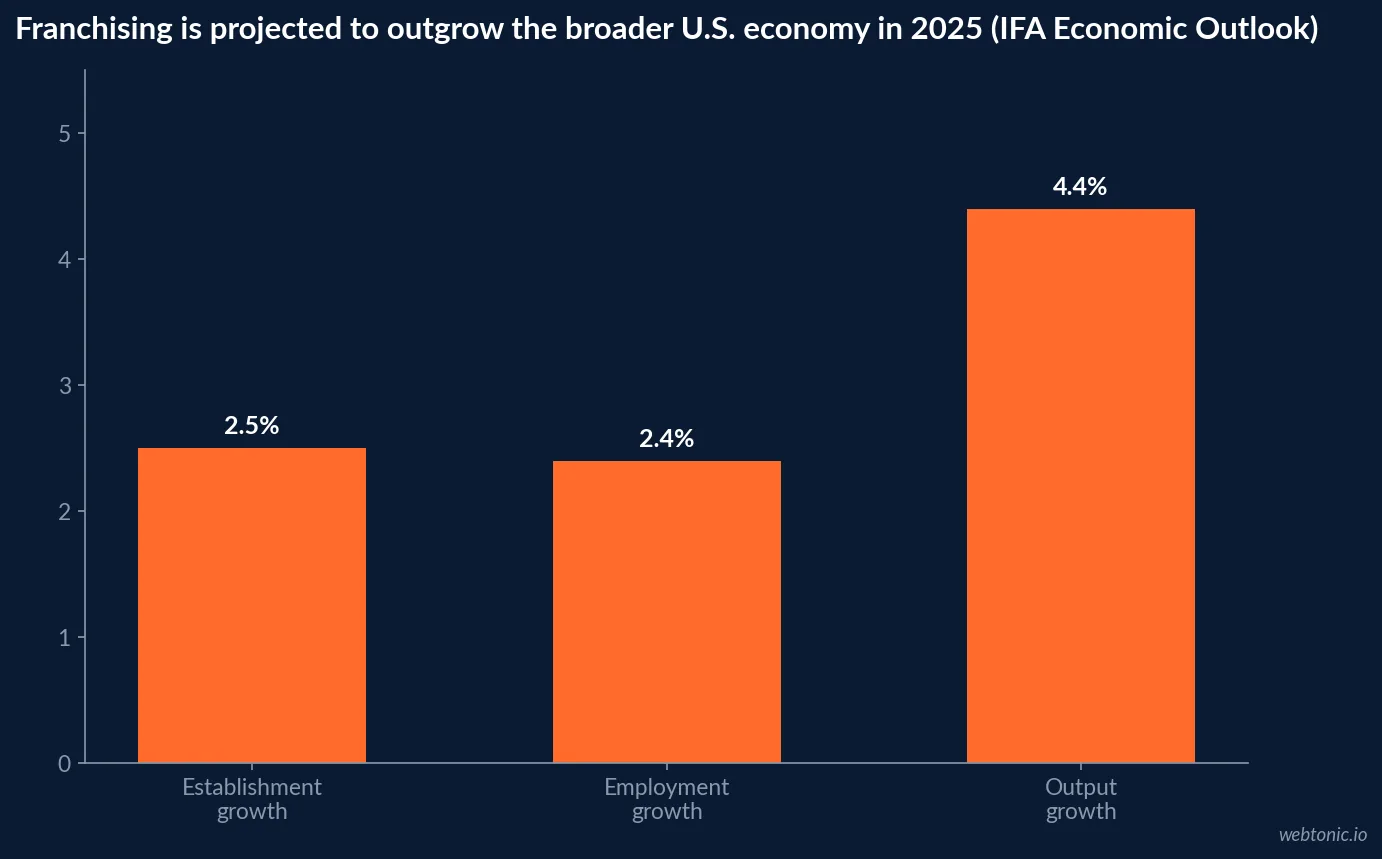
The International Franchise Association's 2025 Economic Outlook projects 851,000 total franchise establishments in 2025, up more than 20,000 units from 2024, supporting more than 9 million jobs and $936.4 billion in projected economic output, up 4.4% from $896.9 billion in 2024. That is the ceiling a franchisor's ABM program is filtering accounts out of - and against a growth rate the IFA expects to outpace the broader U.S. economy (projected at 1.9% for 2025), the honest read is that account-based targeting is competing for a constant share of a genuinely growing pool, not a shrinking one.
| Franchise economy metric (2025 projection) | Figure | Change vs. 2024 | Source |
|---|---|---|---|
| Total franchise establishments | 851,000 | +20,000 units (+2.5%) | International Franchise Association |
| Franchising employment | 9 million+ jobs | +210,000 jobs (+2.4%) | International Franchise Association |
| Total franchise economic output | $936.4 billion | +4.4% from $896.9B | International Franchise Association |
| Franchise GDP contribution | $578 billion | +5% pace | International Franchise Association |
| Broader U.S. economic growth (comparison) | 1.9% projected | Franchising growing faster | International Franchise Association |
Building a franchise ABM account list
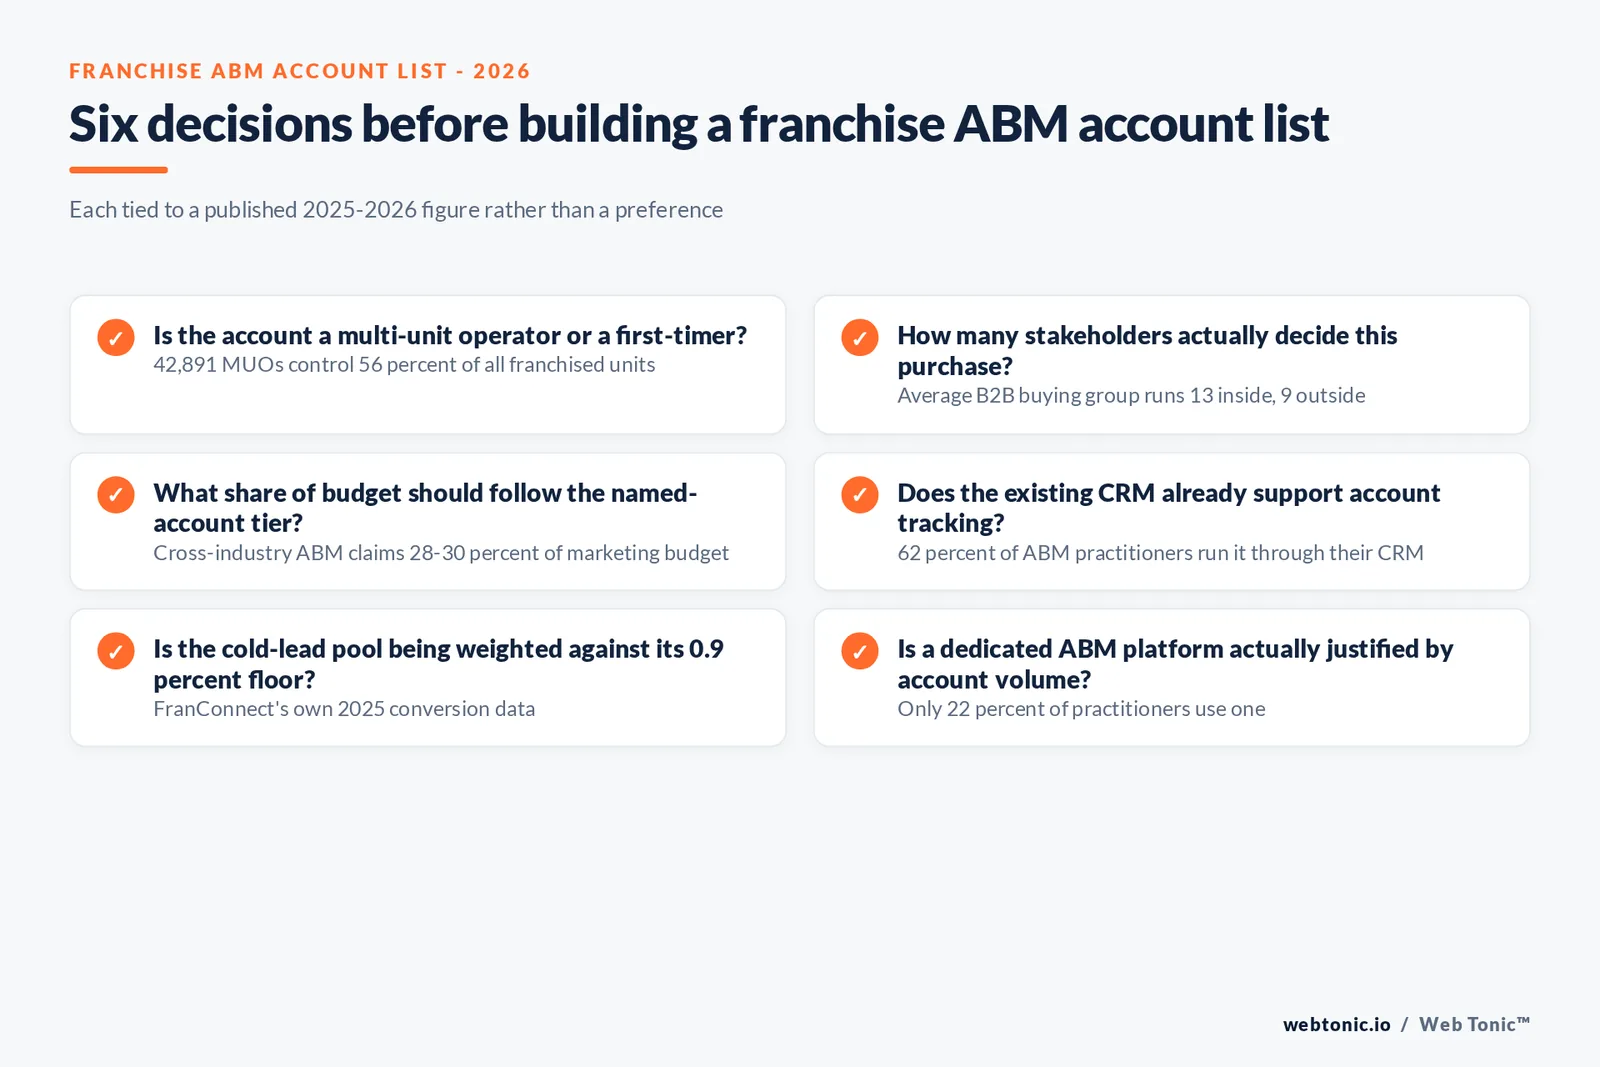
- Start from the identifiable high-value tier - the roughly 42,891 multi-unit operators controlling 56% of all franchised units - rather than the full 1,062,000-lead annual pool.
- Budget in the 28%-30% of marketing spend range as a cross-industry B2B anchor, then weight it toward the named-account tier instead of spreading it across unqualified leads.
- Map content to the buying group a territory decision actually involves: the operator, a business partner or spouse, an accountant, a lender and often a franchise attorney.
- Start the tech stack with the existing CRM and Marketing Automation Platform - the tools 62% and 52% of ABM practitioners already use - before evaluating a dedicated ABM platform contract.
- Treat FranConnect's 18.9%-vs-0.9% conversion gap as the real franchise-industry proof point that named, relationship-based targeting outperforms mass outreach, alongside any cross-industry ABM study.
See the wider category benchmarks on our account-based marketing statistics hub. Our data and analytics practice can help score and prioritize a multi-unit-operator account list before the first campaign launches; talk to us about building one.
Frequently Asked Questions
What does account-based marketing mean for a franchisor?
It means treating each qualified territory buyer or multi-unit operator as a named account with its own content, sequencing and sales alignment - the opposite of a mass-market franchise-recruitment funnel. There is no franchise-specific ABM benchmark study, so this page pairs cross-industry B2B ABM data (ITSMA, Forrester, the ABM Leadership Alliance) with FranConnect's own franchise-industry lead data and the International Franchise Association's account universe.
How big is the buying committee behind a franchise territory decision?
Franchise purchases are rarely solo decisions once the deal size grows. Forrester's 2025 Buyers' Journey Survey - not franchise-specific, but the best-evidenced B2B figure available - found an average of 13 people inside the buying organization and nine more from outside it involved in a typical purchase, with 73% of purchases spanning three or more departments. A multi-unit operator evaluating a new territory plausibly brings in a spouse or business partner, an accountant, a lender and often a franchise attorney before signing - a real buying group, even if it is smaller than a large B2B software purchase.
How much of a franchise marketing budget should go to ABM-style targeting?
Cross-industry B2B data is the only anchor: Momentum ITSMA's benchmarking study found 28% of the 2022 marketing budget dedicated to ABM, with 71% of companies increasing spend the following year. Applied to franchise development, that argues for weighting spend toward the highest-value accounts - multi-unit operators and qualified territory buyers - rather than spreading it evenly across the roughly 1,062,000 leads FranConnect's 2025 index counted industry-wide, most of which will never close.
Who are the highest-value accounts in a franchise ABM program?
Multi-unit operators (MUOs). Franchising.com's 2024 Dominators report counts 42,891 MUOs controlling 241,380 units - 56% of all franchised units - and owning an average of 5.5 units each, up from 4.9 a decade ago. An MUO already running a brand's unit economics is a fundamentally different, better-informed buyer than a first-time prospect, and is the account type that most resembles a traditional B2B ABM target: known, named, and evaluable before the first outreach.
What does ABM tooling cost for a franchise development team?
The same vendor pricing pages that apply to any B2B ABM program apply here, since no franchise-specific tooling exists. Demandbase's own pricing page shows the model - a platform fee plus a flat per-user fee - with no dollar figures published; ABM platforms mostly sell on custom, sales-gated quotes. Most franchise development teams size well below the account volume that justifies a dedicated ABM platform - the 62% of ABM practitioners using their existing CRM and the 52% using a Marketing Automation Platform (ABM Leadership Alliance 2025) is a more realistic starting stack for a program built around a few hundred qualified accounts.
Sources
Momentum ITSMA & ABM Leadership Alliance - Elevating ABM: Building Blocks for Long-Term Growth (2022 Benchmark Study PDF)
ABM Leadership Alliance - Research reports
Demand Gen Report / ABM Leadership Alliance - 2025 Account-Based Marketing Benchmark Survey (PDF)
Forrester - Three Realities About B2B Buying Networks (Buyers' Journey Survey, 2025)
Demandbase - The state of ABM in 2026 (1,452 companies)
FranConnect - 2025 Franchise Sales Index / Development Benchmarks
Franchising.com - 2024 Dominators (multi-unit operator data)
International Franchise Association - 2025 Economic Outlook


