



Table of contents

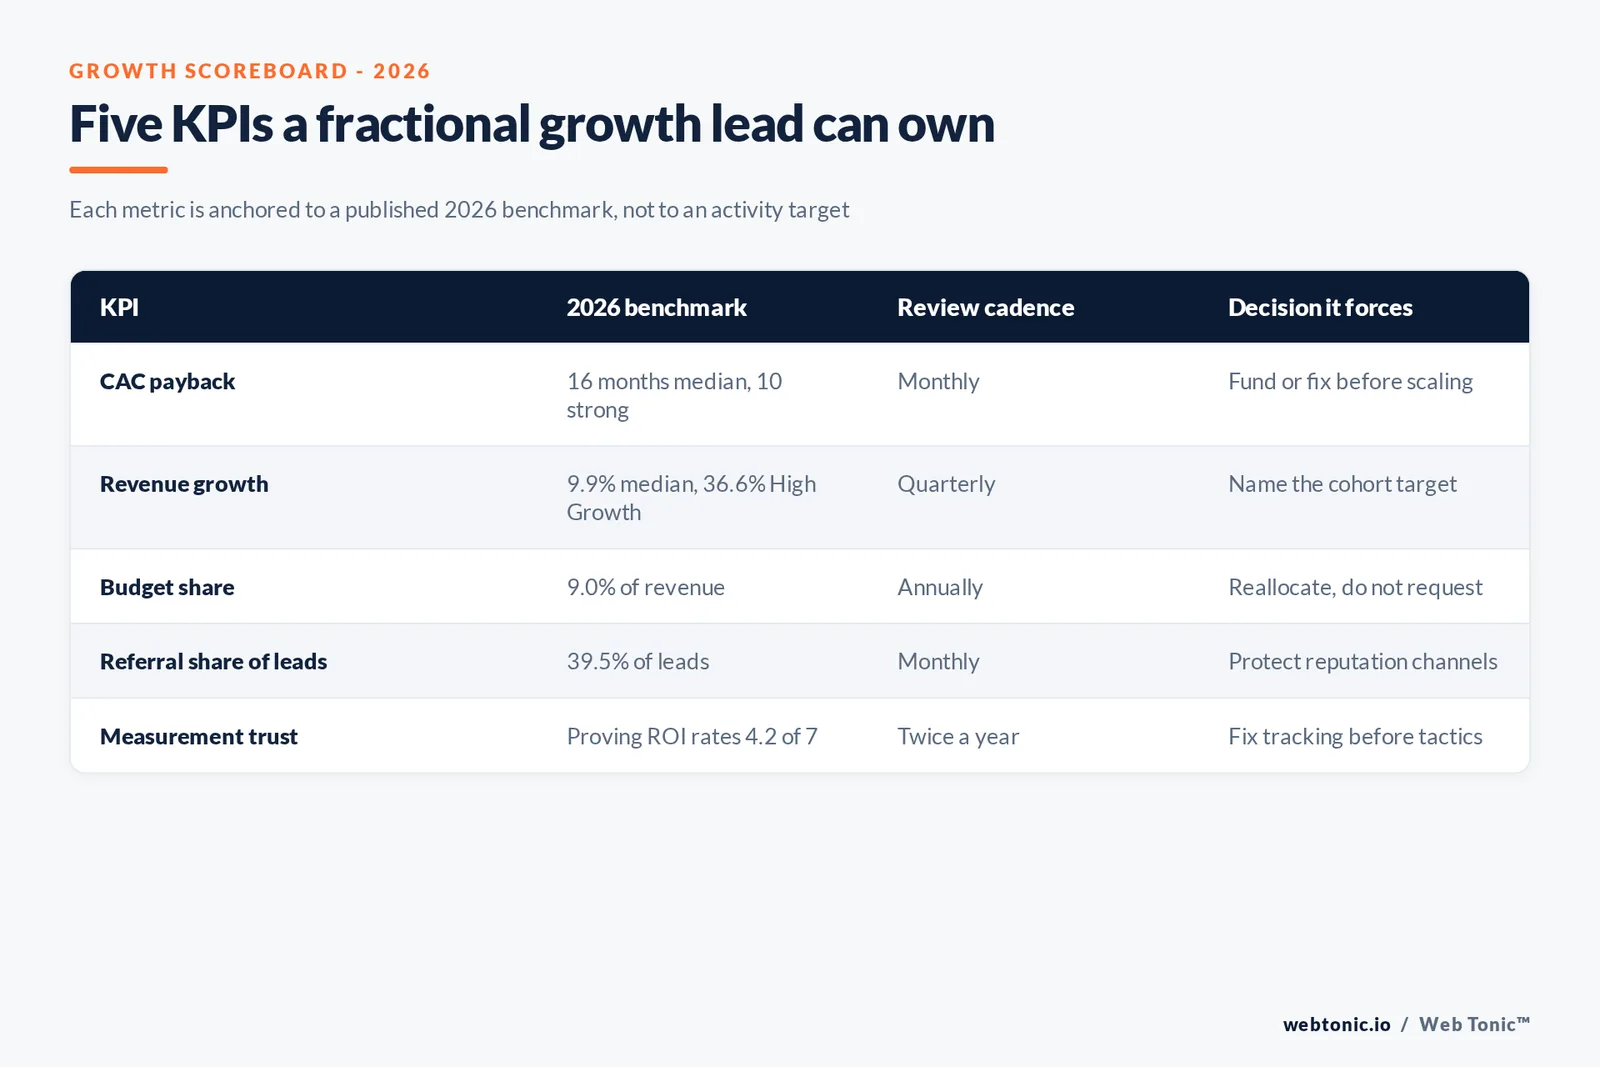
Median customer acquisition cost payback sits at 16 months and median professional-services growth has fallen to 9.9%. Those two published 2026 numbers, not a job description, are what a fractional head of growth should be measured against. Here is the full benchmark set.
Key Takeaways
- Median CAC payback is 16 months, down from 18 - an 11% improvement.
- The strong quartile recovers CAC in 10 months, the weak quartile in 24.
- Top performers reach payback in 6 months or less.
- The fastest-growing companies average 10 months against 18 for the rest.
- Median revenue growth is 9.9%, the lowest reading since 2018.
- High Growth firms grew 36.6%; No Growth firms fell 11.4%.
- High Growth firms spend 12.0% of revenue on marketing against 5.0%.
- Marketing budgets are 9.0% of revenue and 9.6% of total firm budgets.
- 56.4% of growth spending targets market penetration.
- 71% of leaders call agility a key capability.
- Referrals supply 39.5% of leads; outreach supplies 23.5%.
- Average CMO tenure is 4.1 years against 5.0 for the C-suite.
- A fractional engagement buys about 9 hours a week, or 468 hours a year.
- Demonstrating technology ROI self-rates at just 4.2 out of 7.
Start with payback, not with growth
Benchmarkit's CY-2025 benchmark study puts median CAC payback at 16 months, improved from 18 - an 11% gain - with the strong quartile at 10 months, the weak quartile at 24 and top performers at 6 months or less. The same data shows the fastest-growing companies recovering acquisition cost in 10 months against 18 for everyone else.
Payback is the right first KPI for a fractional growth leader for a practical reason: it moves on decisions that fit inside a two-quarter engagement - channel mix, offer, pricing, funnel leakage - and it cannot be inflated by activity. Growth rate, by contrast, lags the work by quarters.
| Payback cohort | CAC payback (months) | What it signals | Reasonable next target |
|---|---|---|---|
| Top performers | 6 or less | Efficient, fundable growth | Protect it while scaling spend |
| Strong quartile | 10 | Healthy unit economics | Hold while volume rises |
| Median | 16 | Workable but slow | Move toward 10-12 |
| Weak quartile | 24 | Growth is being financed, not earned | Fix before adding budget |
| Fastest growers | 10 | Speed with discipline | The benchmark to copy |
The growth benchmark depends entirely on the cohort
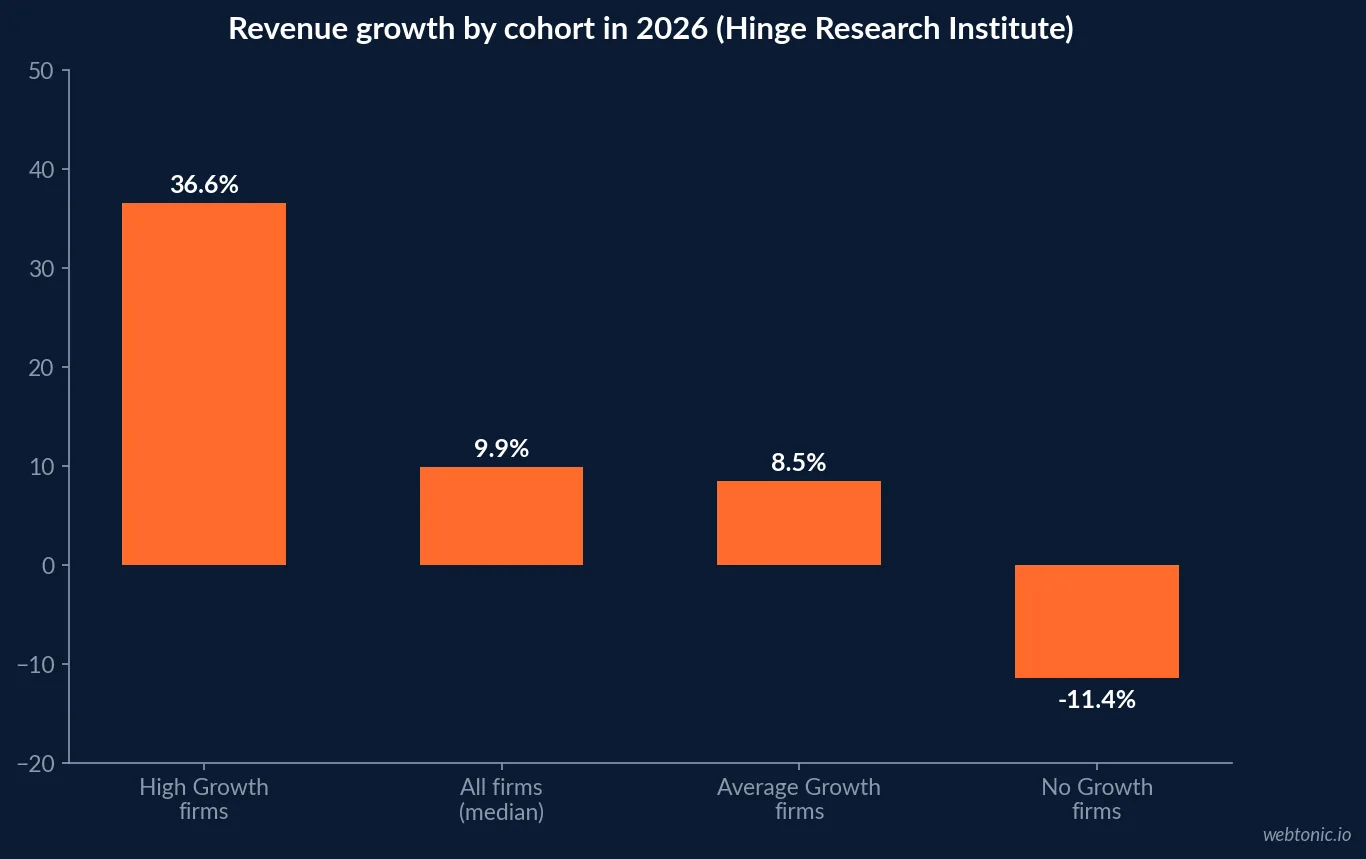
Hinge Research Institute's 2026 High Growth Study reports median revenue growth of 9.9%, the lowest since 2018, split into 36.6% for High Growth firms, 8.5% for Average Growth firms and minus 11.4% for No Growth firms. Profitability follows the same order: 39.5%, 29.6% and 20.3%.
For a growth leader arriving into a business, the first honest exercise is placing the company in that distribution. A target of 20% means one thing for a firm growing at 8.5% and something entirely different for one already at 36.6%. This is also where our growth marketing practice starts every engagement.
| Cohort | Revenue growth | Profitability | Marketing spend as share of revenue |
|---|---|---|---|
| High Growth | 36.6% | 39.5% | 12.0% |
| All firms (median) | 9.9% | Not reported | Not reported |
| Average Growth | 8.5% | 29.6% | Not reported |
| No Growth | -11.4% | 20.3% | 5.0% |
What a credible growth budget looks like
The CMO Survey 2026 puts marketing budgets at 9.0% of revenue and 9.6% of total firm budgets, with spend growth of just 1.7% and marketing headcount growth down 50% year on year. Hinge's spread is starker still: 12.0% of revenue among High Growth firms against 5.0% among No Growth firms.
Two things follow. Growth in 2026 is funded by reallocation rather than by increase, which makes prioritisation the core skill being bought. And because headcount approval has tightened, the leadership capacity itself is increasingly rented rather than hired.
| Budget benchmark | 2026 figure | Use in a growth scorecard |
|---|---|---|
| Marketing budget as share of revenue | 9.0% | Sanity-check the total envelope |
| Marketing as share of firm budgets | 9.6% | Compare against peer functions |
| Year-on-year spend growth | 1.7% | Assume reallocation, not increase |
| High Growth marketing spend | 12.0% of revenue | The investment level of the top cohort |
| No Growth marketing spend | 5.0% of revenue | The under-investment marker |
| Headcount growth | Down 50% year on year | Expect a hiring freeze on the team |
Where growth spending actually goes
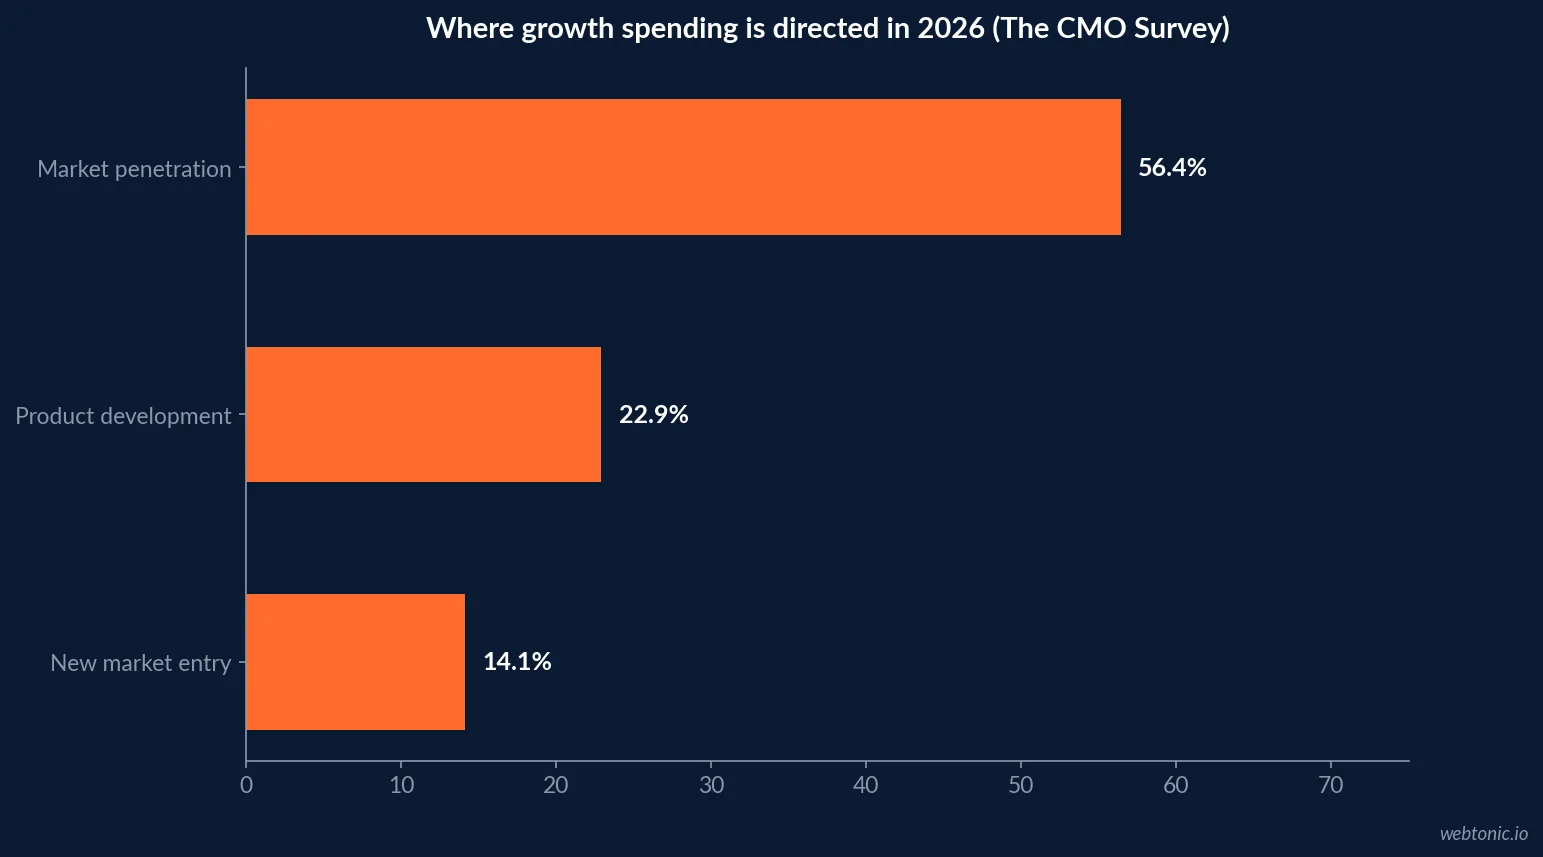
The same survey reports growth spending concentrating on market penetration at 56.4%, product development at 22.9% - up from 19.2% - and new markets at 14.1%, down from 17.0%, with 47.1% returning to established markets. Alongside that, 71% of leaders call agility a key capability and the present-versus-future split of effort sits at 68/32, with 70.6% reporting a shift toward short-term performance.
A fractional growth leader inherits that bias. The realistic mandate is to make penetration work measurable and to protect a minority of capacity for the next channel or market - not to run a three-year transformation on nine hours a week.
| Growth vector | Share of growth spend | KPI that proves it is working |
|---|---|---|
| Market penetration | 56.4% | CAC payback and win rate in the core segment |
| Product development | 22.9% (from 19.2%) | Revenue share from new offers |
| New market entry | 14.1% (from 17.0%) | Qualified pipeline in the new segment |
| Return to established markets | 47.1% of firms | Reactivation and expansion revenue |
Lead sources set the realistic KPI mix
Hinge's study reports referrals supplying 39.5% of leads and outbound outreach 23.5%, while 80% of firms conduct research - competitive research at 46.1% and client research at 45.2% - and 20% do none. Its data also shows SEO and keyword research falling from 33.5% to 27.0% and 16.8% of firms involved in mergers or acquisitions.
If two fifths of pipeline arrives through referral, a growth scorecard built entirely on paid acquisition measures the minority of the business. The stronger version pairs a paid efficiency metric with a referral or reputation metric - the reasoning behind our data intelligence work.
| Lead source or practice | 2026 share of firms or leads | Scoreboard implication |
|---|---|---|
| Referrals | 39.5% of leads | Track referral volume as a first-class KPI |
| Outbound outreach | 23.5% of leads | Measure reply and meeting rates, not sends |
| Competitive research | 46.1% of firms | Benchmark before setting targets |
| Client research | 45.2% of firms | Validate the offer before scaling spend |
| No research at all | 20% of firms | The cheapest gap to close first |
| SEO and keyword research | 27.0%, down from 33.5% | Falling attention, rising opportunity |
The capacity constraint: about nine hours a week
GoFractional's published rate data puts fractional marketing leadership at an average of USD 180 an hour, a median of USD 175 and a 25th-to-75th percentile range of USD 130 to 220, on engagements averaging about 9 hours a week, roughly 468 hours a year.
That number is the honest limit on the KPI list. Nine hours supports diagnosis, measurement design, weekly prioritisation and a review meeting. It does not support campaign production. A scorecard that implies otherwise sets up a failure that gets blamed on the model rather than on the scope.
Tenure and turnover argue for a documented scoreboard
Spencer Stuart's 2026 CMO tenure snapshot reports average tenure of 4.1 years against 5.0 for the wider C-suite, 31% of companies with no CMO at all and 77% of appointments filled within six months.
Growth leadership turns over faster than the strategies it owns. The practical protection is a written scorecard with named metric owners, so a change of leader does not restart the measurement work. Ask for it in the first month of any engagement - permanent or fractional - as you would when setting up a channel strategy.
Measurement is the KPI behind the KPIs
The CMO Survey's martech self-ratings are the clearest warning in the 2026 data: on a 1-to-7 scale, vendor selection scores 4.9, tactical use of data 4.8, systems integration 4.8, generating technology ROI 4.5, demonstrating that ROI 4.2, training 3.9 and hiring the right people 3.7 - no capability scores above 5, and the ratings are flat against 2024. On the content side, the Content Marketing Institute finds measurement is a challenge prompting action for 33% of B2B marketers, behind prompting action at 40% and resources at 39%.
So the first 30 days of a growth engagement are usually measurement work, not campaign work. Until the numbers are trustworthy, every other KPI on the board is an opinion with a decimal point.
| Capability | Self-rating out of 7 | Effect on the scorecard |
|---|---|---|
| Selecting vendors | 4.9 | Tool choice is not the bottleneck |
| Using data tactically | 4.8 | Data exists but is under-applied |
| Integrating systems | 4.8 | Expect reconciliation work |
| Generating technology ROI | 4.5 | Returns are real but unproven |
| Demonstrating that ROI | 4.2 | The credibility gap to close first |
| Hiring the right people | 3.7 | Weakest capability of all |
The cadence that makes a growth scorecard survive
Cadence matters more than metric count. EOS Worldwide reports that companies running its operating system with a professional implementer grew 2.8 times faster in research validated with TrueSpace and Gallup across 305 companies - vendor research, so treat the magnitude as directional and the mechanism as the takeaway: a weekly scorecard with named owners.
HubSpot's State of Marketing adds the context for why the cadence is under strain: 61% of marketers call the current shift the biggest disruption in 20 years, with 80% using AI for content and 75% for media production. Tooling is changing faster than measurement, which is exactly when a fixed review rhythm pays for itself. If you want a second opinion on your scoreboard, tell us what you are measuring.
| Cadence | What is reviewed | Who owns it |
|---|---|---|
| Weekly | Pipeline coverage and spend pacing | Growth leader with channel owners |
| Monthly | CAC payback trend and channel mix | Growth leader with finance |
| Quarterly | Cohort growth against benchmark | Leadership team |
| Twice a year | Measurement architecture review | Data owner |
| Annually | Budget envelope against 9.0% benchmark | Finance and leadership |
Related reading
- Fractional CMO Statistics: Benchmarks and KPIs
- Fractional Head of Growth Statistics: Cost and Pricing
- Fractional CGO / Head of Growth: the first 90 days
- Marketing Strategy Consulting services at Web Tonic
Frequently Asked Questions
What KPIs should a fractional head of growth own?
Two or three outcome metrics, not a dashboard. The defensible set in 2026 is customer acquisition cost payback, pipeline or revenue growth against a cohort benchmark, and one efficiency ratio the business already trusts. Benchmarkit's CY-2025 data puts median CAC payback at 16 months, with the strong quartile at 10 months and the weak quartile at 24, so a payback target has a published reference point. Anything measured only in activity - posts, tests, meetings - belongs to the execution team, not to the growth leader.
What growth rate counts as good in 2026?
It depends on the cohort, and the spread is very wide. Hinge Research Institute's 2026 High Growth Study reports median revenue growth of 9.9% across professional services firms - its lowest reading since 2018 - against 36.6% for the High Growth cohort, 8.5% for Average Growth firms and minus 11.4% for No Growth firms. Setting a target without naming the cohort is how growth plans lose credibility in the first quarter.
How many hours does a fractional growth leader actually work?
Roughly nine hours a week, or about 468 hours a year, according to GoFractional's published rate data for fractional CMO engagements. That is the single most useful planning number in the model: it sets what can reasonably be owned. Nine hours a week supports strategy, measurement design, prioritisation and review. It does not support daily channel execution, which is why the engagement fails when it is scoped as a cheaper full-time hire.
Is a fractional growth leader measured differently from a full-time hire?
The metrics are the same; the review cadence and the horizon are not. Spencer Stuart puts average CMO tenure at 4.1 years against 5.0 years for the wider C-suite, with 31% of companies having no CMO at all. A fractional engagement typically runs 6 to 12 months, so the scoreboard has to show movement inside two quarters - usually in leading indicators such as pipeline coverage and payback trend rather than in annual revenue.
What is the most common measurement failure in growth leadership?
Not being able to prove the return at all. The CMO Survey 2026 shows marketers self-rating their ability to demonstrate technology ROI at 4.2 on a 7-point scale, and their ability to generate it at 4.5 - no martech capability scores above 5. On the content side, the Content Marketing Institute finds measurement is a challenge prompting action for 33% of B2B marketers. A growth leader who does not fix measurement in the first 30 days will be judged on opinion.
Sources
Benchmarkit - CY-2025 B2B SaaS Performance Metrics Benchmarks
Hinge Research Institute - 2026 High Growth Study
The CMO Survey - Highlights and Insights Report 2026
GoFractional - Fractional CMO Rates
Spencer Stuart - CMO Tenure 2026 Snapshot
Content Marketing Institute - B2B Content Marketing Trends 2026
HubSpot - State of Marketing
EOS Worldwide - Companies Running EOS Grew 2.8x Faster


