



Table of contents

Measure a fractional CMO on three things: the business outcome you hired them to move, the leading indicators that predict it, and the operating health of the marketing function. Everything else is reporting decoration.
Key Takeaways
- Agree three primary metrics before the engagement starts — one business outcome, one or two leading indicators, one operating-health measure. Dashboards of twenty KPIs hide performance rather than reveal it.
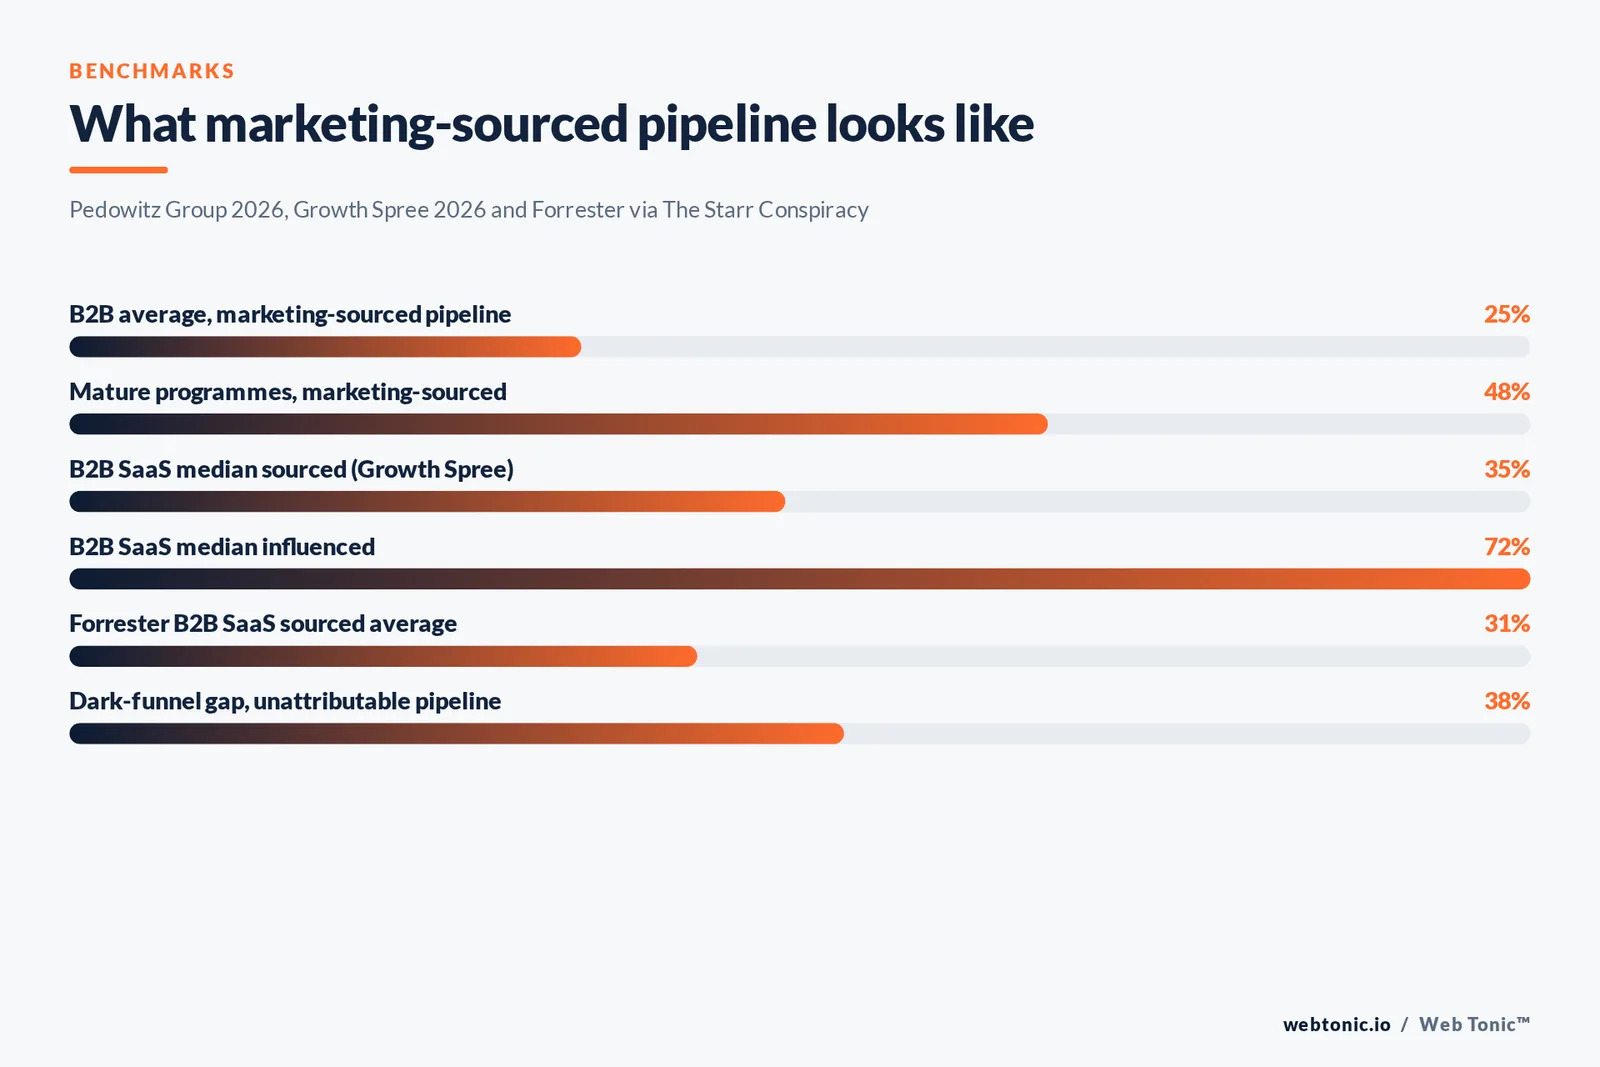
- Marketing-sourced pipeline is the most common outcome metric. Across B2B, marketing typically sources 20–30% of pipeline, with mature programmes reaching 40–55%.
- Attribution maturity changes the score: B2B teams with full-funnel attribution are nearly twice as likely to exceed their goals, and the dark-funnel gap still averages 38% of B2B pipeline.
- Time the expectations to the scope. Most fractional CMO engagements run 8 to 20 hours a week, so month one buys diagnosis and month three buys signal, not a revenue step-change.
- Operating-health metrics — decision speed, experiment completion, data quality, sales feedback — are what separate a leader from an expensive report writer.
- Benchmark the cost side honestly: average US CMO total compensation sits at $293,575, so a part-time CMO is measured against the leadership you would otherwise buy, not against a freelancer.
Why fractional CMO measurement goes wrong
The usual failure is not a lack of numbers. It is too many of them, agreed too late. A fractional chief marketing officer joins a company that often has no single revenue source of truth, then inherits whatever reporting existed before. Three months later the CEO asks whether the retainer is working and nobody can answer without a spreadsheet argument.
The second failure is measuring the wrong layer. Marketing leadership is bought to change decisions — where money goes, which segments matter, what the team stops doing. Judging that work by last-click conversions in month two is like grading an architect on the first week of bricklaying. MarkCMO's ROI framework is blunt about the fix: agree on exactly three primary metrics, not ten, and agree them before the first working session.
The third is scope amnesia. Prose's hours benchmarks put steady-state engagements at 8 to 20 hours a week — roughly 35 to 85 hours a month. A scoreboard that implicitly assumes a full-time executive will always read as underperformance.
The three-layer scorecard
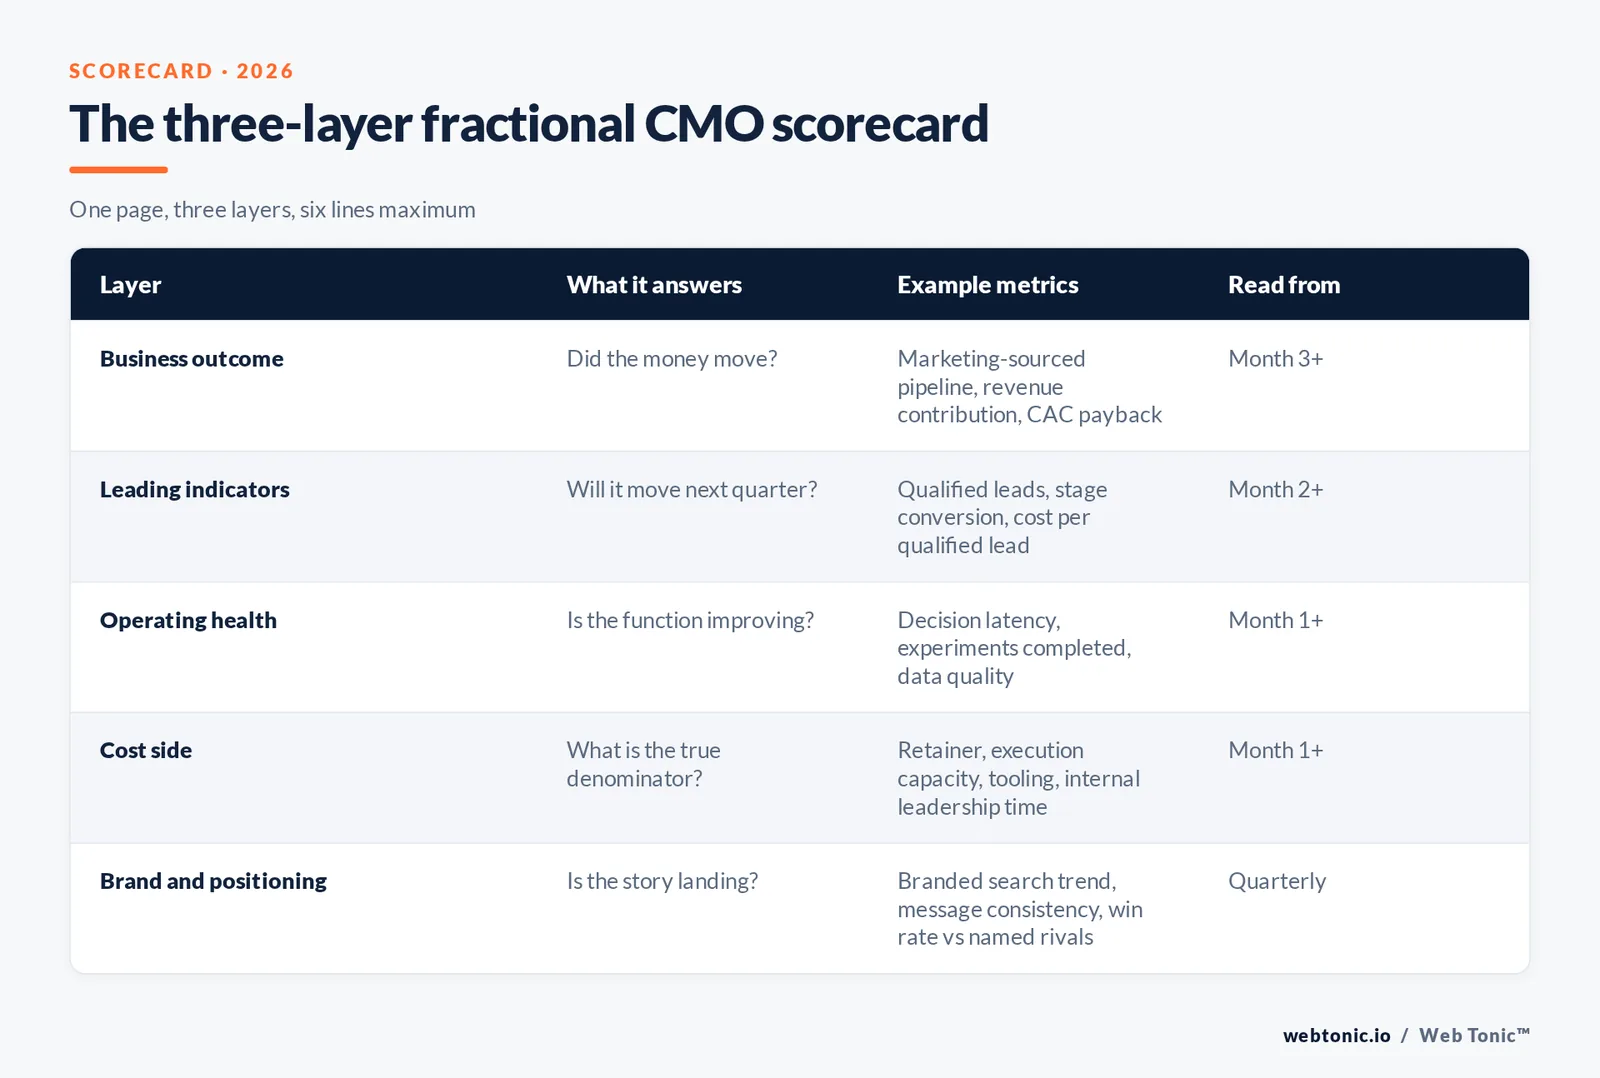
Use one page, three layers, and a maximum of six lines. This is the structure most credible practitioners converge on, and it is the one O-CMO recommends for the first 90 days: commercial outcomes paired with leading indicators such as decision speed, experiment completion and data quality.
| Layer | What it answers | Example metrics | Read it from |
|---|---|---|---|
| Business outcome | Did the money move? | Marketing-sourced pipeline, qualified pipeline value, revenue contribution, CAC payback | Month 3 onward |
| Leading indicators | Will it move next quarter? | Qualified lead volume, stage conversion rates, cost per qualified lead, win rate on marketing-sourced deals | Month 2 onward |
| Operating health | Is the function getting better? | Decision latency, experiments shipped and completed, data quality, sales-marketing alignment score | Month 1 onward |
Breakthrough3x frames the same idea as one core business metric plus two efficiency metrics plus one conversion metric. The exact split matters less than the discipline: pick the short list, write it into the engagement, and refuse to quietly add lines to it when a month looks soft.
What good looks like: benchmarks worth using
Targets are only useful against a published reference. The three below are the ones most growth-stage companies can defend in a board meeting.
| Metric | Benchmark | Source |
|---|---|---|
| Marketing-sourced pipeline (all B2B stages) | 20–30% of total pipeline; 40–55% for mature programmes | Pedowitz Group, 2026 |
| Marketing-sourced vs influenced (B2B SaaS) | Sourced 25–45% (median 35%); influenced 60–85% (median 72%) | Growth Spree, 2026 |
| Marketing budget as a share of revenue | Median moved from 9% to 10% | Benchmarkit, via MarketScale |
| Attribution coverage | Multi-touch adoption 47%; dark-funnel gap ~38% of pipeline | Digital Applied, April 2026 |
Pedowitz Group puts the all-stage B2B average at 20–30% of pipeline sourced by marketing and flags anything under 15% as significant untapped ground. Growth Spree's 2026 numbers add the influenced view: a healthy sourced-to-influenced ratio is around 1:2. And The Starr Conspiracy's benchmark hub cites Forrester's 31% average marketing-sourced pipeline share for B2B SaaS — a useful sanity check when a proposal promises far more.
One caution before you set a target off any of these: definitions vary. "Sourced" under first-touch attribution and "sourced" under a multi-touch model are different numbers on the same pipeline. Write the definition down next to the target.
Fix the measurement system before you grade the leader
You cannot score a part-time CMO on a system that cannot see the funnel. Digital Applied's April 2026 data set puts multi-touch attribution adoption at 47%, up from 31% in 2023, marketing mix modelling at 26%, and the dark-funnel gap — pipeline no model can attribute — at an average 38% of B2B pipeline. That last number is the honest ceiling on precision.
It also predicts outcomes. Benchmarkit's data, reported by MarketScale, found B2B marketers with full-funnel attribution are nearly twice as likely to exceed their goals, alongside a median marketing budget rising from 9% to 10% of revenue. If your fractional CMO's first 30 days are spent rebuilding tracking and definitions, that is not a delay in the work — it is the work. Our data intelligence practice exists for exactly that stage.
Three system fixes to demand before month two closes:
- One agreed definition of a qualified lead, signed off by sales, in writing.
- One dashboard, one owner, refreshed on a fixed day, showing the three primary metrics and nothing else on page one.
- A named attribution model, with its known blind spots written down — including a rough allowance for the dark funnel.
Measurement timeline: what to expect and when
Grading too early is the most expensive mistake in fractional marketing leadership. Here is a realistic clock for a company with a 30–90 day sales cycle; lengthen every row if you sell enterprise deals.
| Period | What you can honestly judge | What you cannot yet judge |
|---|---|---|
| Days 1–30 | Quality of diagnosis, data gaps found, decisions unblocked | Pipeline or revenue impact |
| Days 31–60 | Strategy clarity, spend reallocation, lead quality definition, experiment cadence | Win rates, CAC payback |
| Days 61–90 | Leading indicators moving, qualified lead volume and cost | Full revenue contribution |
| Months 4–6 | Marketing-sourced pipeline share, revenue contribution, CAC payback trend | Long-cycle enterprise cohorts |
| Months 7–12 | Compounding efficiency, retention of gains, team capability | — |
The marketing leadership value of the first quarter is usually infrastructural: a definition, a dashboard, a budget model, a stop-doing list. Those are measurable as deliverables even when the revenue line has not yet moved.
Measuring the cost side without kidding yourself
Return needs a denominator. Fractional retainers are only cheap relative to the alternative, and the alternative is priced. Built In puts average US CMO total compensation at $293,575, and Spencer Stuart measures average S&P 500 CMO tenure at 4.1 years against 5.0 for the wider C-suite — so the full-time route carries both a salary cost and a real replacement risk.
The market context matters too. Lightcast counted at least 34,000 US workers with "fractional" in their job title in 2025, up 265% since 2019, and Vendux sizes the global fractional executive market at $5.7 billion, growing about 14% a year. Broad third-party ranges for fractional CMO retainers run roughly $5,000 to $25,000 a month depending on scope and market — wide, because scope varies more than seniority does.
Build your ROI denominator from four inputs: the retainer, the internal leadership time the engagement consumes, execution capacity you had to add, and tooling. Then compare against the change in marketing-sourced pipeline and the efficiency of the spend it directs — not against the retainer alone.
A monthly reporting format that survives scrutiny
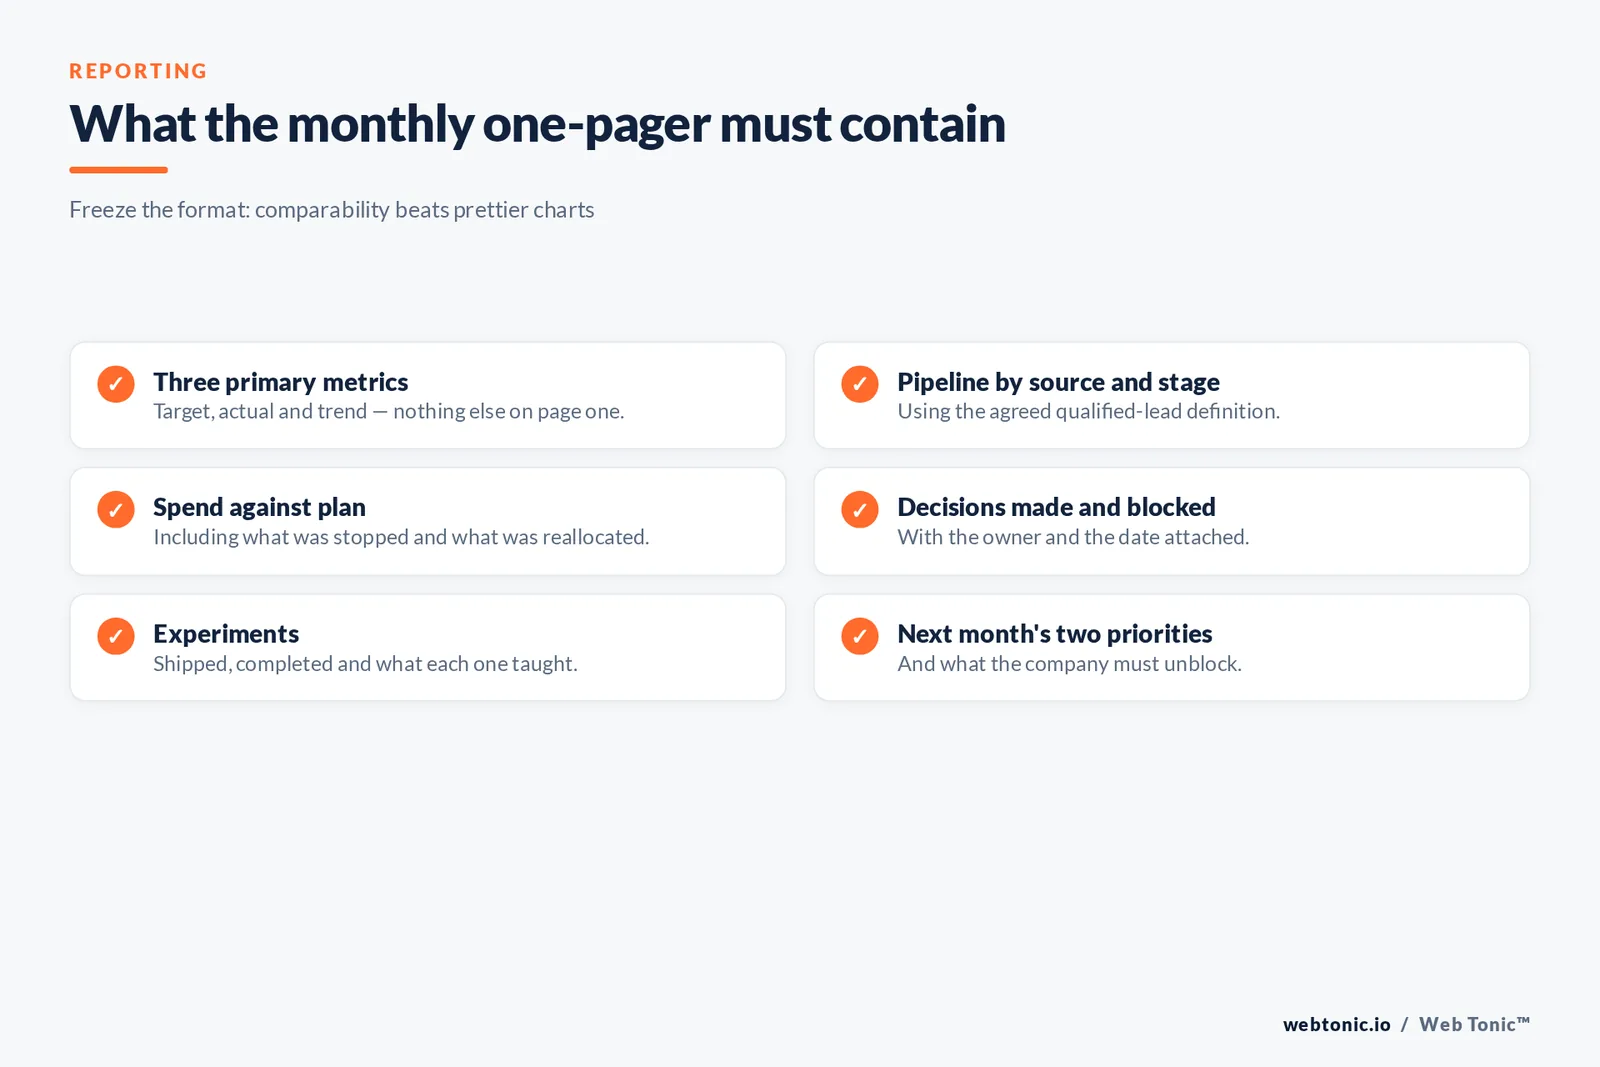
One page, same shape every month, delivered before the meeting rather than presented live. It should contain:
- The three primary metrics with target, actual and trend.
- Pipeline movement by source and stage, using the agreed definition.
- Spend against plan, including what was stopped and what was reallocated.
- Decisions made and decisions blocked, with the owner and the date.
- Experiments shipped, completed and what each one taught.
- Next month's two priorities, and what the company must do to unblock them.
Two habits make this stick. First, freeze the format — comparability across months is worth more than a prettier chart. Second, review the scorecard itself once a quarter: if a metric has never influenced a decision, replace it. Teams that need help building the reporting layer rather than arguing about it can start with our marketing services or read more in the Web Tonic blog.
If you want that scoreboard designed and owned by an operator rather than assembled after the fact, that is exactly what our fractional CMO service is built to do — and you can talk to us about the scope that fits your stage.
Measuring brand, positioning and the slower half of the job
Pipeline metrics only cover the demand a company can already capture. A senior marketing consultant is usually also repairing positioning, brand and category story — work that pays back over quarters and needs its own, lighter measures so it does not get cancelled by a lagging dashboard.
Four practical proxies work without a research budget. First, message consistency: sample ten sales calls and count how many times the agreed positioning is used verbatim by the sales team. Second, branded search volume as a monthly trend line, which moves slowly but honestly. Third, win-rate against named competitors, taken from the CRM rather than from opinion. Fourth, inbound quality: the share of new conversations that arrive already understanding what you sell. None of these are precise. All of them are directionally useful, and all of them are cheap.
Keep the portfolio view as well. Most growth-stage companies run a small portfolio of channels, agencies and campaigns at once, and the strategic value of a fractional executive is often in what they stop rather than what they start. A quarterly line for "spend reallocated" and "activities stopped" makes that visible; without it, prioritisation looks like inactivity. Some of the strongest results come from moving money between channels our growth marketing team already runs, rather than from adding new ones.
Finally, measure the people. A fractional operator who leaves behind a stronger internal team, documented processes and a hiring profile for the permanent CMO has produced compounding value that no month-three dashboard captures. Ask two questions at each quarterly review: what can the team now do without the operator in the room, and what still depends entirely on them? The gap between those answers is the honest measure of whether marketing leadership is being transferred or merely rented.

Frequently Asked Questions
What are the best KPIs for a fractional CMO?
One business outcome (usually marketing-sourced pipeline or revenue contribution), one or two leading indicators (qualified lead volume, cost per qualified lead, stage conversion), and one operating-health measure such as experiment completion or data quality. Three primary metrics, agreed in writing before day one.
How soon should a fractional CMO show measurable results?
Diagnosis and decisions in month one, leading indicators moving by month three, and revenue contribution typically in months four to six. Long enterprise sales cycles push every milestone later, so set the clock against your own cycle length.
What percentage of pipeline should marketing source?
Across B2B, 20–30% is the common average, with mature programmes reaching 40–55%. Forrester's B2B SaaS figure sits at about 31%. Under 15% usually signals that marketing is running as a cost centre rather than a revenue driver.
How do you measure a fractional CMO when attribution is incomplete?
Accept the gap and triangulate. Roughly 38% of B2B pipeline sits in the dark funnel, so pair your attribution model with self-reported source fields, pipeline-by-segment trends and pre/post spend comparisons, and state the model's blind spots in the report.
Should a fractional CMO be paid on performance?
Partly, at most, and only against metrics they control. Tying a large share of the fee to revenue in a 6–12 month sales cycle usually distorts behaviour toward short-term lead volume. A modest bonus on agreed 90-day milestones works better than a revenue share.
Sources
Pedowitz Group — Revenue Marketing Benchmarks for B2B (2026)
Growth Spree — Marketing-sourced vs influenced pipeline (2026)
Digital Applied — Marketing Attribution Statistics 2026
MarketScale — Benchmarkit B2B marketing benchmarks 2026
The Starr Conspiracy — B2B Marketing Benchmarks 2025–2026
Prose — Fractional CMO hours per week benchmarks
Built In — CMO salary in US (2026)
Spencer Stuart — CMO Tenure 2026
Lightcast — The Rise of Fractional Leadership
Vendux — 10 numbers on fractional executives in 2026
O-CMO — Fractional CMO KPIs: First 90 Days
MarkCMO — Fractional CMO ROI in the first 90 days
Breakthrough3x — 10 essential fractional CMO KPIs


