



Table of contents

The first 90 days with a fractional CMO in a SaaS company should produce three things: a defensible view of which segments actually pay back, a scorecard whose numbers reconcile, and a written stop list. Campaigns come after that, not before.
This is a checkpoint-by-checkpoint map of the quarter — what must exist at each gate, what to do when it does not, and the specific ways a SaaS onboarding goes wrong.
Key Takeaways
- Week one is an access and evidence exercise; incomplete access by day 7 is the single best predictor of a wasted quarter.
- With 10–20 hours a week, the quarter buys roughly 120–240 hours total — enough for diagnosis and decisions, not for execution.
- Median B2B SaaS CAC payback is 16 months, so 90 days proves leading indicators, not economics.
- Blended acquisition spend runs about $1.30 of sales and marketing per $1 of ARR — the first quarter should locate where that ratio leaks.
- A day-90 review with the scope re-cut in writing separates engagements that compound from those that drift.
- Tenure data — around 1.8 years for SaaS marketing chiefs — is why handover artifacts belong in the first 90 days, not the last.
The 90-day sequence
Three phases, in this order. Reversing the first two is the classic error: launching before definitions are settled industrialises whatever disagreement already exists.
| Phase | Focus | Output you keep |
|---|---|---|
| Days 1–30: diagnose | Access, cohort and segment analysis, funnel maths, interviews | Evidence-backed ICP and a leak map of the funnel |
| Days 31–60: decide | Positioning, channel arbitration, scorecard definitions, stop list | One-page scorecard with owners and targets |
| Days 61–90: operationalise | Two or three prioritised plays, vendor briefs, hiring plan | Quarterly plan, briefs and documented decisions |
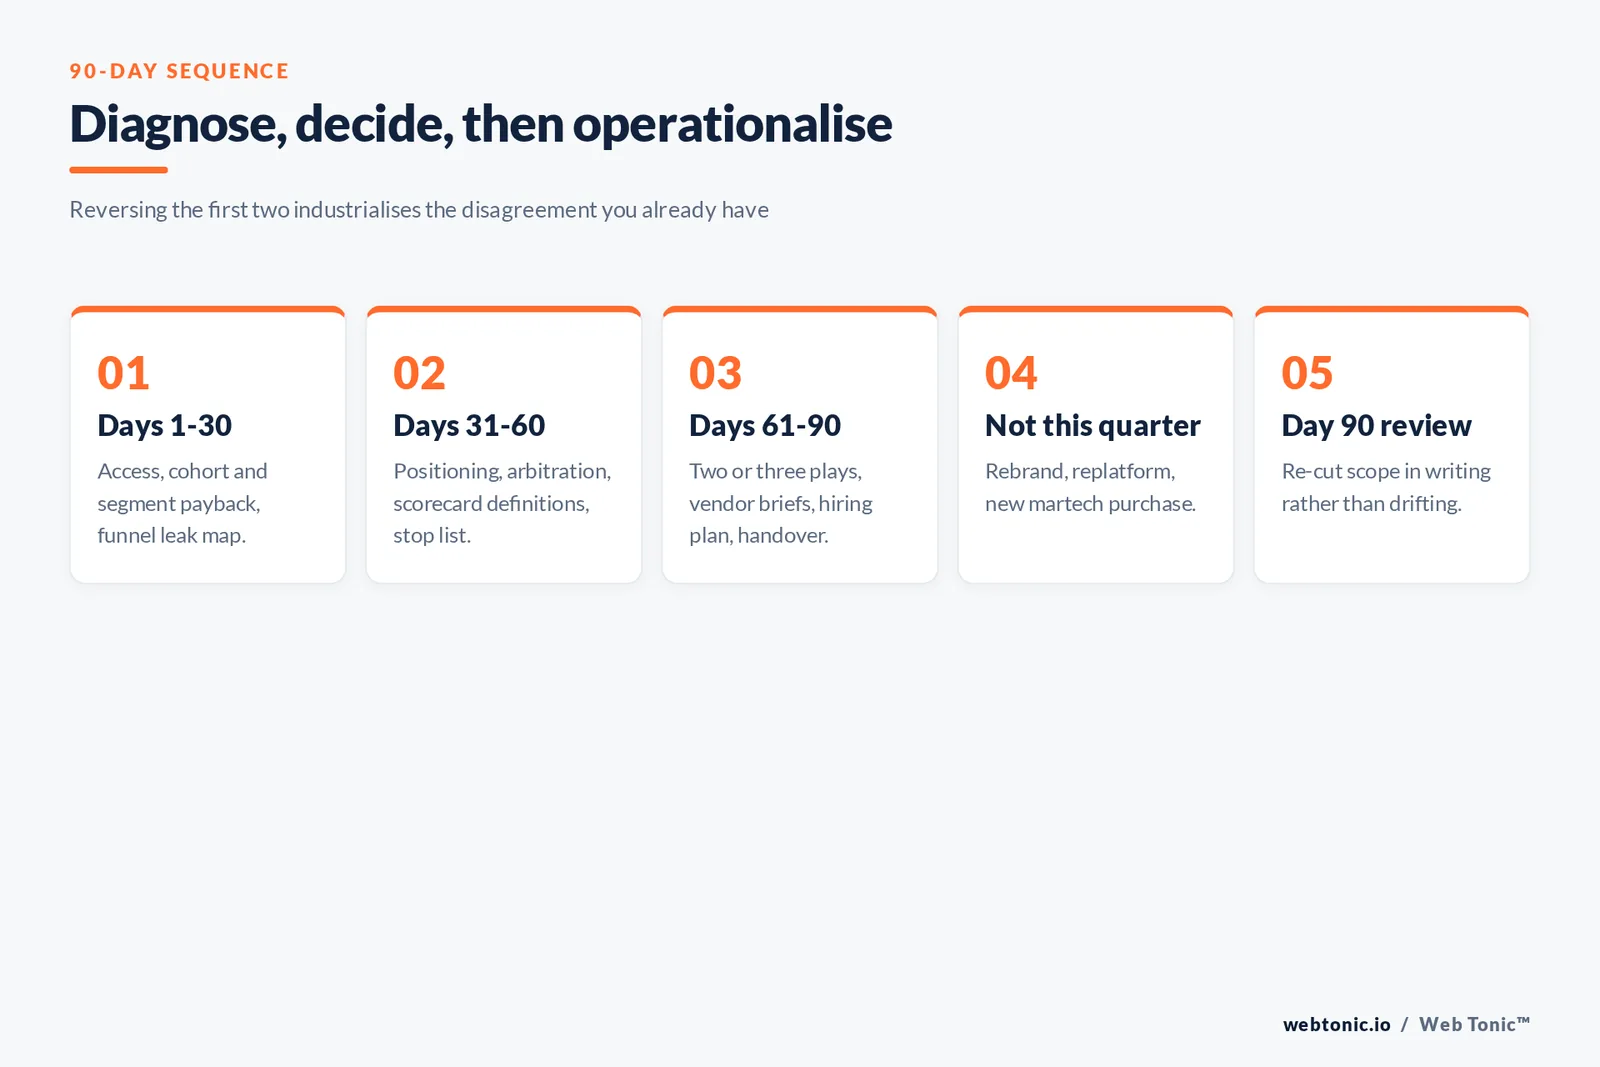
Note what the quarter does not contain: a rebrand, a website replatform, or a new martech purchase. Each is a multi-quarter project that will absorb the leadership hours you bought and postpone the decisions that make the project worth doing.
Days 1–30: diagnose with cohorts, not opinions
The diagnostic question in SaaS is always the same — which segments pay back fast enough to deserve more spend. The 2026 Aleph and Benchmarkit dataset of 342 SaaS and AI-native companies puts median CAC payback at 16 months, top quartile at 6 months or fewer, bottom quartile beyond 24 months. A first-month diagnosis should place each of your segments on that distribution.
Efficiency ratios come next. 2026 benchmark work reports a blended $1.30 of sales and marketing spend per $1 of ARR and $1.63 for new-name revenue. Analysis of the same actuals notes the median improving from 18 months in 2024, an 11% gain — useful context when a board asks whether your trend is market or execution.
Stage-matched expectations prevent false alarms. Stage benchmarks published by Data-Mania show sub-$5,000 ACV deals paying back in 8–9 months while contracts above $50,000 ACV run far longer, and ABM-led enterprise motions commonly reach 18–24 months. Judging an enterprise motion against an SMB benchmark has killed more good strategies than any channel decision.
Checkpoints: what must be true, and when
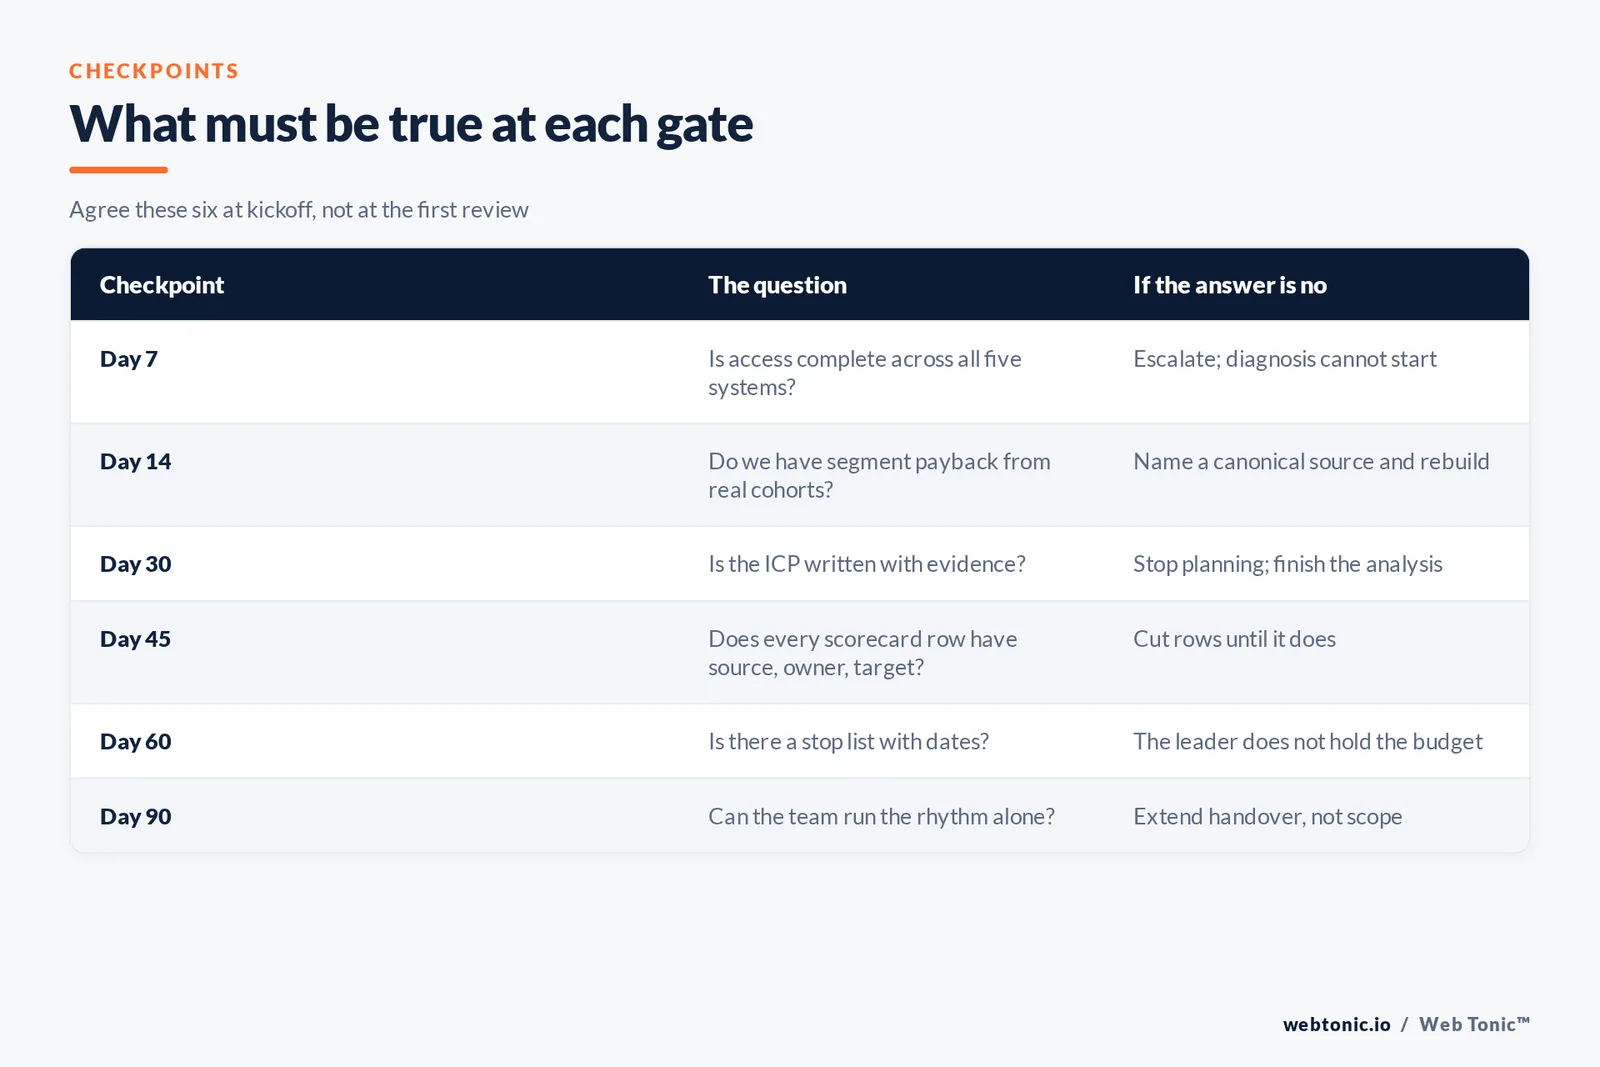
Agree these six gates at kickoff. Their value is that they surface problems in the week they appear rather than at renewal.
| Checkpoint | The question | If the answer is no |
|---|---|---|
| Day 7 | Is access complete across CRM, ad platforms, analytics and billing? | Escalate to the sponsor; diagnosis cannot start |
| Day 14 | Do we have segment-level payback from real cohorts? | Name one canonical revenue source and rebuild |
| Day 30 | Is the ICP written with evidence, not preference? | Stop planning; finish the analysis |
| Day 45 | Does every scorecard row have a source, owner and target? | Cut rows until it does |
| Day 60 | Is there a stop list with dates? | The leader has not been given the budget |
| Day 90 | Can the team run the weekly rhythm without the leader present? | Extend handover, not scope |
The day-60 gate is the honest test of authority. If no channel, tool or content line has been discontinued in two months, the retainer is functioning as advice. That is a fine thing to buy — it is just not what a leadership scope says.
What the hours actually buy
At 10–20 hours a week, the quarter contains roughly 120–240 hours. That is the whole budget, and how it is spent decides the outcome.
- 25–30% on diagnosis: cohorts, funnel maths, win-loss and customer interviews.
- 20% on arbitration: budget, channel and roadmap trade-offs, including saying no.
- 20% on the operating rhythm: weekly planning, monthly scorecard review, board input.
- 15% on vendor and team management: briefs, standards, feedback loops.
- 15% on documentation and handover so the work survives the engagement.
Market shape supports this allocation. 2026 pricing data describes typical engagements at 10–20 hours weekly on retainers of $5,000–$25,000, while retainer research ties hours to stage: 15–20 hours a month at seed, 20–30 at Series A, 30–40 past $30M ARR. If the plan implies more hours than the retainer contains, the plan is wrong, not the retainer.
Positioning, messaging and demand alignment inside the quarter
Days 31 to 60 are where positioning and messaging get settled, and in SaaS that work is a cross-functional exercise rather than a copy exercise. The framework is simple: for each priority segment, write the buyer's problem in their words, the alternative they compare you to, the one claim you can prove, and the proof asset that carries it. Four lines per segment, no more, drawn from win-loss evidence rather than from an internal workshop.
Alignment with sales is what makes the messaging survive contact with a pipeline. The same four lines should show up in outbound sequences, the demo narrative and the highest-intent landing pages within the quarter, and sales leadership should sign off on the qualification definition attached to each segment. Without that, marketing and sales run two different stories against the same buyer and the disagreement resurfaces as an attribution argument three months later.
Infrastructure work belongs here too, but only the minimum needed for decisions: consistent campaign naming, event definitions that match the scorecard, and one canonical source per number. Bigger platform projects — a replatform, a new CRM, a full lifecycle build — should be scoped and sequenced during the quarter and executed after it, with an owner and a date. The distinction is what keeps a leadership retainer from quietly turning into a delivery function, and it is worth restating at the day-60 checkpoint when enthusiasm is high and the temptation to start building is at its strongest.
The access list to send before day one
Nothing in the quarter costs more than a slow week one. Send this list the day the contract is signed, with a named owner per line, and the diagnosis starts on schedule.
| System | What is needed | What it unlocks |
|---|---|---|
| CRM | Read access plus stage definitions and close-date history | Segment-level pipeline and win rates |
| Billing or subscriptions | Cohort revenue, churn and expansion by month | Payback and retention truth, not CRM estimates |
| Ad platforms | Spend by campaign for the last 12 months | Channel efficiency and the leak map |
| Analytics and site | Conversion events, definitions and tag setup | Whether the funnel data can be trusted at all |
| Sales calls and win-loss | Recordings or notes for 20 recent deals | Positioning evidence from buyers, not internal debate |
| Contracts and vendors | Agency scopes, tool renewals and notice dates | A stop list that is actionable, with real dates |
Two lines get skipped most often and both matter disproportionately. Billing data is what turns a CRM-based payback estimate into something a CFO will sign, and vendor renewal dates decide whether a stop-list item can be executed this quarter or waits eleven months. Ask for both explicitly.
The weekly rhythm to install by day 45
A quarter's worth of good decisions still decays without a routine to carry it. Three meetings, all short, are enough for a SaaS marketing function.
- Weekly, 30 minutes. Scorecard first: read the rows, flag anything off-target, convert red rows into owned issues with dates. No status theatre and no slide deck.
- Fortnightly, 45 minutes. Play review — the two or three initiatives in flight, their leading indicators, and an explicit keep, kill or expand call rather than an open-ended "still learning".
- Monthly, 60 minutes. Economics: spend against ARR added, payback by segment, and pipeline coverage for the next two quarters against the plan.
Keep the scorecard between 5 and 15 rows. Beyond that the weekly meeting becomes a reading session, attendance slips, and within two months the number nobody reviews is the number nobody trusts. If a row cannot be produced without someone assembling it by hand, either automate it or delete it — a short honest scorecard beats a complete fiction every time.
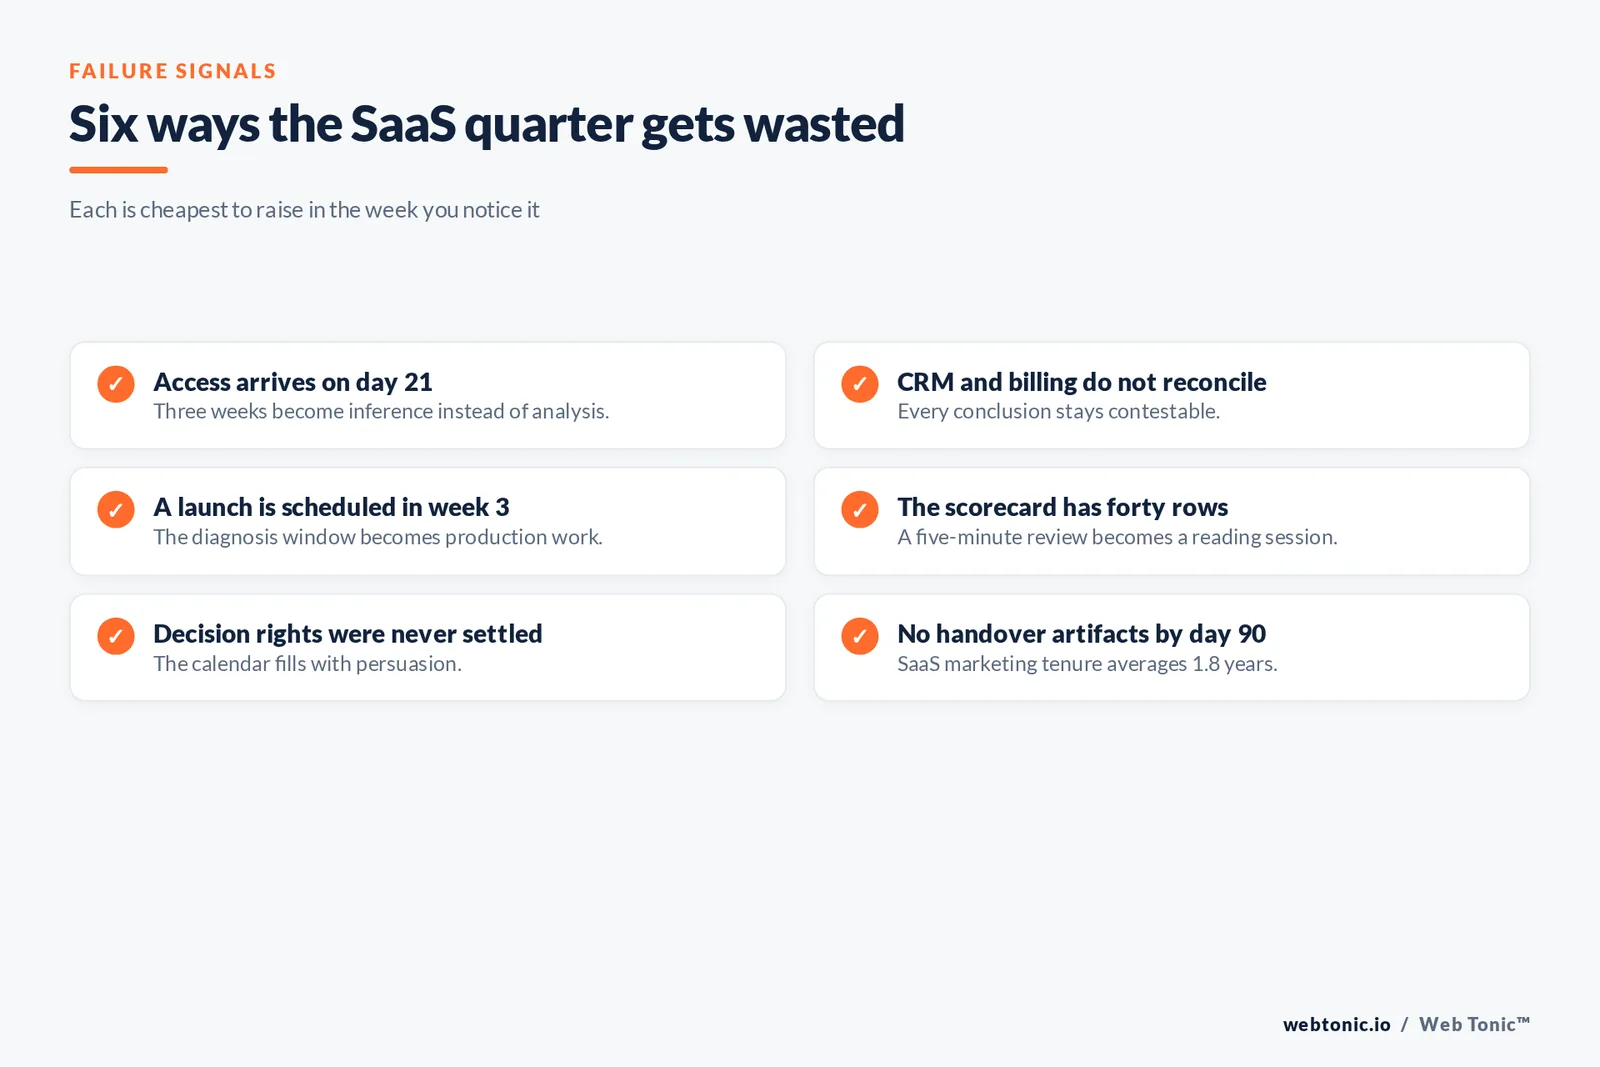
Six ways the SaaS quarter gets wasted
- Access arrives on day 21. Three weeks of the quarter become interviews and inference instead of analysis.
- Revenue numbers do not reconcile between CRM and billing, so every conclusion is contestable and nothing is decided.
- A launch is scheduled in week 3 to show momentum, spending the diagnosis window on production work.
- The scorecard has 40 rows. A review meant to take 5 minutes becomes a reading session and stops happening.
- Decision rights were never settled, so each recommendation is re-argued and the calendar fills with persuasion.
- No handover artifacts exist by day 90 — a real risk given SaaS marketing tenure of roughly 1.8 years, per analysis of 14,000 executives.
Each of these is cheapest to raise in the week you notice it. A fractional engagement has no slack for a lost month, which is exactly why the gates above are worth agreeing in advance.
What to expect from the board pack at day 90
By the end of the quarter, the marketing section of the board pack should have changed shape. Instead of activity counts, it carries a small set of numbers with lineage: qualified pipeline by segment, payback by segment, spend efficiency against ARR, and the two or three plays in flight with their leading indicators. Spencer Stuart's 2026 tenure work records S&P 500 CMO tenure at 4.1 years against 5.0 for all C-suite roles, and sector analysis puts B2B SaaS at 3.0–3.5 years; a board pack whose numbers are reproducible is the cheapest defence against that churn.
What should not appear is a payback improvement claim. On a 16-month median cycle, the honest 90-day statement is: here is the corrected baseline, here are the leading indicators that moved, here is what we stopped.

Web Tonic runs the diagnose-then-decide order deliberately, with the scorecard and stop list as fixed deliverables of the first quarter — that is the structure behind our fractional CMO engagements. When the diagnosis points at execution, growth marketing, performance creative and data intelligence pick up the build. To map a quarter against your own numbers, get in touch, or read more on the blog.
Related reading
- Fractional CMO: the first 90 days
- Fractional CGO / Head of Growth: the first 90 days
- Marketing Strategy Consulting: the first 90 days
- Fractional CMO services at Web Tonic
Frequently Asked Questions
What should exist after 30 days?
An evidence-backed ICP, segment-level payback from real cohorts, and a written list of the funnel's leak points. If any of the three is missing, the access problem from day 7 was never solved.
Should campaigns launch in the first 90 days?
Two or three prioritised plays, yes, in the final 30 days. Launching in week three trades the diagnosis window for the appearance of momentum, and usually costs a quarter.
How do we know the engagement is working at day 90?
Four tests: the scorecard reconciles, something has been stopped with a date, the weekly rhythm runs without the leader present, and the board pack carries numbers with lineage.
Is 90 days enough to change CAC payback?
No. With a median payback of 16 months, a quarter changes leading indicators and decisions. Expect the economics to show up over two to three quarters.
What if we do not like the direction at day 60?
Say so at day 60. Most engagements carry a 30-day notice period, and a scope re-cut at the day-90 review is normal practice rather than a failure.
Sources: Aleph × Benchmarkit SaaS & AI benchmarks 2026 · Growth Centr B2B SaaS CAC benchmarks 2026 · B2B Centr CAC payback analysis 2026 · Data-Mania B2B SaaS benchmarks 2026 · RankedCMO fractional CMO cost 2026 · Fractional Pulse retainer guide 2026 · SaaStr executive tenure analysis · Spencer Stuart CMO Tenure 2026 · Behind the CMO tenure statistics 2026.


