



Table of contents
TikTok has become one of the fastest-growing advertising channels for hospitality brands, with 78% of fast-food chains now running paid campaigns on the platform (Zipdo, 2026). Here are the benchmarks and results that matter most for dining establishments, caterers, and QSR operators.
Key Takeaways
- Food & Beverage TikTok CPC averages $0.52, ranging from $0.30 to $0.80 — roughly 30% cheaper than Meta for equivalent reach.
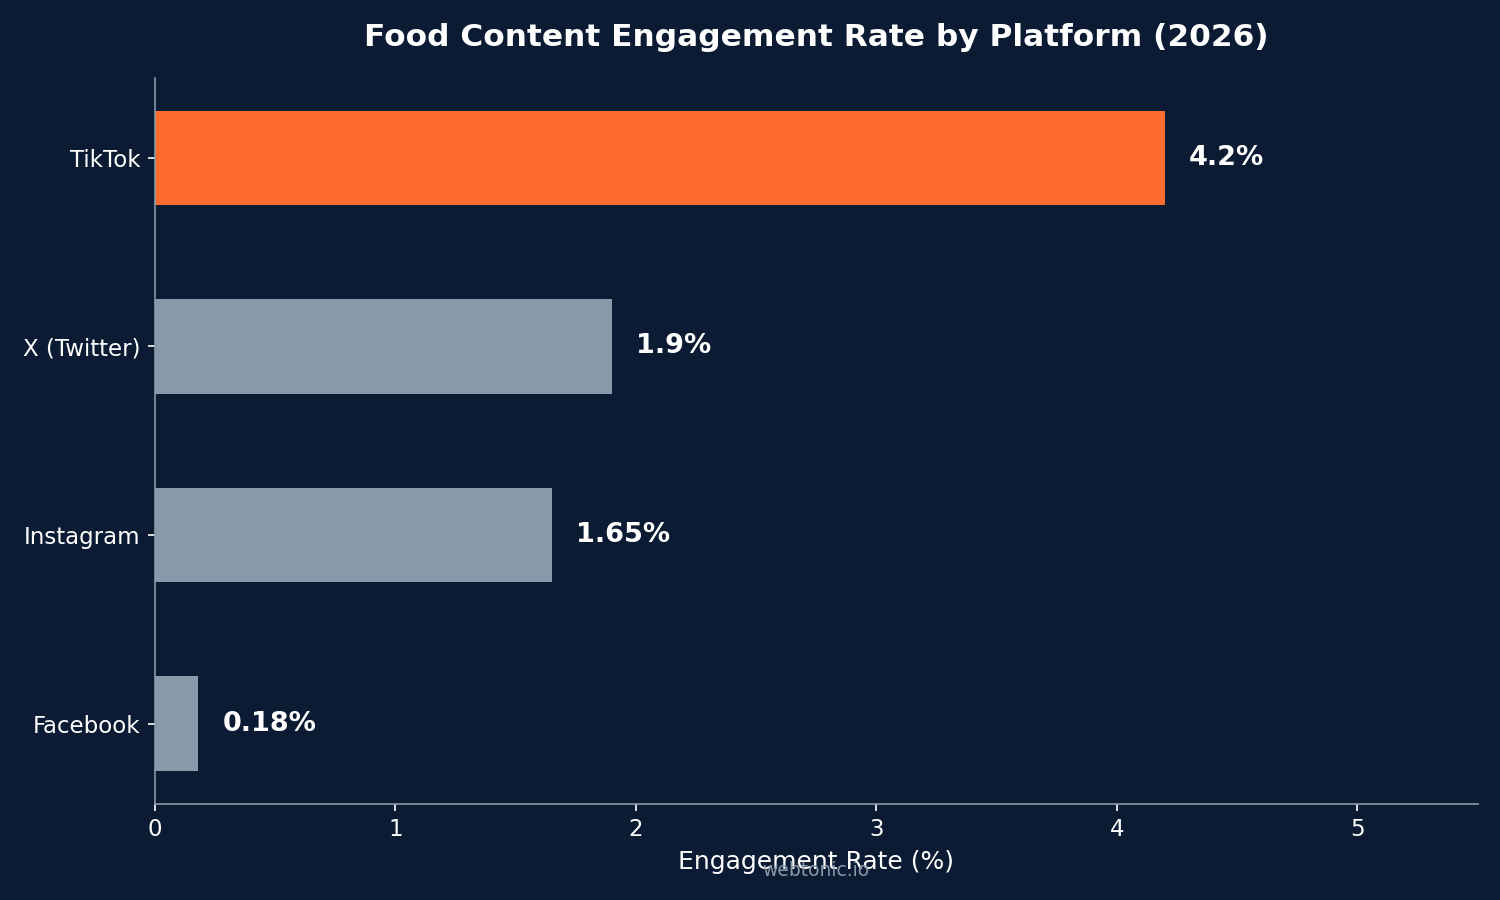
- TikTok engagement rates for food content hit 4.2%, more than double Instagram's 1.65% for the same vertical.
- Fast-food brands spent $1.3 billion on TikTok ads in 2023, accounting for 15% of all TikTok ad revenue.
- LTO campaigns on TikTok drive a 25.8% transaction rate lift among exposed diners.
- Food & Beverage conversion rates on TikTok average 2.17%, placing the category in the top five across all industries.
TikTok Ad Cost Benchmarks for Food Service (2026)
Cost efficiency is the primary reason hospitality advertisers are shifting budget to TikTok. The platform's median CPC for Food & Beverage sits at $0.52 (Rule1, 2026), roughly half of what most brands pay on Meta for cold-audience prospecting. Here is how the key metrics stack up.

| Metric | Food & Beverage Avg. | Range | Source |
|---|---|---|---|
| CPC (In-Feed) | $0.52 | $0.30–$0.80 | Rule1, 2026 |
| CPC (Spark Ads) | $1.05 | $0.80–$1.50 | Hawky, 2026 |
| CPM (DTC F&B) | $18.40 | $10.80–$30.20 | AdLiftr, 2026 |
| CPM (Awareness) | $5–$10 | Varies by format | Benly, 2026 |
| CTR | 1.12%–1.9% | Format-dependent | Hawky / Rule1 |
| CPA | $53.03 | Median across F&B | Hawky, 2026 |
| Conversion Rate | 2.17% | Top 5 across industries | TikAdSuite, 2026 |
Engagement Rates: Food Content Outperforms Most Verticals
Food is one of the most engaging content categories on TikTok. Catering and restaurant content achieves a 4.2% engagement rate (CuFinder, 2026), compared to 1.45% on Instagram and 0.18% on Facebook for the same industry. The platform's algorithm rewards visually stimulating food content, which gives performance creative strategies a natural advantage here.
| Platform | Food Engagement Rate | Advantage vs. Cross-Industry Avg. |
|---|---|---|
| TikTok | 4.2% | +68% above platform avg (2.5%) |
| 1.45%–1.65% | In line with platform avg | |
| 0.18% | Below platform avg | |
| X (Twitter) | 1.9% | Above platform avg (0.6%) |
Dash Social's 2026 benchmark report places the ideal food-and-beverage TikTok engagement target at 3.0%–3.5% (Dash Social, 2026), while Kyra's creator-level data shows top food creators reaching 5.6% on average with branded content (Kyra, 2026).
Food Industry TikTok Ad Spend & Market Share
Fast-food brands alone poured $1.3 billion into TikTok ads in 2023, representing 15% of all TikTok advertising revenue (Zipdo, 2026). Restaurant digital ad spend as a whole grew approximately 25% year over year in 2025 (QSR Pro, 2026), and much of that growth flowed into short-form video. Applebee's reported a 760% increase in TikTok investment while cutting television spend, reflecting a broader industry shift toward platforms that deliver measurable foot traffic.
More than 60% of TikTok users are between 16 and 34 years old — precisely the demographic that eats out multiple times per week (QSR Pro, 2026). For brands looking to reach younger diners without the premium of television, TikTok's cost-per-engagement remains among the lowest in growth marketing.
ROAS & Conversion Benchmarks for Food Advertisers
Return on ad spend varies significantly by campaign type. A programmatic restaurant campaign in Atlanta achieved 3.2x ROAS with 350 reservations from 1.25 million impressions and a 1.1% CTR (Paid Media Studio, 2026). Meanwhile, Hawky's cross-industry benchmarks peg the median Food & Beverage TikTok ROAS at 0.49 for direct last-click attribution (TikAdTools, 2026) — a figure that understates true value because most restaurant conversions happen offline.
| Metric | Food & Beverage | Cross-Industry Avg. | Source |
|---|---|---|---|
| Conversion Rate (TikTok Shop) | 2.17% | 2.35% | TikAdSuite, 2026 |
| TikTok-to-Booking Rate | 0.5%–1.5% | N/A (offline) | Intermenu, 2026 |
| Transaction Rate Lift (LTO) | +25.8% | N/A | InMarket, 2026 |
| Transaction Size Lift | +1.57% | N/A | InMarket, 2026 |
| Video Completion Rate | 25%–35% | 20%–28% | Benly, 2026 |
InMarket's 2026 study of dining-brand LTO campaigns found that customers exposed to TikTok ads transacted at a 25.8% higher rate and spent 1.57% more per visit than unexposed diners (InMarket, 2026). These lift metrics are especially relevant for food service operators who measure success by in-store traffic rather than online checkout.
Campaign Case Studies: Real Results from Food Brands
The strongest evidence for TikTok's effectiveness in food service comes from documented campaign results. Below are verified outcomes from brands of different sizes.
| Brand | Campaign Type | Key Result | Source |
|---|---|---|---|
| Konesso (coffee) | Spark Ads + UGC | 80.4% revenue increase, 77.6% more transactions | TikAdSuite |
| IHOP | In-Feed Ads (Reach) | 33M reach, 134K clicks, 289K likes | CaseStudies.com |
| Jack in the Box | Influencer + Paid | 3x conversion increase, 913% follower growth | Kyra |
| Atlanta Restaurant | Programmatic | 3.2x ROAS, 350 reservations | Paid Media Studio |
| Applebee's | Full digital shift | 760% TikTok spend increase, cut TV budget | QSR Pro |
Jack in the Box's campaign stands out for combining creator-led content with paid amplification, producing a 19% drop in cost per view through creator repurposing and a 4x overall ROI (Kyra, 2026). This model — organic-first content boosted as Spark Ads — has become the default playbook for food brands, and aligns well with performance creative frameworks.
Ad Format Performance Comparison
Not all TikTok ad formats perform equally for food brands. Spark Ads — which boost existing organic content — consistently outperform standard in-feed placements. Joli App's UK restaurant data shows Spark Ads delivering 64% higher click-through rates than standard in-feed ads (Joli App, 2026).
| Format | Avg. CPC | Avg. CTR | Best Use Case |
|---|---|---|---|
| In-Feed Ads | $0.52 | 1.1%–1.5% | Broad awareness, menu launches |
| Spark Ads | $1.05 | 1.8%–2.4% | UGC amplification, social proof |
| Search Ads | Varies | High intent | Local discovery, near-me queries |
| TopView | Premium | 7%–10% | Grand openings, national LTOs |
Best Practices for Food Service TikTok Advertising
- Lead with Spark Ads, not polished creative. Authentic UGC content boosted as Spark Ads delivers 64% higher CTRs and lower CPCs than studio-produced ads.
- Budget $1,000–$3,000/month for testing. Most UK restaurants spend within this range to generate meaningful data before scaling (Joli App, 2026).
- Target 16–34 year-olds within a 10-mile radius. Over 60% of TikTok users fall in this age band, and local targeting keeps CPA manageable for single-location operators.
- Measure footfall, not just clicks. TikTok-to-booking conversion runs 0.5%–1.5% (Intermenu, 2026), but volume is far higher than email — pair with in-store attribution to capture the full picture.
- Run limited-time offers. InMarket data shows LTO campaigns produce the strongest transaction lifts (+25.8%), making time-bound promotions the most effective food-service ad strategy on TikTok.
- Use a data intelligence layer to connect TikTok impressions to POS transactions and close the offline attribution gap.
Food Service vs. Other Industries on TikTok
| Industry | Avg. CPC | Avg. CTR | Conversion Rate | Engagement Rate |
|---|---|---|---|---|
| Food & Beverage | $0.52 | 1.12% | 2.17% | 4.2% |
| Beauty & Personal Care | $0.74 | 1.32% | 2.19% | 3.8% |
| Retail / eCommerce | $0.79 | 1.18% | 2.45% | 2.9% |
| Health & Wellness | $0.90 | 1.09% | 1.68% | 2.4% |
| Fashion & Apparel | $0.86 | 1.28% | 2.37% | 3.5% |
Food & Beverage commands the lowest average CPC on TikTok across major consumer verticals — a direct result of the platform's algorithm favoring visually engaging food content. While conversion rate trails Retail and Fashion slightly, the engagement rate of 4.2% is the highest of any consumer category, signaling strong upper-funnel brand affinity that supports long-term customer acquisition. For a full breakdown of how Facebook ad costs compare, see our pricing guide.
Video Completion & Creative Performance Metrics
Video completion rate is a critical metric for food service advertisers because it correlates directly with brand recall and purchase intent. Food & Beverage awareness campaigns achieve 25–35% video completion rates, outperforming the cross-industry average of 20–28% (Benly, 2026). This advantage comes from the inherently visual nature of food content — plating shots, cooking processes, and behind-the-scenes kitchen footage naturally hold attention longer than most product categories.
For consideration-stage campaigns, completion rates drop to 20–30%, which is expected as these ads include stronger calls to action that interrupt passive viewing. The key optimization lever is keeping food ads under 15 seconds for awareness and using the first 3 seconds to show the food itself — not the brand logo. TikTok's algorithm rewards content that generates watch-time, which means the creative must earn attention frame by frame.
Spark Ads continue to outperform standard placements on every creative metric. Because they boost existing organic posts, they carry social proof (likes, comments, shares) that standard in-feed ads lack. For food brands, this translates to higher trust signals — a critical factor when the conversion action is visiting a physical location or ordering for delivery. The combination of lower CPC, higher CTR, and built-in social proof makes Spark Ads the default creative format for food service advertisers in 2026.
Audience Demographics & Targeting for Food Brands
TikTok's audience composition aligns almost perfectly with the QSR and casual dining customer base. Over 60% of TikTok users are aged 16–34, the demographic most likely to eat out multiple times per week and to discover new restaurants through social media rather than search engines. This age group is also more receptive to limited-time offers, influencer recommendations, and UGC-style content — all of which are the most effective ad formats on the platform.
For catering businesses targeting corporate clients, TikTok's value is less direct but still meaningful. Corporate event planners increasingly use social media to evaluate vendors, and a strong TikTok presence serves as a portfolio and trust signal. Catering brands that showcase large-scale event setups, behind-the-scenes preparation, and testimonial content on TikTok can build awareness that supports their Google Ads and SEO efforts indirectly.
The platform's location-based targeting is particularly valuable for single-location restaurants. Advertisers can set radius targeting as tight as 10 miles, ensuring that ad spend only reaches potential diners within a reasonable delivery or drive distance. Combined with interest-based targeting (food, dining, delivery apps), this creates a high-intent local audience at a cost that competes favorably with Google Local Services Ads.
Frequently Asked Questions
How much do TikTok ads cost for restaurants?
Restaurant TikTok ads typically cost $0.30–$0.80 per click for in-feed placements and $5–$10 CPM for awareness campaigns. Spark Ads run higher at $0.80–$1.50 CPC but deliver significantly better engagement and conversion rates.
What is the average ROAS for food brands on TikTok?
Direct last-click ROAS for Food & Beverage averages 0.49x, but this metric understates true value since most restaurant conversions happen in-store. Programmatic campaigns with foot-traffic attribution report 2.5x–3.2x ROAS.
Are TikTok ads effective for local restaurants?
Yes. TikTok's location-based targeting lets single-location restaurants reach nearby diners at a fraction of traditional ad costs. Documented case studies show 25.8% transaction rate lifts and 30%+ traffic increases for local campaigns.
What TikTok ad format works best for food service?
Spark Ads — which amplify existing organic content — consistently deliver the strongest results for food brands, with 64% higher CTRs than standard in-feed ads. UGC-style creative outperforms polished studio content across every restaurant campaign metric.
How does TikTok engagement compare to other platforms for food content?
TikTok's 4.2% food engagement rate is roughly 2.5x higher than Instagram (1.65%) and more than 20x higher than Facebook (0.18%). This gap makes TikTok the most efficient platform for building brand awareness with food-focused audiences.
Sources
rule1.ai
hawky.ai
adliftr.com
tikadsuite.com
cufinder.io
zipdo.co
inmarket.com
qsr.pro
paidmediastudio.com
intermenu.io


