Table of contents
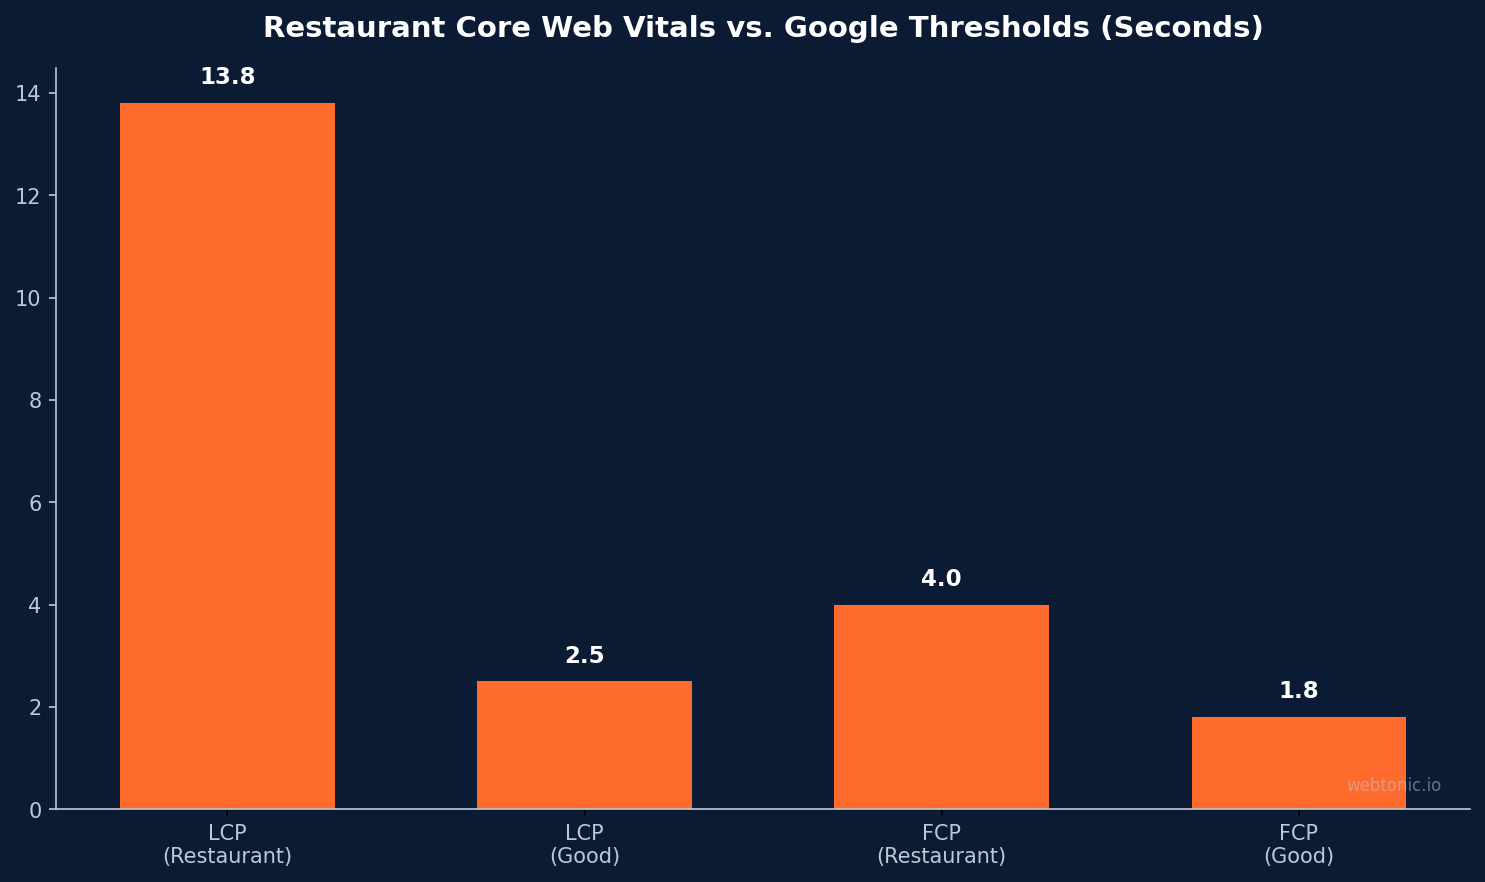
The average restaurant website takes 13.8 seconds to render its main content, more than 11 seconds beyond Google's passing threshold, and 79% of restaurant homepages are missing city or state in their title tags. Here is every technical SEO metric food-service operators need to close those gaps and recapture the organic traffic and revenue they are leaving on the table.
Key Takeaways
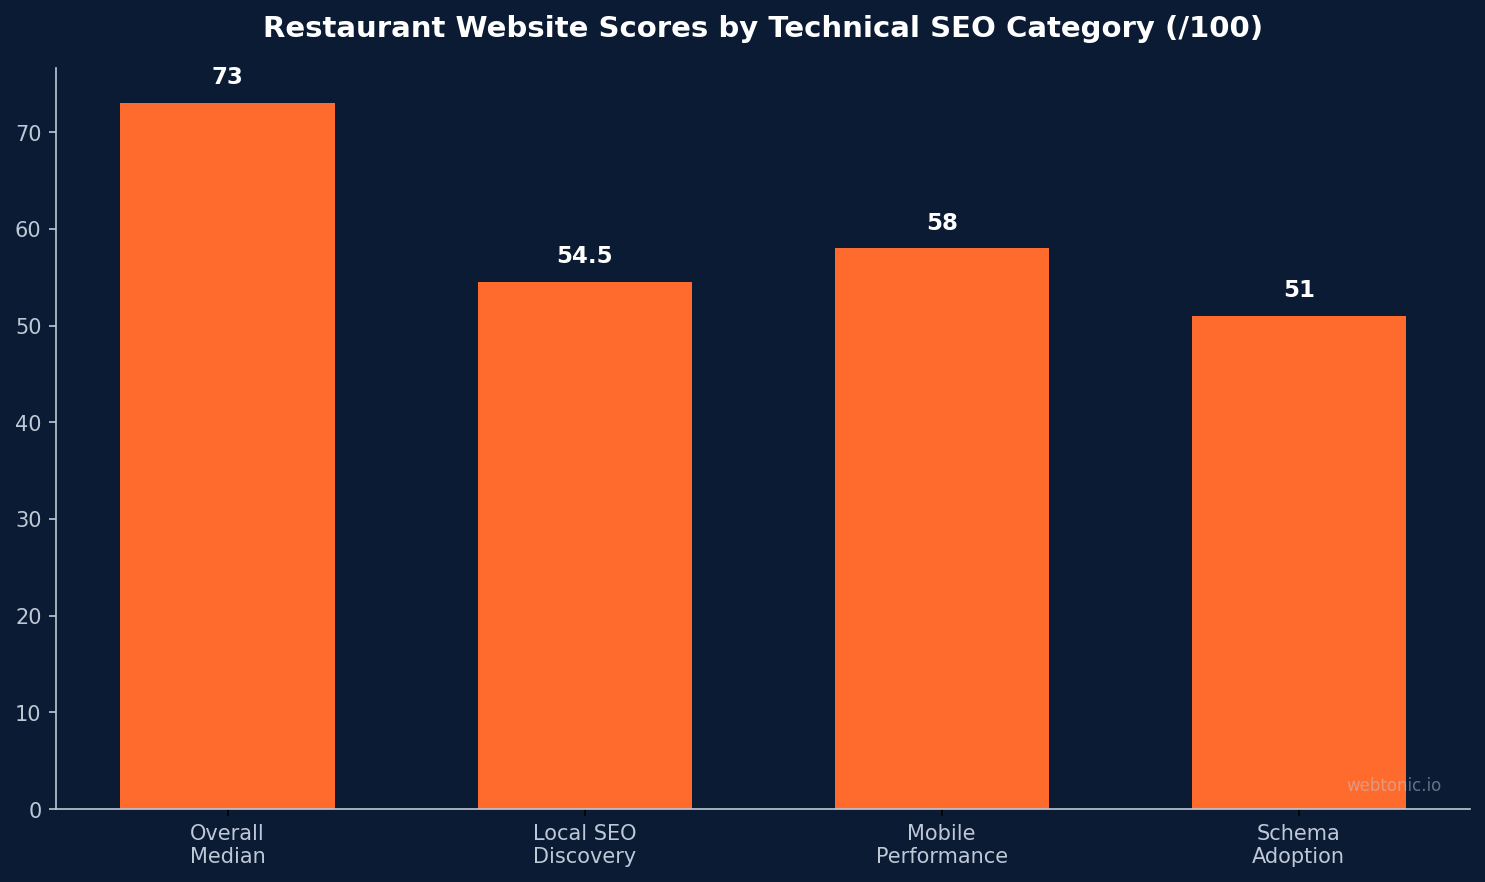
- Restaurant websites score a median 73 out of 100 on PageSpeed, with the average dropping to 71.6 due to heavy food photography dragging down Core Web Vitals (Codivox).
- Average restaurant LCP is 13.8 seconds versus Google's 2.5-second good threshold, making food-service sites among the slowest industry verticals (Borah Labs).
- 78.4% of restaurant website traffic comes from mobile devices, yet 62.5% of visitors bounce, driven largely by slow load times on small screens (CuFinder).
- Rich results capture 58% of clicks on SERPs versus 41% for non-rich results, but 79.1% of restaurant homepages lack proper local SEO title tags (Semark).
- The Map Pack captures roughly 44% of all clicks for local restaurant searches, getting 3x more clicks than organic blue-link results (SeedTech).
Restaurant Website Core Web Vitals (2026)
Google's three public page-experience metrics reveal how far restaurant websites lag behind acceptable performance thresholds. The data below reflects real-user measurements from July 2026, covering a broad sample of restaurant sites across all cuisine types and business models.
| Metric | Restaurant Avg | Google Good Threshold | Gap |
|---|---|---|---|
| LCP (Largest Contentful Paint) | 13.8s | 2.5s | +11.3s over threshold |
| FCP (First Contentful Paint) | 4.00s | 1.8s | +2.2s over threshold |
| CLS (Cumulative Layout Shift) | 0.12 approx | 0.10 | +0.02 |
| TTFB (Time to First Byte) | 0.06s | 0.80s | Passing |
| INP (Interaction to Next Paint) | Varies | 200ms | 74% web-wide pass rate |
Source: Borah Labs (July 2026 data). LCP is the critical failure point because unoptimized food photography is the primary culprit. Only 59% of mobile pages web-wide reach the good LCP bucket, and restaurants underperform even that average due to high-resolution images of dishes, menus, and interiors (DineHere.ai). Teams managing data intelligence should prioritize image optimization as the highest-ROI technical fix available.
Mobile Performance and User Behavior Statistics
Mobile dominates restaurant web traffic, making mobile performance the single most important technical factor for food-service SEO. A site that loads slowly on mobile loses diners before they ever see the menu, let alone make a reservation or place a delivery order.
| Metric | Value | Source |
|---|---|---|
| Mobile Traffic Share | 78.4% | CuFinder 2026 |
| Average Bounce Rate | 62.5% | CuFinder 2026 |
| Food and Drink Bounce Rate | 65.52% | BlockAgency |
| Mobile Abandonment (over 3s) | 53% | RichMenu |
| Poor Experience Return Drop | 79% | RichMenu |
| Mobile Organic Traffic Share | 70% to 85% | AuthoritySpecialist |
| Always Order Delivery on Mobile | 64% | DoorDash/Datalily |
53% of mobile users abandon pages loading beyond 3 seconds, and 79% who have a poor experience will not return to order (RichMenu). With 78.4% of restaurant traffic on mobile, a slow site directly translates to lost reservations and delivery orders. Food and drink websites have a 65.52% bounce rate, significantly higher than the 58% to 60% range for other mobile site categories (BlockAgency). Restaurants investing in growth marketing must treat mobile speed as a prerequisite, not an optimization.
Schema Markup and Structured Data Adoption
Structured data is one of the highest-ROI technical SEO investments for restaurants, yet adoption remains remarkably low across the industry. The gap between opportunity and implementation represents one of the largest underpriced competitive advantages in food-service digital marketing.
- Schema.org adoption reached 51% of all web pages in 2024, with JSON-LD commanding a 70% format share and continuing to grow (Presenc AI).
- Only 694 websites use FoodEstablishment schema, placing it at number 79 among 2,167 tracked schema types, a massive adoption gap for the restaurant industry.
- Rich results generate 58% of SERP clicks versus 41% for standard results, making schema one of the easiest CTR wins available for any restaurant willing to implement it (Semark).
- Restaurant AggregateRating schema delivers 8 to 15% CTR lift on search snippets where star ratings display, a direct and measurable traffic increase (Muntin Digital).
- AI Overview citations run 3.1x higher on schema-valid pages, making structured data critical for visibility in AI-powered search experiences that are increasingly driving food discovery (Presenc AI).
- The gap between schema deployment and validation is 4 percentage points, representing the largest underpriced opportunity in 2026 technical SEO (Digital Applied).
Local Search and Discovery Statistics
Technical SEO and local search are deeply intertwined for restaurants. A technically sound site feeds directly into Map Pack visibility, Google Business Profile signals, and the local discovery algorithms that drive the majority of restaurant search traffic.
| Local SEO Metric | Value |
|---|---|
| Map Pack Click Share | Approximately 44% of local restaurant clicks |
| Map Pack vs. Organic CTR | 3x more clicks than blue links |
| Near Me Voice Search Growth | +30% to 50% YoY |
| Title Tags Missing City or State | 79.1% of restaurant homepages |
| Local SEO Score (Avg) | 54.5 out of 100 |
| Mobile Delivery Orders | 64% always order on mobile |
| Online Reviews Influence | 67% of consumers |
| Organic CTR for Top 10 | 3% to 7% |
Sources: SeedTech, Codivox, Authority Specialist. Local SEO scored the lowest category at 54.5 out of 100 in Codivox's restaurant website study, a direct consequence of missing location signals in title tags, poor schema implementation, and incomplete Google Business Profile integration. For restaurants running Google Ads, fixing these technical foundations amplifies both organic and paid local visibility.
The Revenue Cost of Slow Restaurant Websites
A 2026 audit of 50 independent restaurant websites quantified the direct revenue impact of technical friction, putting real dollar figures on the consequences of poor technical SEO performance.
- Median revenue leaked: 0.94% of total revenue through site friction alone, with 43 out of 50 restaurants having at least 3 of 6 common leaks active (Muntin Digital).
- Median monthly dollar leak: $3,128 per operator, money lost to slow pages, broken reservation flows, and poor mobile experiences that prevent diners from completing their intended actions.
- Bounce probability increases by 32% as page load time goes from 1 to 3 seconds, and by 90% from 1 to 5 seconds according to Google's own research data.
- Restaurant websites lose 40% to 60% of mobile visitors before they even see the menu, meaning the majority of potential diners never engage with the site's primary content.
- Responsive images reduce mobile page weight by 34% on average using srcset with WebP and AVIF formats, making image optimization the single fastest path to meaningful LCP improvement.
For a full-service restaurant doing $4M in annual revenue, that 0.94% leak represents $37,600 in recoverable revenue per year, often fixable with image compression, lazy loading, and reducing third-party scripts. Understanding these cost benchmarks helps prioritize technical improvements alongside paid acquisition budgets.
Technical SEO Priorities for Food-Service Websites
- Compress and lazy-load food photography using responsive images with srcset, WebP, and AVIF formats. This reduces mobile page weight by an average of 34% and is the single fastest path to LCP improvement for restaurant sites.
- Implement Restaurant schema with JSON-LD including Restaurant type, Menu, AggregateRating, OpeningHoursSpecification, and FAQPage. With only 694 sites using FoodEstablishment schema, early adopters gain significant SERP visibility and AI search citations.
- Add city and state to title tags since 79.1% of restaurants miss this basic local SEO signal. A simple pattern like Restaurant Name followed by City and State can lift local search visibility immediately.
- Target sub-2-second LCP on mobile as Google's updated threshold is tighter than before. Every second above 3 seconds loses approximately 7% more visitors to abandonment.
- Audit reservation and chat widgets because booking platforms and chat scripts are the primary blockers for INP (Interaction to Next Paint) compliance on restaurant sites, adding JavaScript execution time that delays user interactions.
- Validate schema with zero errors since the 4-point gap between schema deployment and validation is the largest underpriced opportunity in technical SEO. Run Google's Rich Results Test on every deployed schema type before considering the implementation complete.
- Implement a mobile-first design approach given that 78.4% of restaurant traffic comes from mobile devices. Desktop-first designs that are retroactively adapted for mobile consistently underperform purpose-built mobile experiences.
Restaurant Website Technology Stack Statistics
The technology choices underlying restaurant websites have a direct impact on technical SEO performance. Platform selection, hosting infrastructure, and third-party integrations all contribute to the speed and crawlability challenges that food-service sites face.
- Burger and chicken restaurant sites average 13.6-second LCP, nearly identical to the broader restaurant category, indicating that the speed problem is systemic across cuisines and business models rather than limited to specific restaurant types.
- Asian restaurant sites perform slightly better at 9.64-second LCP, likely due to simpler site designs with fewer embedded reservation widgets and smaller image galleries.
- Restaurant sites scoring above 80 out of 100 on PageSpeed represent the top tier of the industry and typically achieve this through dedicated image CDNs, minimal third-party scripts, and optimized reservation widget loading.
- Mobile bounce rates for restaurant sites run 16% higher than desktop, consistent with the broader pattern where mobile devices average 58% to 60% bounce rates versus 48% to 50% on desktop across all industries.
- 61% of mobile searchers are more likely to contact a local business with a mobile-friendly website, reinforcing the direct revenue connection between technical performance and customer acquisition for restaurants.
These statistics underscore why technical SEO cannot be an afterthought for food-service operators. The revenue impact compounds across every mobile visitor, every search impression, and every AI-powered recommendation that relies on structured data quality to surface results. Teams focused on paid search performance should view technical SEO fixes as force multipliers for their advertising investment.
Frequently Asked Questions
What is the average PageSpeed score for restaurant websites?
The median restaurant homepage scores 73 out of 100 on Google PageSpeed, with the mean dropping to 71.6. The primary drag is unoptimized food photography causing high LCP times. Scores above 80 out of 100 put a restaurant site in the top tier of the industry, and achieving this level typically requires image compression, lazy loading, and third-party script optimization.
Why are restaurant websites so slow on mobile?
Unoptimized high-resolution food images are the main culprit, pushing average LCP to 13.8 seconds, more than 11 seconds above Google's 2.5-second threshold. Reservation booking widgets and embedded chat scripts further degrade interactivity metrics like INP by adding heavy JavaScript execution loads to every page view.
Does schema markup improve restaurant search rankings?
Schema does not directly boost rankings, but it significantly improves click-through rates and AI search visibility. Rich results capture 58% of SERP clicks versus 41% for standard results, AggregateRating schema delivers an 8 to 15% CTR lift for restaurant queries, and AI Overview citations are 3.1x higher on schema-valid pages. The indirect traffic gains from these visibility improvements can be substantial.
What percentage of restaurant traffic is mobile?
78.4% of restaurant website traffic comes from mobile devices, with hospitality brands seeing 70% to 85% mobile organic traffic. Combined with the fact that 64% of consumers always order delivery on mobile, this makes mobile-first technical optimization non-negotiable for food-service businesses.
How much revenue do restaurants lose from slow websites?
A 2026 audit of 50 restaurants found they leak a median 0.94% of revenue through site friction, roughly $3,128 per month per operator. For a $4M annual revenue restaurant, that translates to over $37,000 in recoverable annual revenue, most of which can be recaptured through image optimization, lazy loading, and reducing third-party script overhead.
Sources
codivox.com - State of restaurant websites
borahlabs.us - Restaurant website benchmarks
seedtechllc.com - Restaurant SEO statistics 2026
dinehere.ai - Core Web Vitals guide
cufinder.io - Restaurant benchmarks 2026
muntin.digital - Restaurant schema markup guide
richmenu.io - Restaurant website speed 2026
presenc.ai - State of Schema.org for AI 2026
digitalapplied.com - Schema markup adoption audit
semarkglobal.com - Schema markup for restaurants