



Table of contents
Social media ads in financial services return $5.78 per dollar spent, outperforming most industry verticals — yet fewer than one in three fintech companies has a documented social media strategy. Here is a complete statistical breakdown of fintech social media marketing performance heading into 2026.
Key Takeaways
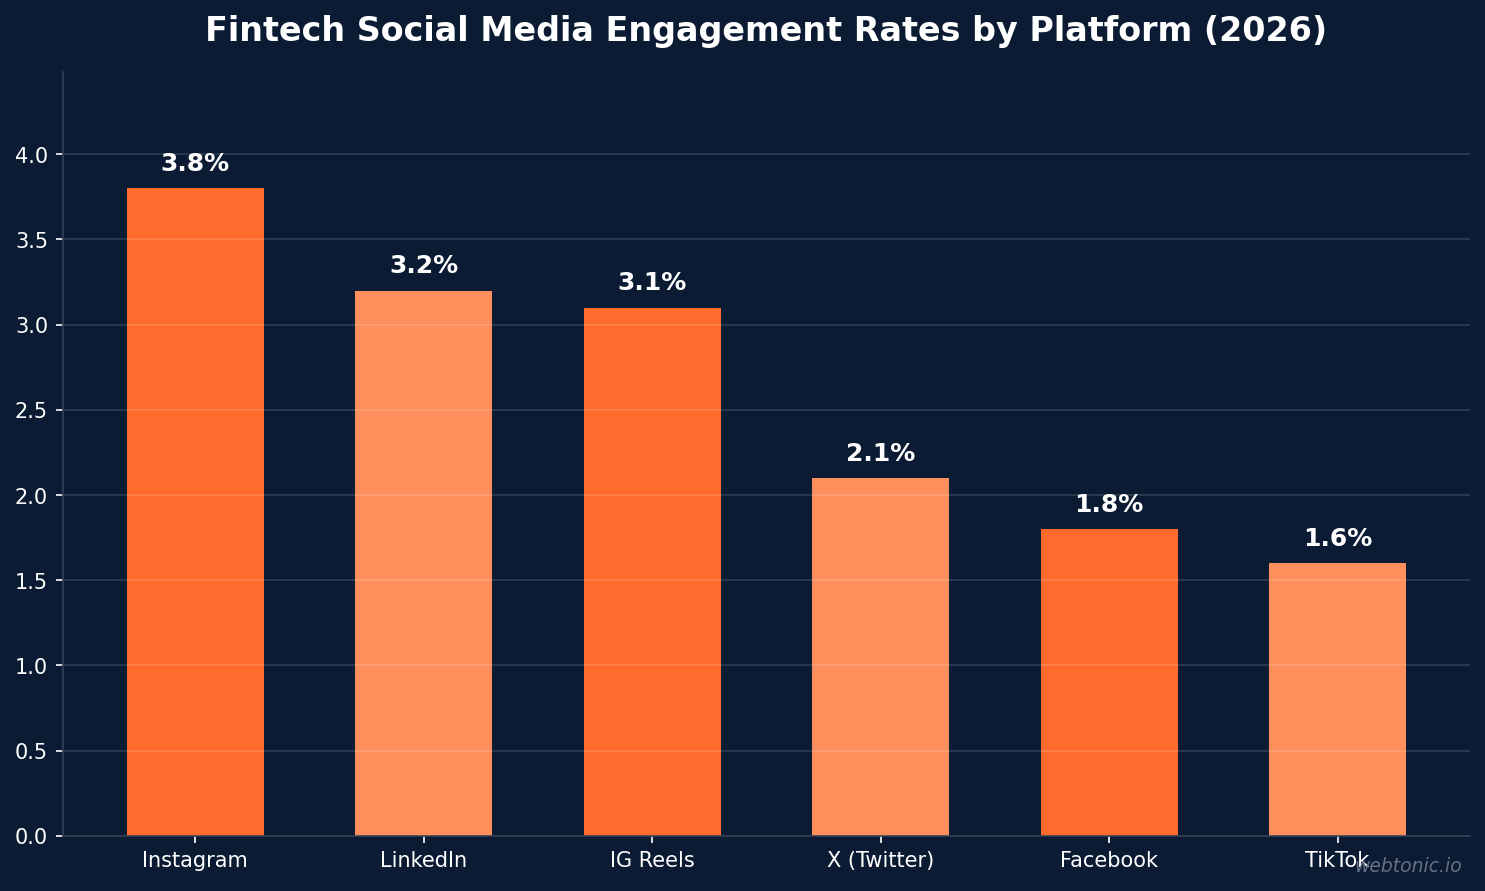
- Instagram leads fintech engagement at 3.8%, followed by LinkedIn at 3.2% and Instagram Reels at 3.1% (Hootsuite).
- Financial services social media ads yield $5.78 per dollar spent, with Facebook insurance leads averaging $4.21 ROI per $1 (Zipdo).
- LinkedIn engagement for B2B fintech hits 1.45%, the highest among B2B-focused platforms, with carousels driving 21.77% median engagement on LinkedIn overall (CuFinder).
- Fintech social campaigns targeting Gen Z see 40% higher engagement than general audience campaigns (World Metrics).
- 48.6% of marketers cite short-form video as a top-three ROI content format, up 104% in perceived value since 2024 (DataAlly).
- 74% of younger users discovered neobanks through social media marketing campaigns in 2025 (TechRT).
Fintech Social Media Engagement Benchmarks
Engagement rates across social platforms reveal where fintech brands get the most traction — and the variation is considerable depending on whether you're running a consumer app or a B2B payments company. Instagram leads at 3.8%, followed by LinkedIn at 3.2% and Instagram Reels at 3.1% across the broader financial services sector (Hootsuite 2026 Financial Services Report). These figures sit above the all-industry average, reflecting the appetite that financial audiences have for platform-specific content when it's relevant and well-executed.
Pure-play fintech startups often see higher variance. LinkedIn engagement for fintech startups ranges from 2.0% to 2.8% for educational and regulatory content, while Twitter/X engagement sits between 0.9% and 1.6%, skewing toward active discussion threads rather than broadcast content (Monolit). CuFinder's B2B-specific benchmarks tell a different story for enterprise fintech: LinkedIn leads at 1.45% while Instagram sits at 0.85% for B2B fintech companies (CuFinder). The discrepancy reflects audience composition — consumer fintech thrives on visual platforms while B2B fintech performs significantly better on professional networks. For companies investing in Meta Ads services, understanding these organic baselines helps calibrate paid amplification strategies.
Fintech Social Media Engagement Rates by Platform (2026)
| Platform | FinServ Avg. | B2B Fintech | Fintech Startups |
|---|---|---|---|
| 3.8% | 0.85% | 2.5-4.2% | |
| 3.2% | 1.45% | 2.0-2.8% | |
| Instagram Reels | 3.1% | N/A | 2.8-3.5% |
| X (Twitter) | 2.1% | 0.9-1.6% | 1.2-2.0% |
| 1.8% | 0.6% | 1.0-1.8% | |
| TikTok | 1.6% | N/A | 2.34% |
Social Media Advertising ROI in Financial Services
Financial services social media advertising consistently delivers strong returns compared to other verticals. Social media ads yield $5.78 per dollar spent across the financial services sector (Zipdo). Facebook ad ROI for insurance leads averaged $4.21 per $1 spent, the highest among platform-specific benchmarks (Gitnux). Financial social media ads achieve a 2.1% click-through rate, nearly double the 1.2% all-industry average (World Metrics).
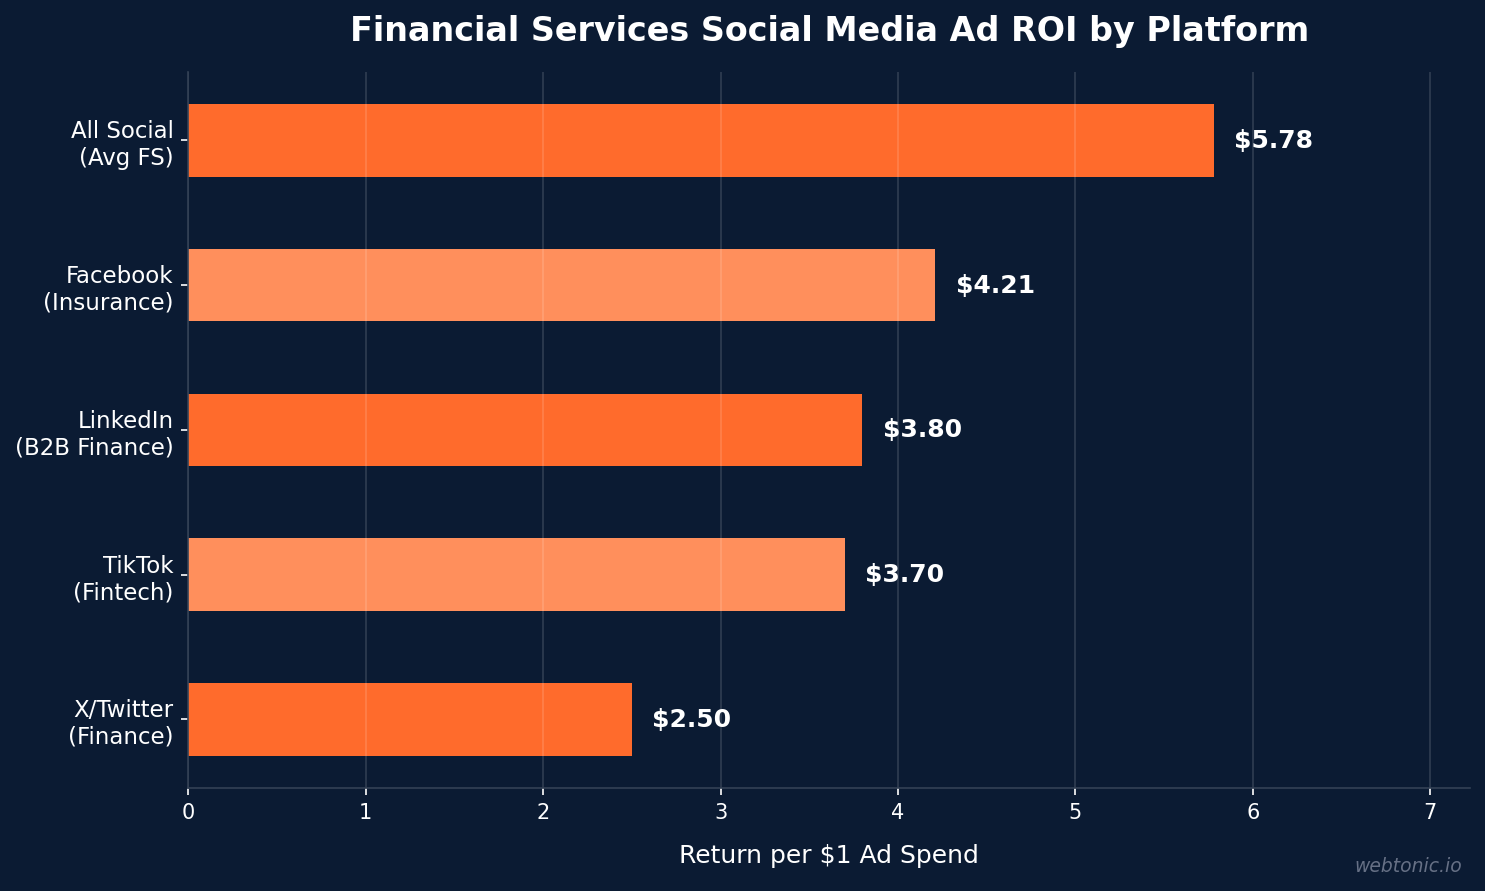
LinkedIn Ads account for 30-45% of paid budgets at B2B financial firms due to precise audience targeting by job title, firm size, and assets under management. However, LinkedIn remains the most expensive channel per lead at $250 to $600+, though it produces the highest lead-to-opportunity conversion rates for B2B finance (Wolf Financial). The combined digital marketing ROI for financial services firms averages 14.6-to-1 when digital channels account for 58% of returns, with top thought leadership content generating five times more engagement than standard promotional content (Gitnux). Understanding these cost dynamics is critical for building an effective Facebook Ads ROI strategy.
Content Format Performance
Short-form video dominates fintech content ROI. A total of 48.6% of marketers cite short-form video as a top-three content format for highest return on investment in 2026, representing a 104% increase in perceived value since 2024 (DataAlly). On TikTok, short-form video under 15 seconds outperforms longer formats by 45% in completion rate and engagement (Paid Media Studio).
LinkedIn carousels are the dark horse of fintech social content, driving 21.77% median engagement — even a below-average carousel performs about as well as a typical video or image post on LinkedIn (IQFluence). For B2B fintech, regulatory commentary content — breaking down new guidance or enforcement actions — is a massive credibility driver with almost zero competition (Monolit). Teams looking to scale their performance creative output should prioritize these high-engagement formats first, then test into newer formats as budgets allow.
Fintech Content Format Performance Benchmarks
| Format | Engagement Index | Best Platform | Key Stat |
|---|---|---|---|
| Short-Form Video | High | TikTok, IG Reels | 48.6% cite as top-3 ROI format |
| LinkedIn Carousels | Very High | 21.77% median engagement | |
| Educational Posts | High | LinkedIn, X | 2.0-2.8% startup engagement |
| Regulatory Commentary | High | LinkedIn, X | Near-zero competition |
| User-Generated Content | Medium-High | Instagram, TikTok | 42% discover fintech via UGC |
Neobank Social Media Performance
Neobanks demonstrate the power of social-first brand building in the fintech sector. Nubank leads with 3.6 million Instagram followers and a Postbox Score of 84/100, while N26 maintains 258,100 followers with consistent posting cadence (Postbox Social Analytics). The neobank social strategy extends beyond follower counts: 74% of younger users discovered neobanks through social media marketing campaigns in 2025 (TechRT).
Monzo's annual "Year in Review" campaign exemplifies effective fintech social content — transforming user transaction data into personalized recap reels that generate high engagement, user sharing, and earned media buzz year after year (Contentworks 2025 Neobank Report). In Nigeria, PalmPay leads fintech social media rankings, while Chime's growth engine in the U.S. has driven 30% year-over-year growth through a combination of community-driven content and peer trust on platforms like Reddit (RightMetric Chime Report 2025). These case studies underscore a broader pattern: the most successful fintech social media strategies combine organic community building with strategic paid amplification, rather than relying on either channel alone. The brands that win on social media in fintech are those that treat their social presence as a product — iterating on content formats, measuring engagement quality, and investing in community management alongside content creation.
Paid Social Media Spend Allocation
Financial services firms allocate 10-15% of total marketing budgets to social media (paid + organic combined), with paid social typically representing 60-70% of that allocation (Scale Growth Digital). By 2025, fintech marketing budgets were projected to hit $30 billion globally, with social media commanding an increasing share as brands shift from traditional advertising (Zipdo).
TikTok Ads delivered a 3.7x ROAS for fintech campaigns in 2026, with programmatic display and video accounting for 22.2% of paid budgets (Paid Media Studio). The platform's B2B lead generation conversion rate stands at 3.20%, with cost-per-lead 62% lower than other popular platforms (ContentBeta 2026 Short-Form Video Report). Global social media user counts now exceed 3.3 billion people, enabling social-channel acquisition campaigns at scale in fintech (Gitnux Fintech Industry Marketing Report). The average person spends more than 2.5 hours per day on social media in 2026, making these platforms essential touchpoints for any fintech brand (DataAlly). Optimizing this spend requires strong growth marketing foundations.
Platform Selection by Fintech Business Model
Platform selection should follow audience and product type, not what is trending. A B2B payments company and a consumer budgeting app have entirely different platform priorities (Widefocus 2026 Fintech SMM Guide). The data supports clear segmentation:
- Consumer fintech (neobanks, budgeting apps, BNPL): Prioritize Instagram (3.8% engagement), TikTok (2.34% engagement, 42% product discovery), and Facebook (1.8% engagement, high-volume reach).
- B2B fintech (payments infrastructure, lending platforms, compliance tools): Focus on LinkedIn (1.45% B2B engagement, $250-$600 CPL but highest lead-to-opportunity conversion), X/Twitter (0.9-1.6% engagement, regulatory discussion threads), and programmatic video.
- Hybrid fintech (platforms serving both consumers and businesses): Run parallel strategies on LinkedIn for B2B and Instagram/TikTok for consumer, with shared creative assets adapted to each platform's format specifications and compliance requirements.
The key insight from Prose Media's 2026 fintech playbook is that intent search remains one of the highest-converting channels for fintech, and social media works best as a mid-funnel awareness and nurture layer rather than a pure acquisition channel (Prose Media 2026 Fintech Playbook). Scaling compliance-approved organic winners with paid distribution is the dominant strategy — fintech teams take high-performing organic posts and extend reach through paid campaigns on LinkedIn and Twitter/X (Fintech Marketing Agency 2026).
Fintech SMM Benchmarks vs. All-Industry Averages
Fintech Social Media Performance vs. All-Industry Benchmarks
| Metric | Fintech/FinServ | All-Industry Avg. | Delta |
|---|---|---|---|
| Social Ad ROI (per $1) | $5.78 | $2.80-$3.50 | +65-107% |
| Social Ad CTR | 2.1% | 1.2% | +75% |
| LinkedIn Engagement (B2B) | 1.45% | ~0.8-1.0% | +45-81% |
| Gen Z Campaign Engagement | +40% vs. general | Baseline | +40% |
| Budget Allocation (Social) | 10-15% | 8-12% | +2-3pp |
Related reading
- Fitness Social Media Marketing Benchmarks: What the Data Says (2026)
- Franchise Social Media Marketing Statistics: 2026 Benchmarks & Engagement Data
- HVAC Social Media Marketing Statistics: Platform Data & Benchmarks for 2026
- Content Marketing services at Web Tonic
FAQ
Which social media platform has the highest engagement for fintech?
Instagram leads fintech engagement at 3.8% in the broader financial services sector, followed by LinkedIn at 3.2% and Instagram Reels at 3.1%. For B2B fintech specifically, LinkedIn dominates at 1.45% engagement, making it the primary platform for enterprise-focused fintech brands. Consumer fintech brands see the strongest results on Instagram and TikTok.
What is the ROI of social media advertising for financial services?
Financial services social media ads return an average of $5.78 per dollar spent. Facebook insurance leads deliver the highest platform-specific ROI at $4.21 per $1, while TikTok fintech campaigns achieve 3.7x ROAS. Financial social ads also achieve 2.1% CTR, nearly double the 1.2% all-industry average. The combined digital marketing ROI averages 14.6-to-1 when digital channels account for 58% of returns.
How do neobanks use social media for customer acquisition?
74% of younger users discovered neobanks through social media marketing campaigns in 2025. Leading neobanks like Nubank (3.6M Instagram followers) and Chime use a mix of community-driven content, personalized recap campaigns, and peer trust on platforms like Reddit to drive organic growth alongside paid acquisition. Monzo's Year in Review campaign generates high engagement and earned media annually.
What content formats perform best for fintech social media?
Short-form video ranks as the top-three ROI format for 48.6% of marketers, up 104% since 2024. LinkedIn carousels drive 21.77% median engagement — even below-average carousels outperform typical video or image posts. Regulatory commentary content has emerged as a high-credibility, low-competition format for B2B fintech brands looking to build thought leadership.
How much should fintech companies spend on social media marketing?
Financial services firms typically allocate 10-15% of total marketing budgets to social media (paid + organic), with paid social representing 60-70% of that total. LinkedIn Ads command 30-45% of B2B paid budgets despite higher CPLs ($250-$600+), due to superior lead-to-opportunity conversion rates. TikTok offers the lowest CPL at 62% below other platforms.
Sources
Hootsuite — Social Media in Financial Services 2026
CuFinder — FinTech Industry Marketing Benchmarks 2026
Zipdo — Financial Services Digital Marketing Statistics
World Metrics — Marketing in the Financial Industry
Monolit — Social Media Benchmarks for Startups 2026
Wolf Financial — Financial Services CPL Benchmarks
DataAlly — Fintech Marketing Trends 2026
Paid Media Studio — TikTok Ads Fintech ROAS
IQFluence — Social Media Benchmarks 2026
TechRT — Neobank Adoption Statistics 2026
Scale Growth Digital — Marketing Budget Guide
Prose Media 2026


