



Table of contents
Fintech advertisers on Meta platforms face some of the highest CPMs in digital advertising — yet the channel consistently delivers a 3.0x median ROAS and 1.3% average CTR across sub-verticals, making Facebook and Instagram indispensable for customer acquisition in 2026. Web Tonic offers growth marketing services tailored to fintech brands navigating these benchmarks.
Key Takeaways
- Fintech CPM on Facebook Feed ranges from $20–$45, with neobanks at the lower end ($18–$28) and lending products commanding premiums up to $45 (AdLibrary).
- The average fintech CPA on Meta is £52 (~$66) with a 3.0x median ROAS, outperforming LinkedIn (£78, 3.6x) on volume efficiency (AdFuse AI).
- Finance/fintech averages a $35.60 CPA on Facebook, making it the most expensive consumer vertical after real estate ($28.90) and SaaS ($22.50) (Get Ryze).
- Video creatives dominate at 48.6% of fintech ad spend, with a median creative lifespan of just 28 days before fatigue sets in (Benly).
- UGC-style ads deliver a 1.6–2.4x CPA advantage over polished brand creative in fintech verticals (BrighterClick).
- Fintech CPM on Meta sits at $19.35 on average, 35% above the all-industry median of $14.34, driven by regulatory targeting restrictions and high LTV competition (Mako Metrics).
- AI-driven fintech campaigns achieved 106,000+ installs in 30 days with controlled CPI through automated placement optimization (Aitarget).
Fintech Meta Ads Cost Benchmarks at a Glance
The table below aggregates 2026 benchmarks from multiple research platforms to give fintech marketers a realistic cost picture across Meta placements.
| Metric | Fintech Average | All-Industry Average | Difference |
|---|---|---|---|
| CPM | $19.35 | $14.34 | +35% |
| CPC | $1.84–$3.77 | $0.77–$1.07 | +139% to +252% |
| CTR | 1.3% | 1.49% | -13% |
| CPA | $35.60–$66 | $22.50–$44 | +50% to +58% |
| ROAS | 3.0x–3.5x | 2.0x–2.5x | +40% to +50% |
Sources: Mako Metrics, AdFuse AI, Get Ryze, ConversionStudio.
CPM and CPC by Fintech Sub-Vertical
Not all fintech products compete in the same auction. Neobanks enjoy the lowest CPMs ($18–$28) thanks to broad consumer appeal, while lending and insurance products face CPMs of $25–$45 due to Special Ad Category restrictions and intense competition from traditional banks. According to AdLibrary's 2026 fintech benchmark report, the sub-vertical breakdown reveals significant cost disparities:
| Sub-Vertical | CPM Range | CTR Range | CPA Range |
|---|---|---|---|
| Neobanks | $18–$28 | 0.80–1.20% | $8–$22 (app install) |
| Payments / Wallets | $15–$25 | 0.90–1.40% | $5–$15 (CPI) |
| Lending / Credit | $25–$45 | 0.55–0.85% | $40–$120 (application) |
| Insurtech | $22–$38 | 0.60–1.00% | $28–$75 (quote request) |
| WealthTech / Robo | $20–$35 | 0.70–1.10% | $35–$90 (funded account) |
| B2B Fintech / SaaS | $28–$50 | 0.50–0.80% | $80–$200 (demo/lead) |
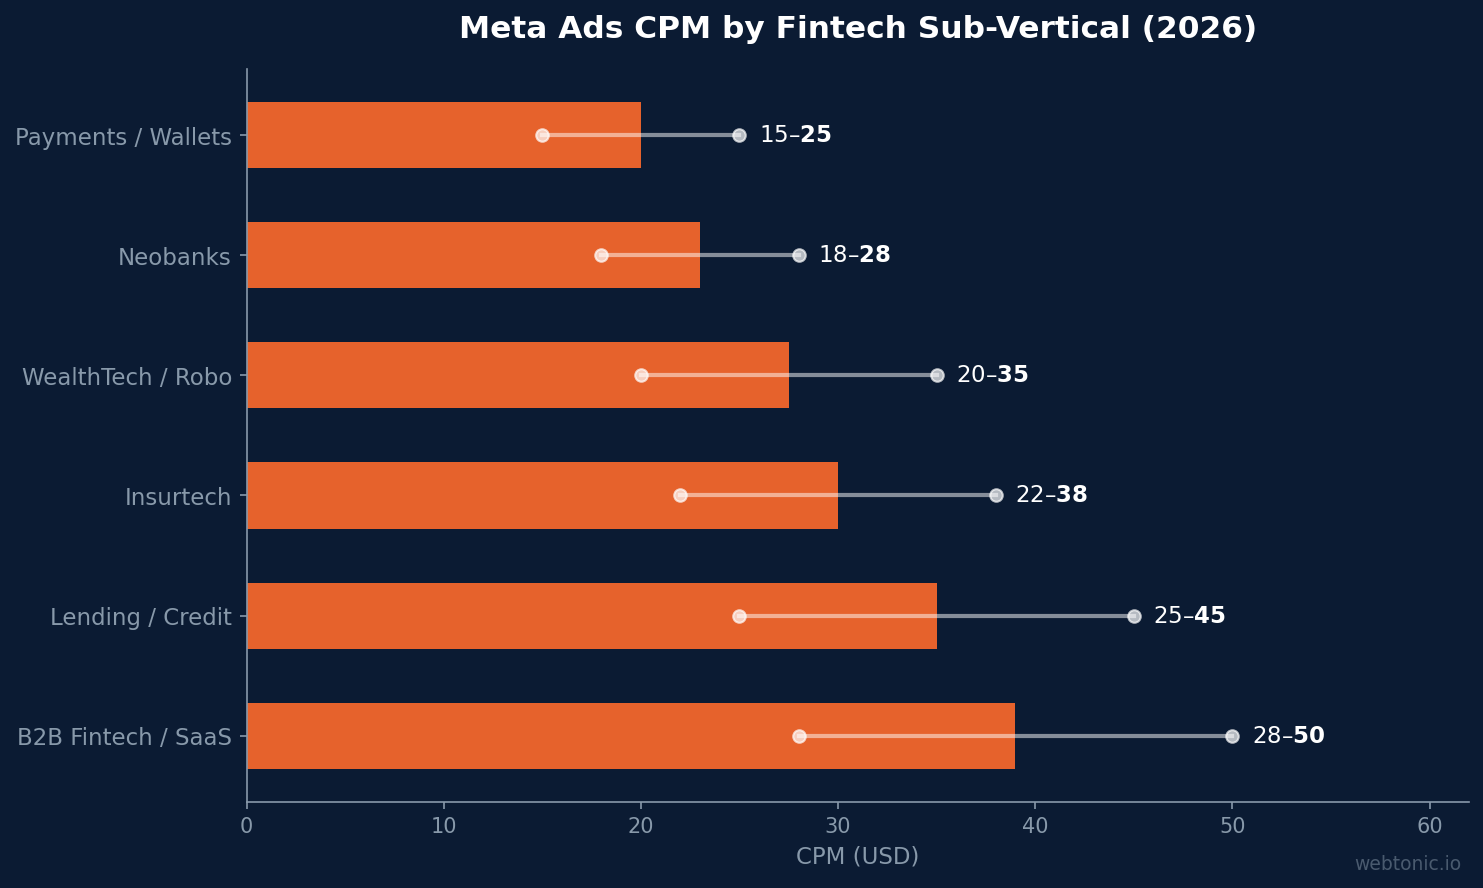
The Special Ad Category classification removes age, gender, and ZIP-code targeting for lending and insurance products, which inflates CPMs by an estimated 15–25% compared to unrestricted fintech categories. ReachCat notes that compliance-first creative actually improves approval rates and reduces account bans that cause even larger cost spikes.
Creative Performance and Fatigue Cycles
Creative strategy is the single biggest lever for fintech advertisers on Meta. Benly's Q1 2026 analysis of 8,600 finance and fintech creatives across 70 brands reveals that the median ad lifespan is just 28 days, with only 47.9% of creatives surviving past the 30-day mark. Video formats account for 48.6% of total ad spend, reflecting Meta's algorithmic preference for motion content.
UGC-style testimonial ads consistently outperform polished brand creative by a factor of 1.6–2.4x on CPA, according to BrighterClick's fintech performance analysis. The pattern holds across neobanks, payment apps, and lending — customers respond to authentic-feeling content that explains financial products in plain language rather than corporate messaging.
Case study data reinforces this. UABand documented a 4x conversion rate improvement for an AI fintech startup by shifting from static image ads to short-form video with problem-solution narratives. N26 achieved a 65% reduction in customer acquisition cost through iterative creative testing that paired user testimonials with product demo sequences (Creative Milkshake).
Platform Cost Comparison: Meta vs. Other Channels
How does Meta stack up against other paid channels for fintech customer acquisition? AdFuse AI's 2026 cross-platform analysis provides a clear picture:
| Platform | Avg CPA | Avg ROAS | Avg CTR | Best For |
|---|---|---|---|---|
| Meta (Facebook/IG) | £52 (~$66) | 3.0x | 1.3% | Consumer apps, scale |
| Google Ads | £68 (~$86) | 3.4x | 1.1% | High-intent search |
| YouTube | £64 (~$81) | 2.8x | 1.0% | Brand + consideration |
| £78 (~$99) | 3.6x | 0.8% | B2B fintech leads | |
| TikTok | £42 (~$53) | 2.2x | 1.5% | Gen Z acquisition |
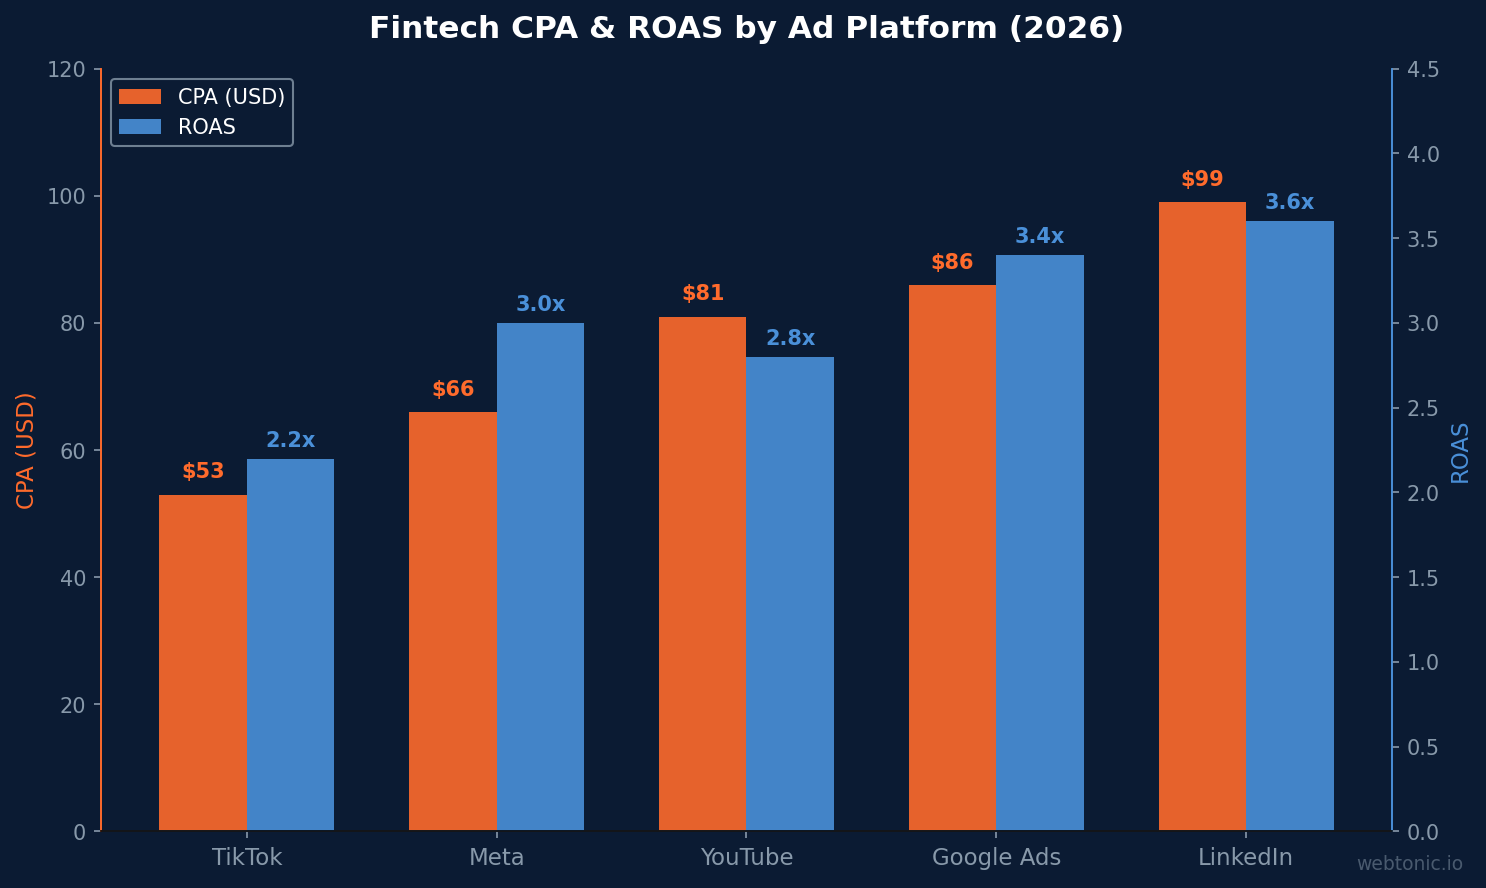
Meta delivers the strongest combination of volume and cost efficiency for consumer-facing fintech. LinkedIn commands a premium but delivers higher ROAS for B2B products. TikTok offers the lowest CPA but with significantly lower ROAS, suggesting the audience converts at lower ticket values.
Scaling Strategies That Work in Fintech
Reaching scale on Meta without blowing past CAC targets requires disciplined budget management. FoundryCRO's 2026 fintech benchmark analysis segments CAC by product type, showing the wide range fintech advertisers face:
- Neobank consumer apps: $50–$200 CAC — the most Meta-friendly segment, where broad targeting and Advantage+ Shopping Campaigns (ASC) drive efficient scale.
- Lending platforms: $150–$800 CAC — Special Ad Category restrictions require compliance-first creative strategies and broader geographic targeting.
- Enterprise fintech / B2B SaaS: $2,000–$14,772 CAC — Meta serves as a top-of-funnel awareness channel, not a direct conversion driver, for high-ticket B2B products.
Aitarget's 2026 case study demonstrates that AI-driven campaign management achieved 106,093 installs in 30 days for a fintech app by automating placement selection and bid optimization, maintaining a controlled CPI throughout the scaling phase. The key was using Advantage+ placements to let Meta's algorithm distribute budget across Facebook Feed, Instagram Reels, and Stories based on real-time auction dynamics.
A separate lending case study by Topkee showed that dynamic creative paired with machine learning placement optimization slashed CPA by 40% while increasing loan applications by 68%, proving that automation outperforms manual placement selection even in regulated categories.
Year-over-Year CPM Trends in Financial Services
Meta advertising costs have followed a predictable inflation trajectory since the iOS 14.5 disruption. ConversionStudio's historical analysis tracks the all-industry CPM evolution:
| Year | All-Industry Avg CPM | All-Industry Avg CPC | Key Driver |
|---|---|---|---|
| 2020 | $8.35 | $0.52 | COVID demand spike, cheap inventory |
| 2021 | $11.10 | $0.74 | iOS 14.5 rollout, e-commerce boom |
| 2022 | $13.20 | $0.91 | Post-ATT turbulence, attribution loss |
| 2023 H1 | $11.54 | $0.77 | Reels inventory expansion |
| 2025 | $13.50–$14.00 | $0.85–$0.95 | Advantage+ adoption, AI bidding |
| 2026 | $14.34 (all) / $19.35 (fintech) | $1.07 (all) / $1.84+ (fintech) | Fintech premium widens |
Redclawey's 2026 industry analysis highlights that finance is experiencing the steepest CPM inflation at 16% year-over-year, second only to SaaS ($29.50 CPM). The fintech premium reflects both high customer lifetime values attracting more bidders and regulatory restrictions limiting targeting precision.
Compliance and Account Health
Fintech advertisers face unique compliance challenges that directly impact ad costs. Account bans and ad disapprovals cause more budget waste than poor targeting — a suspended account loses all learning data and forces a restart from zero. Key compliance considerations for 2026 include:
- Special Ad Category requirements — Lending, insurance, and credit products must be flagged, removing demographic and ZIP targeting. ReachCat's compliance guide notes that neobanks and payment apps are generally exempt unless promoting credit lines.
- Financial claims restrictions — Performance guarantees ("earn 5% interest") require disclaimers. Meta's 2026 enforcement has expanded automated scanning, catching more ads in review.
- Conversions API (CAPI) requirement — Server-side tracking is now essential for accurate attribution. Our data intelligence services help fintech brands implement CAPI correctly. Fintech brands with CAPI implementation see 15–25% more attributed conversions compared to pixel-only tracking, according to industry benchmarks.
- Licensing documentation — Regulated fintech products require proof of licensing during account verification. Welcome Tomorrow recommends preemptive submission of regulatory documentation to avoid review delays.
Best Practices for Fintech Facebook Advertising
For a deeper dive into Facebook Ads pricing across all industries, see our complete Facebook Ads cost breakdown. The fintech-specific best practices below build on those foundations:
- Refresh creative every 21–28 days — With a median lifespan of 28 days (Benly), plan for at least 12–15 new creatives per month per ad set.
- Prioritize UGC and testimonial formats — The 1.6–2.4x CPA advantage over brand creative is too significant to ignore. Film real customer stories or work with a performance creative team or hire creators who can speak authentically about financial products.
- Use Advantage+ Shopping Campaigns for consumer apps — ASC outperforms manual campaigns for neobank and payment app installs by automating audience expansion and placement selection.
- Implement CAPI from day one — Server-side tracking recovers conversions lost to browser privacy restrictions and provides the data quality that Meta's ML models need to optimize effectively.
- Separate regulated and unregulated products — Run lending/credit campaigns under Special Ad Category while keeping general brand awareness campaigns unrestricted to maintain full targeting capabilities.
- Budget allocation by funnel stage — Allocate 60–70% to prospecting (broad + lookalike audiences), 20–25% to retargeting (website visitors, app events), and 10–15% to retention (existing customer upsell).
- Test Reels and Stories placements aggressively — Lower CPMs on newer inventory formats offset the higher production requirements. Short-form vertical video (under 15 seconds) performs best in fintech.
Fintech vs. All-Industry Facebook Ads Performance
The gap between fintech and the average advertiser reveals where the real competitive advantages lie.
| Metric | Fintech | All-Industry Avg | Advantage / Gap |
|---|---|---|---|
| CPM | $19.35 | $14.34 | 35% higher cost |
| CPC | $1.84 | $0.77 | 139% higher cost |
| CPA | $35.60 | $22.50 | 58% higher cost |
| ROAS | 3.0x–3.5x | 2.0x–2.5x | 50% higher returns |
| Creative Lifespan | 28 days | 35–45 days | 20–38% shorter |
| LTV:CAC Ratio | 3.5:1 | 3.0:1 | 17% more efficient |
Despite paying a significant premium on CPM and CPC, fintech advertisers generate 50% higher ROAS thanks to elevated customer lifetime values. A single banking customer, insurance policyholder, or lending borrower generates far more revenue over their lifetime than a typical e-commerce purchaser, which justifies the higher acquisition costs.
Related reading
- Fitness Facebook Ads Statistics 2026: CPC, CPL & Conversion Benchmarks
- Franchise Facebook Ads Statistics: Adoption, CPL & Performance Benchmarks
- HVAC Facebook Ads Statistics: CPL, CTR & ROI Benchmarks (2026)
- Meta Ads Agency services at Web Tonic
FAQ
What is the average CPC for fintech Facebook ads in 2026?
The average CPC for fintech on Facebook ranges from $1.84 to $3.77 depending on the sub-vertical and targeting approach. Neobank and payment app campaigns sit at the lower end, while B2B fintech and lending products command higher CPCs due to Special Ad Category restrictions and competitive auctions. The all-industry average is $0.77–$1.07, putting fintech at roughly 2–3x the baseline.
How much does a fintech lead cost on Meta Ads?
Fintech CPA on Meta averages £52 (~$66) according to AdFuse AI, with significant variation by product type. Consumer app installs can cost as little as $5–$15 (CPI), neobank account signups run $8–$22, and lending applications range from $40–$120. B2B fintech demos typically cost $80–$200 per qualified lead.
How long do fintech Facebook ads last before fatigue?
The median creative lifespan for fintech ads is 28 days, with only 47.9% surviving past 30 days. This means fintech brands need to produce at least 12–15 new creatives monthly per active ad set. Video creatives tend to fatigue 15–20% slower than static images due to Meta's algorithmic preference for motion content.
Is Facebook advertising profitable for fintech companies?
Yes — fintech achieves a 3.0x median ROAS on Meta, and finance advertisers consistently report 3.50:1 ROAS when factoring in lifetime value. The high acquisition costs ($35–$66 CPA) are offset by customer LTV that typically runs 3.5x the initial CAC. Fintech companies spending $10,000+/month on Meta should expect positive unit economics within 3–6 months of optimization. See our full Facebook Ads ROI analysis for methodology details.
What creative formats work best for fintech on Facebook?
UGC-style testimonial videos deliver the strongest results, with a 1.6–2.4x CPA advantage over polished brand creative. Video accounts for 48.6% of fintech ad spend on Meta, and short-form vertical video (under 15 seconds) performs best on Reels and Stories. Problem-solution narratives that explain financial products in plain language consistently outperform corporate messaging.
Sources
https://adlibrary.com/posts/meta-ad-benchmarks-fintech-2026
https://adfuseai.com/cpa-benchmarks/fintech
https://benly.ai/benchmarks/finance-fintech
https://makometrics.com/blog/facebook-ads-cost-benchmarks
https://www.get-ryze.ai/blog/facebook-ads-cost-2026-pricing-breakdown
https://conversion.studio/blog/facebook-ads-benchmarks
https://foundrycro.com/blog/fintech-marketing-benchmarks-by-product-type/
https://www.aitarget.com/en/blog/article/fintech-on-meta-ads-106k-installs-without-bans-and-controlled-cpi
https://reach.cat/blog/clipping-for-fintech-brands-2026/
https://cufinder.io/blog/benchmarks/fintech/


