



Table of contents
Fintech Digital Marketing Statistics: 2026 Performance Report
U.S. fintech ad spend is projected to exceed $4.2 billion in 2026, a 22% increase from 2024 levels. From customer acquisition costs that span a 295x range by product type to organic search benchmarks that demand 18–24 months of investment, these are the numbers defining fintech marketing performance this year.
Key Takeaways
- $4.2 billion — projected U.S. fintech ad spend in 2026, up 22% from 2024 (CuFinder / Statista)
- $50 to $14,772 — customer acquisition cost range from consumer neobanks to enterprise fintech (FoundryCRO)
- $6.45 average CPC on Google Ads, 12% higher than 2024 levels (CuFinder)
- 28.5% of traffic from organic search — the primary new-customer acquisition channel (CuFinder)
- 18–24 months to rank consistently for mid-tier fintech keywords from a low-authority baseline (Authority Specialist)
- 1.6–2.4x CPA advantage for UGC ad formats over polished studio creative on Meta (BrighterClick)
Fintech Ad Spend & Market Overview
The fintech marketing landscape in 2026 is defined by rising costs, maturing channels, and a shift from acquisition-at-all-costs to sustainable unit economics. Global fintech revenues surpassed $500 billion in 2025, growing 22% year-over-year — more than four times the rate of incumbent financial services firms.
| Market Metric | Value | Source |
|---|---|---|
| U.S. Fintech Ad Spend (2026) | $4.2 billion (projected) | CuFinder / Statista |
| YoY Ad Spend Growth | +22% from 2024 | CuFinder / Statista |
| Global Fintech Revenue (2025) | $500B+ | Industry reports |
| Revenue Growth Rate | 22% YoY (4x incumbent rate) | Industry reports |
| Equity Funding (2025) | $58B, up 53% YoY | Industry reports |
| Public Fintech Profitability | 74% of top 85 are profitable | Industry benchmarks |
| Active Fintechs Globally | 26,000+ | FoundryCRO |
With 26,000+ active fintechs competing for attention, market saturation is a primary driver of rising acquisition costs. The sector has moved beyond the 2023 "fintech winter" into a more demanding era where investors are more selective and growth marketing efficiency matters more than topline user counts.
Customer Acquisition Cost by Product Type
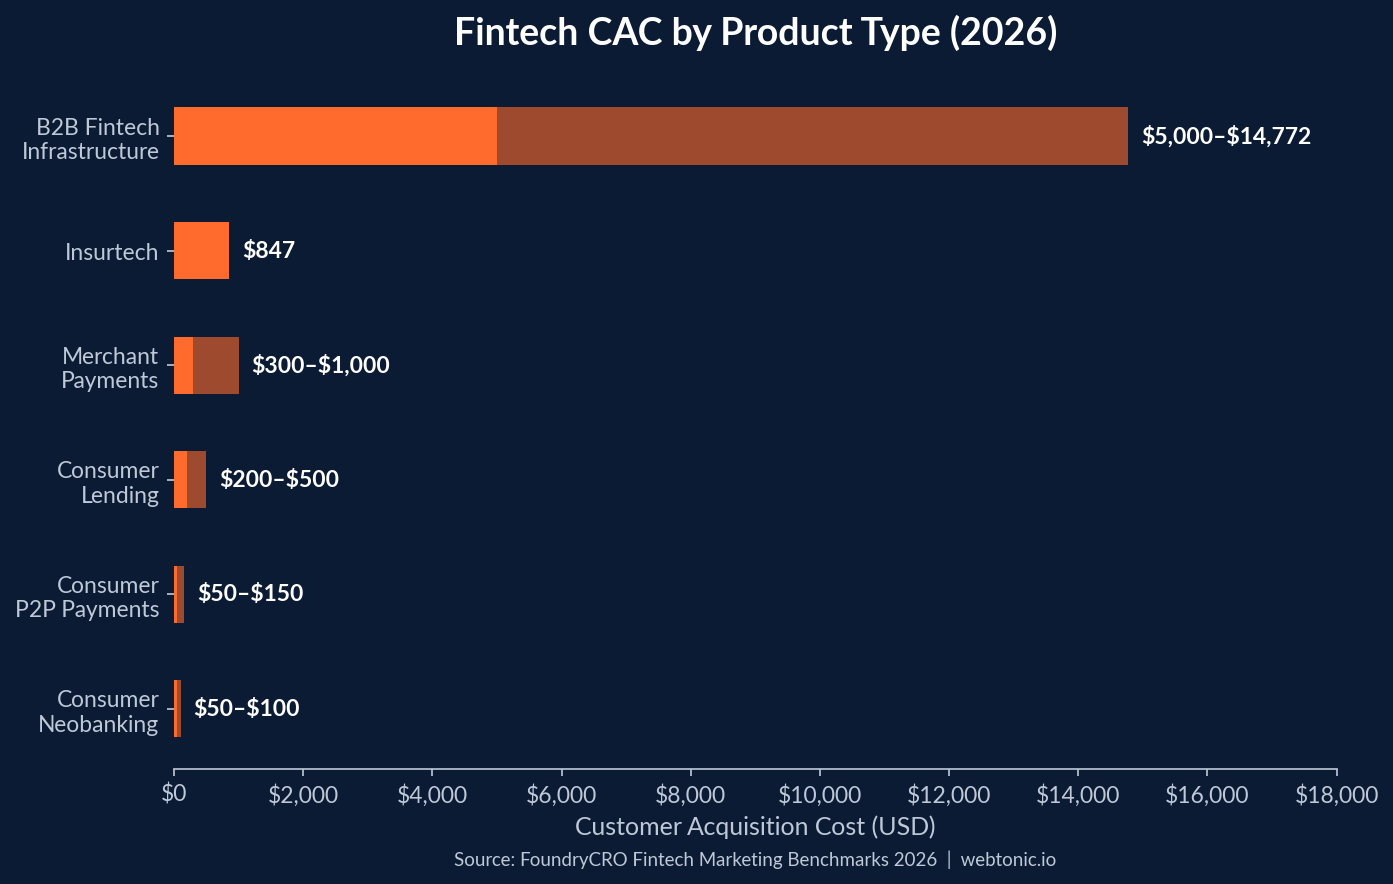
FoundryCRO's 2026 benchmarks reveal that "fintech average CAC" is a meaningless metric without product-type context. The spread ranges from $50 for consumer neobanks to $14,772 for enterprise fintech — a 295x gap within the same industry.
| Product Type | Reported CAC | True CAC (Fully Loaded) | Dominant Channel |
|---|---|---|---|
| Consumer Neobanking | $50–$100 | $85–$350 | Referrals, Meta, content |
| Consumer Lending | $200–$500 | $300–$700 | Google Search, SEO |
| Consumer P2P Payments | $50–$150 | $80–$200 | Referrals, viral, social |
| Merchant Payments | $300–$1,000 | $500–$1,500 | Outbound, partnerships |
| Insurtech (Consumer) | ~$847 | $1,000–$1,400 | Mixed paid + content |
| B2B Fintech Infrastructure | $5,000–$14,772 | $8,000–$20,000 | ABM, events |
Critically, reported CAC understates true acquisition cost by 2–5x. A neobank reporting $50 CAC actually pays $269+ per activated customer when including KYC costs ($5–$15), sign-up bonuses ($25–$250), card issuance ($5–$15), and activation rate adjustments. Fintech CAC has risen 40–60% since 2023, driven by Apple ATT targeting degradation, market saturation, and regulatory compliance costs.
Paid Search & Display Benchmarks
CuFinder's 2026 Fintech Marketing Benchmarks show that pay-per-click remains the most expensive channel for fintech, but also delivers the highest intent.
| Paid Channel Metric | Value |
|---|---|
| Google Ads Avg. CPC | $6.45 (12% above 2024) |
| Search CPA | $105.00 |
| Display CPA | $75.00 |
| Social CPA | $55.00 |
| Google Ads Search CTR | 3.9% |
| Landing Page CVR | 4.6% |
| Registration → Funded Account | 18% |
| LTV:CAC Ratio | 3.5:1 (benchmark) |
The $105 search CPA may appear steep, but for customers with $3,000+ lifetime values, it represents strong ROI. The real challenge is the gap between registration and activation — Google Ads campaigns optimizing for sign-ups rather than funded accounts can appear efficient while producing low-value leads.
Organic Search & SEO Performance
Authority Specialist's 2026 data from 36 fintech companies provides the most detailed view of fintech SEO performance available. Organic search accounts for 29–47% of high-intent product page traffic for established platforms.
| SEO Metric | Value |
|---|---|
| Organic Traffic Share (Established) | 29–47% of product page traffic |
| Keyword Difficulty (Core Terms) | 62–81 (high competition) |
| Time to Rank (Mid-Tier Terms) | 18–24 months from low authority |
| YMYL Content Advantage | 2.1–3.4x ranking stability vs. non-attributed |
| Author Schema Top-5 Advantage | 2.7x more likely to rank top 5 |
| Organic Share of Total Traffic | 28.5% |
YMYL-compliant content outperforms non-attributed content by 2.1–3.4x in sustained ranking stability. Fintechs with verified author schemas and regulatory disclosure pages rank in the top 5 for primary terms 2.7x more often than those without — a direct E-E-A-T signal that search engines reward in financial verticals. The practical implication is clear: most early-stage fintechs cannot realistically compete for head terms within the first 12–18 months of an SEO program. Companies that grow organic revenue fastest typically begin with regulatory-adjacent and educational content, build topical authority systematically, and then graduate to more competitive commercial terms as domain authority accumulates.
Traffic Source Distribution & Channel Mix
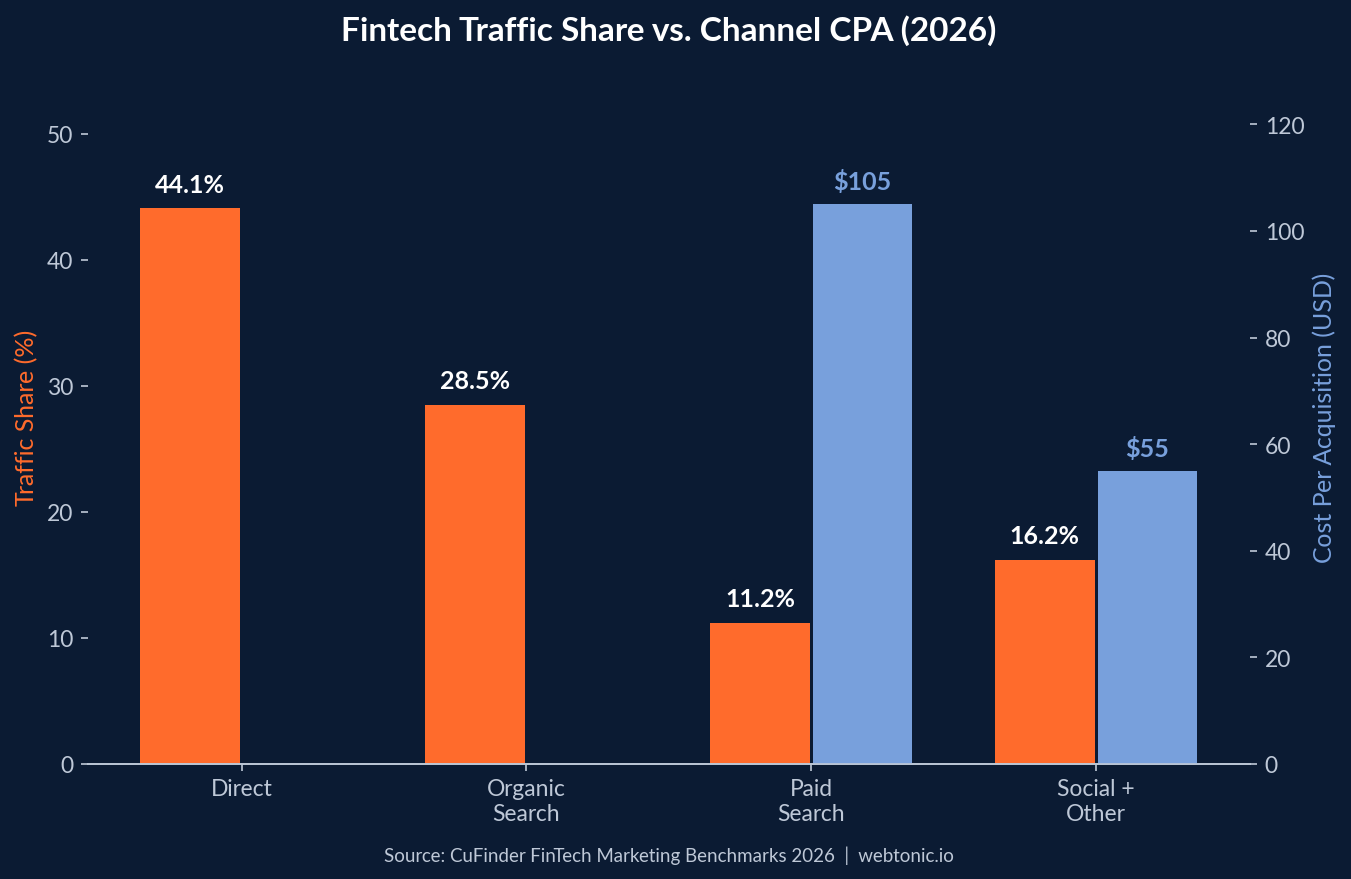
The channel mix for fintech companies in 2026 reflects a maturing sector where brand awareness increasingly drives direct visits, reducing dependence on paid acquisition.
| Channel | Traffic Share | Strategic Role |
|---|---|---|
| Direct | 44.1% | Brand strength + app re-engagement |
| Organic Search | 28.5% | Primary new customer acquisition |
| Paid Search | 11.2% | High-intent capture at $6.45 CPC |
| Social + Referral + Other | 16.2% | Brand awareness + B2B LinkedIn engagement |
Companies with 40%+ direct traffic spend 35% less on customer acquisition. This is driving a strategic shift: forward-thinking fintech marketers are reallocating budget from paid acquisition toward SEO and content — not because paid ads do not work, but because the long-term CAC advantage of organic and brand channels is becoming too significant to ignore.
Social Media & Creative Performance
Social media performance in fintech varies dramatically between B2B and B2C segments. LinkedIn leads B2B engagement at 1.45%, while consumer fintech brands compete on Meta and TikTok with increasingly authentic creative formats.
- UGC ad formats outperform studio creative by 1.6–2.4x on CPA across consumer fintech Meta accounts (BrighterClick)
- Video represents 48.6% of all fintech ad creatives on Meta, with the "Bold Statement" hook dominating openings (Benly)
- 28-day median creative lifespan — half of fintech ads lose effectiveness within 30 days (Benly)
- N26 achieved a 65% CAC drop by shifting from polished to UGC-style creative diversification (Creative Milkshake)
- Mobile traffic at 68% makes format-native vertical video essential for consumer-facing campaigns
The trust gap is the key differentiator. Consumer fintech products — where users hand over financial data — see the widest performance spread between authentic creative and polished studio ads. Users trust content that feels peer-generated more than content that looks corporate.
Retention & Lifetime Value Benchmarks
With rising acquisition costs, 2026 fintech marketing increasingly focuses on lifetime value rather than volume. Day 1 app retention sits at 28%, dropping to just 14% by Day 30 — the single biggest challenge for digital marketing ROI in financial technology.
| Retention / LTV Metric | Value |
|---|---|
| Day 1 App Retention | 28% |
| Day 30 App Retention | 14% |
| LTV:CAC Ratio (Benchmark) | 3.5:1 |
| CAC Payback (Neobanks) | 6–12 months |
| CAC Payback (Lending / InsurTech) | 12–18 months |
| CAC Payback (Enterprise B2B) | 18–24 months |
| Monthly Unique Visits (Small-Mid Cap) | 45,000–80,000 |
| YoY Traffic Growth | +14.5% |
Apps with sub-2-second load times see 40% higher engagement than slower competitors, making page speed optimization a direct lever on retention metrics. The drop from 28% Day 1 to 14% Day 30 retention means fintech marketers lose half their acquired users within a month — a dynamic that makes post-acquisition nurture campaigns and in-app engagement strategies critical for achieving positive unit economics.
Fintech vs. Traditional Financial Services Marketing
Understanding how fintech marketing benchmarks compare to traditional financial services helps contextualize performance targets and budget allocation decisions across the industry.
| Marketing Dimension | Fintech | Traditional Financial Services |
|---|---|---|
| Customer Acquisition Cost | $50–$14,772 (by product type) | $650–$700 (retail banking) |
| Primary Acquisition Channel | Digital (organic + paid search) | Branch network + referrals |
| Mobile Traffic Share | 68% | 45–55% |
| Direct Traffic Share | 44.1% | 50–60% |
| SEO Time to Rank | 18–24 months (mid-tier) | 12–18 months (established domains) |
| Content Strategy | YMYL-compliant, E-E-A-T critical | Regulatory-driven, brand-focused |
| Creative Approach | UGC outperforms by 1.6–2.4x | Corporate brand consistency |
Neobanks acquire customers 6–7x cheaper than traditional banks ($50–$100 vs. $650–$700), though the fully loaded CAC — including KYC costs, sign-up bonuses, and card issuance — narrows this gap to 2–7x depending on bonus structure. Traditional financial institutions benefit from established domain authority (reducing SEO timelines) and extensive branch networks, while fintechs compete through digital-native experiences and lower per-unit costs at the expense of longer LTV payback periods. This structural difference explains why fintech marketing teams tend to index more heavily on performance metrics and rapid iteration cycles, while traditional banking marketers operate within longer planning horizons with more conservative creative approaches.
Best Practices for Fintech Digital Marketing
- Calculate true CAC, not reported CAC — include KYC costs ($5–$15), sign-up bonuses ($25–$250), card issuance, and activation rate adjustments. Reported CAC understates actual acquisition cost by 2–5x across most product types
- Optimize for funded accounts, not sign-ups — with only 18% of registrations reaching funded status, campaigns optimizing for top-of-funnel conversions may appear efficient while producing low-value leads
- Invest in SEO with an 18-month horizon — organic drives 28.5% of traffic and companies with 40%+ direct traffic spend 35% less on acquisition, but fintech keyword difficulty (62–81) demands sustained content investment
- Prioritize YMYL compliance and E-E-A-T signals — verified author schemas deliver a 2.7x top-5 ranking advantage; regulatory disclosure pages boost ranking stability by 2.1–3.4x
- Test UGC creative formats — authentic user-generated content outperforms polished studio ads by 1.6–2.4x on CPA in consumer fintech, especially for trust-sensitive products
- Build brand to reduce CAC long-term — with 44.1% of traffic arriving direct, brand investment today lowers acquisition costs tomorrow through higher organic and unattributed conversion volume
- Separate B2B and B2C strategies — B2B fintech infrastructure companies ($5,000–$14,772 CAC) need ABM and events; consumer products ($50–$150 CAC) need viral loops, referral programs, and social media
Related reading
- 2026 Solar Energy Digital Marketing Strategy Report: Trends, Stats & Performance Data
- Wealth Management Digital Marketing Statistics: CAC, ROI & Channel Benchmarks
- Digital Marketing Strategy in the Allergy & Immunology Industry: 2026 Statistics Roundup
- Marketing Strategy Consulting services at Web Tonic
FAQ
How much do fintech companies spend on digital marketing?
U.S. fintech ad spend is projected at $4.2 billion in 2026, a 22% increase from 2024. Individual company budgets vary widely, with the Google Ads CPC averaging $6.45 and total customer acquisition costs ranging from $50 (consumer neobanks) to $14,772 (enterprise fintech).
What is a good CAC for fintech in 2026?
It depends entirely on product type. Consumer neobanks report $50–$100 CAC (true cost $85–$350), consumer lending averages $200–$500, and B2B fintech infrastructure reaches $5,000–$14,772. The benchmark LTV:CAC ratio across the industry is 3.5:1.
How long does fintech SEO take to show results?
From a low-authority baseline, fintech companies typically need 18–24 months to rank consistently in the top 10 for mid-tier category terms. Keyword difficulty averages 62–81, and YMYL compliance with verified author schemas provides a 2.7x advantage for top-5 rankings.
What traffic channels work best for fintech?
Direct traffic leads at 44.1%, followed by organic search at 28.5% and paid search at 11.2%. Organic search is the primary new-customer acquisition channel, while companies with strong direct traffic (40%+) spend 35% less on acquisition.
Does UGC creative outperform studio ads in fintech?
Yes — UGC ad formats outperform polished studio creative by 1.6–2.4x on CPA in consumer fintech Meta campaigns. N26 demonstrated a 65% CAC reduction through creative diversification toward authentic, user-generated content styles.
Sources
CuFinder — FinTech Industry Marketing Benchmarks 2026
FoundryCRO — Fintech CAC 2026: $50 Neobank to $14,772 Enterprise
Authority Specialist — Fintech SEO Benchmarks from 36 Companies
BrighterClick — Fintech Customer Acquisition Efficiency 2026
Benly — Finance & Fintech Ad Creative Benchmarks Q1 2026
Creative Milkshake — N26 UGC Creative Diversification Case Study


