



Table of contents
FinTech firms spend three times more on sales and marketing than traditional financial companies, yet 69% of consumers already recognize fintech brands over newer offerings from legacy banks. These branding statistics reveal where that investment pays off — and where trust still needs building.
Key Takeaways
- 3.2× increase in qualified traffic is the documented outcome of strategic fintech rebranding campaigns.
- 69% of consumers recognize fintech brands, compared to just 59% awareness of traditional financial institution digital offerings.
- 68% of users stay loyal to fintech brands they perceive as transparent and socially responsible.
- Fintech firms allocate 15–30% of revenue to marketing, dramatically outspending community banks at 0.06% of assets.
- 20% revenue growth within 12 months is achievable post-rebrand, even in sectors with median growth of ~15%.
- 50 milliseconds is all a logo gets to make its first impression on potential users.
FinTech Branding Benchmarks at a Glance
| Metric | Value | Source |
|---|---|---|
| Marketing Spend (% of Revenue) | 15–30% | Scale Growth Digital |
| Sales & Marketing vs. Traditional FIs | 3× higher | U. of Chicago BFI |
| Ad Spending Growth (YoY Since 2021) | +45% | eMarketer |
| Consumer Brand Recognition | 69% (vs. 59% traditional) | eMarketer |
| User Loyalty (Transparent Brands) | 68% retention | Billcut |
| Post-Rebrand Traffic Increase | 3.2× qualified traffic | AlgRowVert |
| Post-Rebrand User Signup Growth | 2.5× monthly signups | AlgRowVert |
| Logo First Impression Window | 50 milliseconds | Unfold Mart |
| Revenue Growth Post-Rebrand | +20% within 12 months | Designhouse |
FinTech Marketing Investment and Budget Allocation
The financial technology sector invests aggressively in brand building. According to research from the University of Chicago Becker Friedman Institute, fintech firms spend three times more on sales and marketing than non-fintech financial firms, and this investment builds valuable customer capital that compounds over time.
At the industry level, fintech companies allocate 15–30% of revenue to marketing, compared to community banks spending just 0.06% of assets on digital acquisition — a factor gap that explains much of the digital market-share shift (Scale Growth Digital). Fintech ad spending has also surged 45% year-over-year since 2021, as platforms like Mercury, Brex, and Klarna shifted from startup-focused messaging to mainstream campaigns (eMarketer).
Looking ahead, more than 69% of fintech marketing leaders anticipate a budget increase in the next two years, while only 8% expect a reduction (CCGroup). This signals a structural shift from pure growth marketing tactics toward sustained brand-building investment.
Consumer Trust and Brand Loyalty in FinTech
Trust is the currency of financial technology. According to the Plaid Fintech Effect 2025 report (Harris Poll, n=2,001 U.S. adults), 70% of consumers feel comfortable sharing data with the digital tools they use, and 62% welcome apps remembering their identity if it accelerates sign-in.
| Trust Factor | Statistic | Source |
|---|---|---|
| Data Sharing Comfort | 70% of consumers | Plaid / Harris Poll 2025 |
| Identity Memory Acceptance | 62% welcome it | Plaid / Harris Poll 2025 |
| MFA Increases Trust | 69% of consumers | Data Ally |
| Clear Pricing Drives Trust | 67% of consumers | FTA State of Fintech |
| Transparent Brand Loyalty | 68% user retention | Billcut |
| Repeat Engagement (Clear Policies) | +30% higher | Billcut |
| SE Asia Platform Trust | 80%+ respondents | Asian Banking & Finance |
| Trust in India | 83% | Studio LDN |
| Trust in Thailand | 81% | Studio LDN |
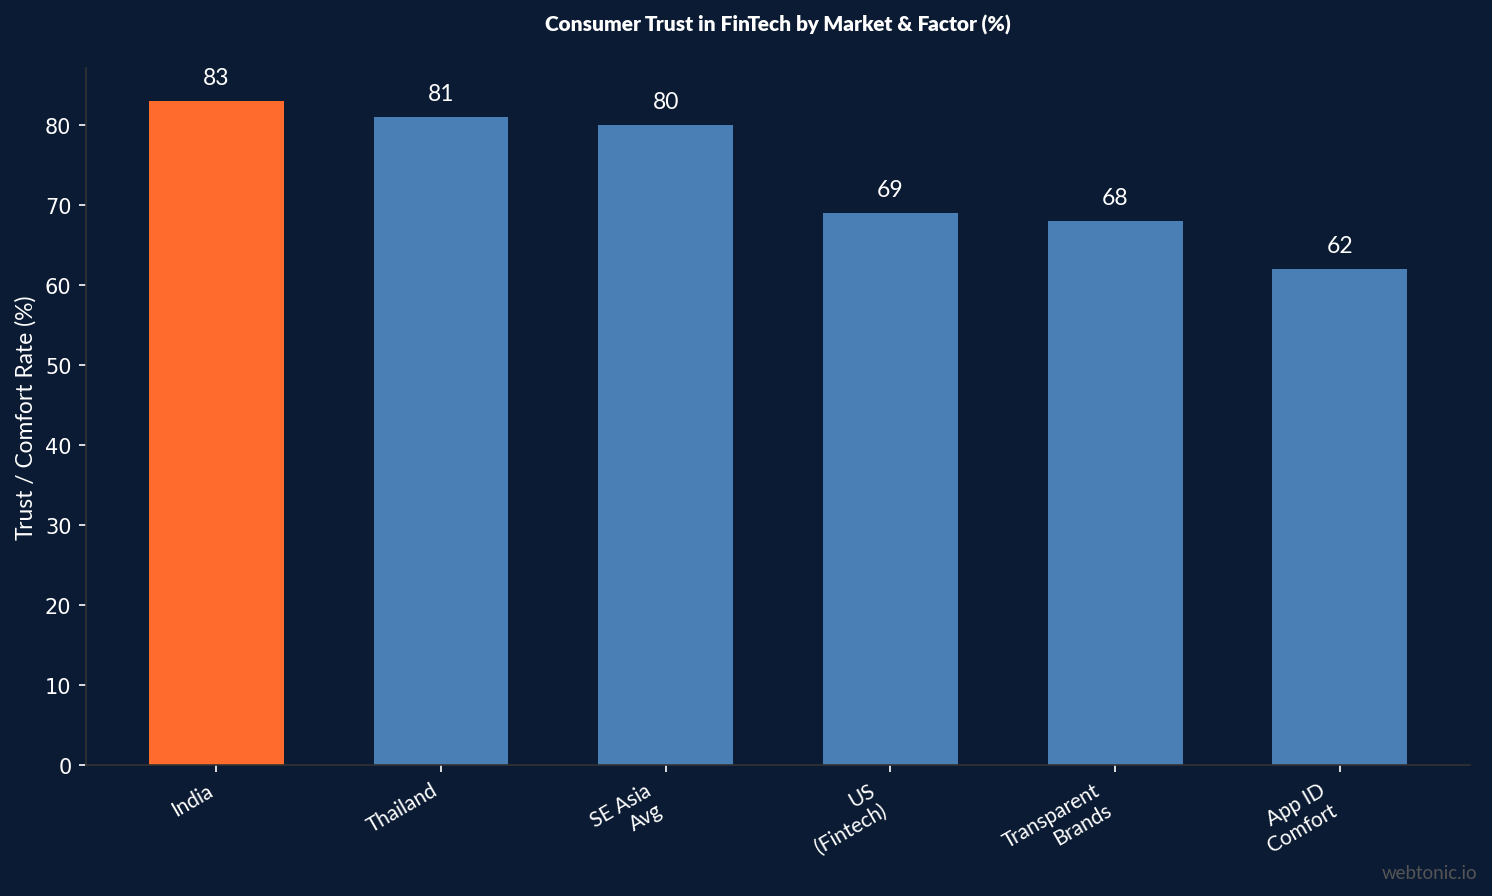
The FTA State of Fintech Survey found that 67% of consumers cite clear pricing as a key driver of trust, alongside user-friendly design (55%) and real-time visibility (52%). For SMBs, service quality ranked even higher at 64%. Meanwhile, fintechs that publish transparent data policies report 30% higher repeat engagement rates (Billcut).
FinTech Brand Awareness vs. Traditional Finance
FinTech brands are winning the recognition race. According to eMarketer research, 69% of consumers recognize fintech brands, while only 59% are aware of newer digital offerings from traditional financial institutions. This 10-percentage-point gap reflects a decade of aggressive digital-first performance creative and content investment.
Customer acquisition costs tell a parallel story. Fintech CAC ranges from $50 for consumer neobanks to $14,772 for enterprise fintech — a 295× spread within the same industry (Foundry CRO). Across digital businesses broadly, acquisition costs have surged 222% over the past decade, with digital ad costs climbing another 5.13% in 2025 alone (Prospeo). Strong brands reduce these costs by driving organic recognition and word-of-mouth referrals.
Rebranding ROI: What the Data Shows
Strategic rebranding delivers measurable returns across the fintech funnel. A documented fintech rebranding case study by AlgRowVert tracked outcomes that most CMOs only dream about:
- 3.2× increase in qualified traffic
- 2.5× growth in monthly user signups
- 75% rise in brand mentions
- Enhanced investor interest and new partnerships
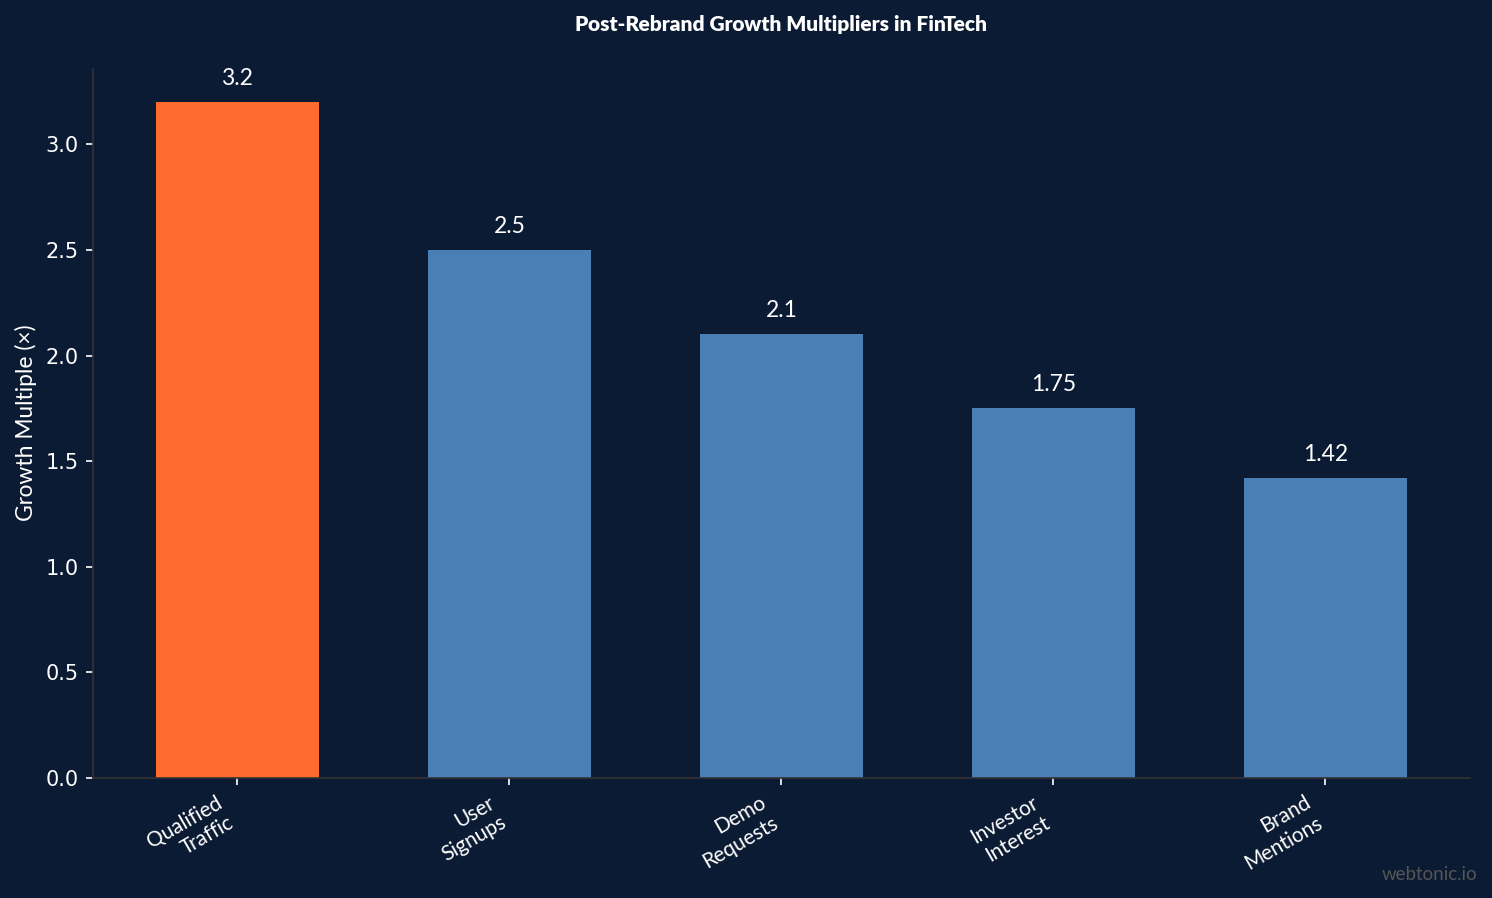
In the B2B fintech space, a SaaS fintech startup case study (GraphicDigits) reported a 2.1× increase in qualified demo requests within 60 days, a 31% reduction in bounce rate, and a 42% improvement in user engagement — ultimately securing Series A funding at target valuation plus enterprise pilots with three Fortune 500 companies.
Even in mature fintech infrastructure, rebranding pays. Xceptor, a data automation platform, saw revenue grow 20% in the 12 months post-rebrand — outperforming the sector median growth rate of approximately 15% (Designhouse). These results reinforce the case for allocating budget to brand awareness campaigns alongside performance channels.
FinTech Logo Design Trends and Visual Identity
Visual identity moves fast in fintech. A logo gets just 50 milliseconds to make its first impression (Unfold Mart), and with Europe hosting close to 10,000 fintech companies by end of 2025 (Statista), visual differentiation has become existential for new entrants.
| Trend | Detail | Impact |
|---|---|---|
| Minimalism & Simplification | 90% of top fintechs moving toward cleaner marks | Faster recognition across app icons and devices |
| Dark Mode Optimization | Sleek dark-mode-ready logos replacing light-only designs | Better UX in mobile banking interfaces |
| Dynamic Color Systems | Vibrant greens and gradients replacing safe blue | Stronger differentiation from traditional banks |
| Scalable Design Systems | Logos that adapt across apps, websites, and devices | Consistent brand experience at every touchpoint |
| Trust Signal Integration | Shield, lock, and verification motifs in wordmarks | Visual shorthand for security and compliance |
The mid-2026 rebranding wave, tracked by FinTech Marketing Hub, shows that most redesigns are not cosmetic — they signal that the business underneath has changed. Companies that outgrew their original names and positioning use rebranding as a strategic announcement of expanded capabilities.
FinTech Branding Best Practices for 2026
- Lead with transparency. Fintechs that publish clear pricing and data policies report 30% higher repeat engagement. Make your privacy policy a brand asset, not a legal afterthought.
- Invest in security signals. With 69% of consumers saying multi-factor authentication increases brand trust (Data Ally), visible security features are a branding tool.
- Design for 50 milliseconds. Your logo must communicate trust and modernity in the time it takes a user to blink. Test across mobile, web, and dark-mode contexts.
- Track rebrand ROI holistically. Measure qualified traffic, signups, brand mentions, and investor interest — not just awareness surveys. The 3.2× traffic multiplier benchmark gives you a target.
- Budget for brand-led growth. With 69% of marketing leaders increasing budgets, underspending on brand puts you at a structural disadvantage against competitors investing 15–30% of revenue.
- Localize trust signals. Trust varies dramatically by market — 83% in India vs. lower rates in developed economies. Adapt your brand messaging to local expectations through data intelligence.
FinTech Branding vs. Other Financial Sectors
| Metric | FinTech | Traditional Banks | InsurTech |
|---|---|---|---|
| Marketing as % of Revenue | 15–30% | 0.06% of assets | 8–15% |
| Consumer Brand Recognition | 69% | 59% (digital offerings) | 45–55% |
| Ad Spend Growth (YoY) | +45% | +5–10% | +20–25% |
| Budget Increase Expectation | 69% of leaders | 45% of leaders | 55% of leaders |
| CAC Range | $50–$14,772 | $200–$500 | $150–$800 |
| Post-Rebrand Revenue Lift | +20% (12 months) | +5–8% | +10–15% |
FinTech consistently outspends and outperforms traditional financial services in branding investment and outcomes. The 10-percentage-point brand recognition gap (69% vs. 59%) reflects a decade of digital-first positioning that legacy institutions struggle to replicate, even with larger absolute budgets. For agencies managing fintech accounts, understanding these benchmarks is critical to setting realistic cost expectations and ROI targets.
The Shift From Performance Marketing to Brand-Led Growth
The fintech industry is experiencing a fundamental strategic pivot. Where performance marketing once dominated budgets, brand-led growth is emerging as the sustainable competitive advantage. According to CCGroup's research, this shift is not theoretical — it is reflected in concrete budget reallocation across the sector.
The logic is straightforward: performance marketing drives immediate conversions but faces diminishing returns as digital ad costs climb 5.13% annually. Brand investment, by contrast, compounds over time. Strong brands convert at higher rates across every channel, reduce cost per acquisition organically, and create pricing power that performance-only competitors lack. The fintech companies that have invested in brand equity over the past five years are now reaping the benefits: lower CPCs in paid search, higher organic click-through rates, and stronger word-of-mouth referral loops.
This is particularly relevant for B2B fintech platforms where sales cycles span 60 to 120 days and the buyer journey involves multiple stakeholders evaluating three to five competing solutions. In these environments, brand recognition at the top of the funnel directly impacts pipeline velocity and deal close rates at the bottom. Companies like Stripe and Revolut did not achieve billion-dollar valuations through performance ads alone — they built brands that became synonymous with their categories, creating a compounding advantage that new entrants struggle to match.
For marketers managing fintech accounts, the implication is clear: brand spending should be measured on a 12-to-24-month horizon, not the same 30-day window used for performance campaigns. The rebranding ROI data — 3.2 times traffic growth, 2.5 times signup growth, 20 percent revenue lifts — only becomes visible with patient measurement frameworks aligned to the actual timeline of brand impact.
Frequently Asked Questions
How much do fintech companies spend on branding?
Fintech companies typically allocate 15–30% of revenue to marketing, spending approximately three times more on sales and marketing than traditional financial firms. Fintech ad spending has surged 45% year-over-year since 2021, and 69% of marketing leaders expect further budget increases in the next two years.
What ROI can fintech companies expect from rebranding?
Documented fintech rebranding case studies show 3.2× increases in qualified traffic, 2.5× growth in monthly user signups, and 75% rises in brand mentions. Revenue growth of 20% within 12 months post-rebrand has been achieved even in mature fintech infrastructure segments.
Do consumers trust fintech brands more than traditional banks?
Yes, in terms of recognition: 69% of consumers recognize fintech brands versus 59% awareness of traditional financial institution digital offerings. Trust varies by market — 83% in India and 81% in Thailand — and is driven by transparent pricing (67% of consumers) and clear data policies (68% retention rate).
How important is logo design for fintech brand trust?
A fintech logo gets approximately 50 milliseconds to make its first impression. With close to 10,000 fintech companies in Europe alone, visual differentiation is critical. The trend toward minimalist, scalable, dark-mode-ready logos reflects the need for instant recognition across mobile apps and digital banking interfaces.
What is the average customer acquisition cost in fintech?
Fintech CAC ranges dramatically from $50 for consumer neobanks to $14,772 for enterprise fintech — a 295× spread. Across digital businesses broadly, acquisition costs have surged 222% over the past decade, making strong brand equity a critical lever for reducing paid acquisition dependence.
Sources
University of Chicago BFI — FinTech Marketing Spend
Scale Growth Digital — Financial Services Marketing Budget Guide
eMarketer — Fintech Ad Spending Surges 45%
eMarketer — Fintechs vs. Traditional FI Brand Awareness
Plaid / Harris Poll — The Fintech Effect 2025
FTA — State of Fintech Survey
Billcut — Fintech Branding: Winning User Trust in 2026
AlgRowVert — FinTech Rebranding Case Study: 320% Growth
Designhouse — Xceptor 20% ROI Rebrand
Data Ally — Fintech Marketing Trends 2026


