



Table of contents

Financial Advisory WordPress Statistics for 2026
The average advisor website takes 10.7 seconds to render. Here are 45+ statistics on WordPress adoption, site speed, and conversion rates for advisory firms.
Key Takeaways
- WordPress powers 41.2% of all websites globally, but only ~8% of financial advisor sites run WordPress specifically (W3Techs, Borah Labs)
- Average advisor site LCP is 10.7 seconds — 8.2s over Google's 2.5s passing threshold (Borah Labs)
- Optimized advisor websites convert at 3-8% vs. the 0.5-1.5% industry average (OJay Media)
- 88% of RIAs use website builders like WordPress for their digital presence (Gitnux)
- 17.6% of advisor sites lack SSL certificates, creating immediate trust and ranking penalties (Borah Labs)
- Replacing contact forms with booking calendars lifts calls 40-80% (OJay Media)
- 529 UK financial advice firms actively use WordPress as of June 2026 (Firmbase)
WordPress Market Share and CMS Adoption
WordPress dominates the global CMS landscape but has a more nuanced role in the financial advisory sector, where compliance requirements and proprietary broker-dealer platforms influence platform choice heavily.
| CMS Metric | Statistic | Source |
|---|---|---|
| WordPress global market share | 41.2% of all websites | W3Techs |
| WordPress among financial advisor sites | ~8.0% | Borah Labs (254 sites) |
| RIAs using website builders (incl. WordPress) | 88% | Gitnux |
| UK financial advice firms on WordPress | 529 active firms | Firmbase |
| RIA marketing tech stack growth since 2020 | +40% | Gitnux |
| WordPress latest version (v7) adoption | 50.9% of WordPress sites | W3Techs |
The gap between WordPress's 41.2% global market share and its ~8% footprint among financial advisors reflects the sector's reliance on specialized platforms and custom-built solutions. Many RIAs use proprietary website tools provided by their broker-dealer or custodian, while independent firms increasingly choose conversion-optimized custom builds over template-based approaches. The Firmbase data shows 529 UK financial advice firms actively running WordPress as of June 2026, indicating stronger adoption in markets with fewer proprietary platform lock-ins. The overall RIA marketing tech stack has grown by 40% since 2020, reflecting a broader industry shift toward digital-first client acquisition and the growing importance of website technology decisions in competitive positioning.
Site Speed and Core Web Vitals Benchmarks
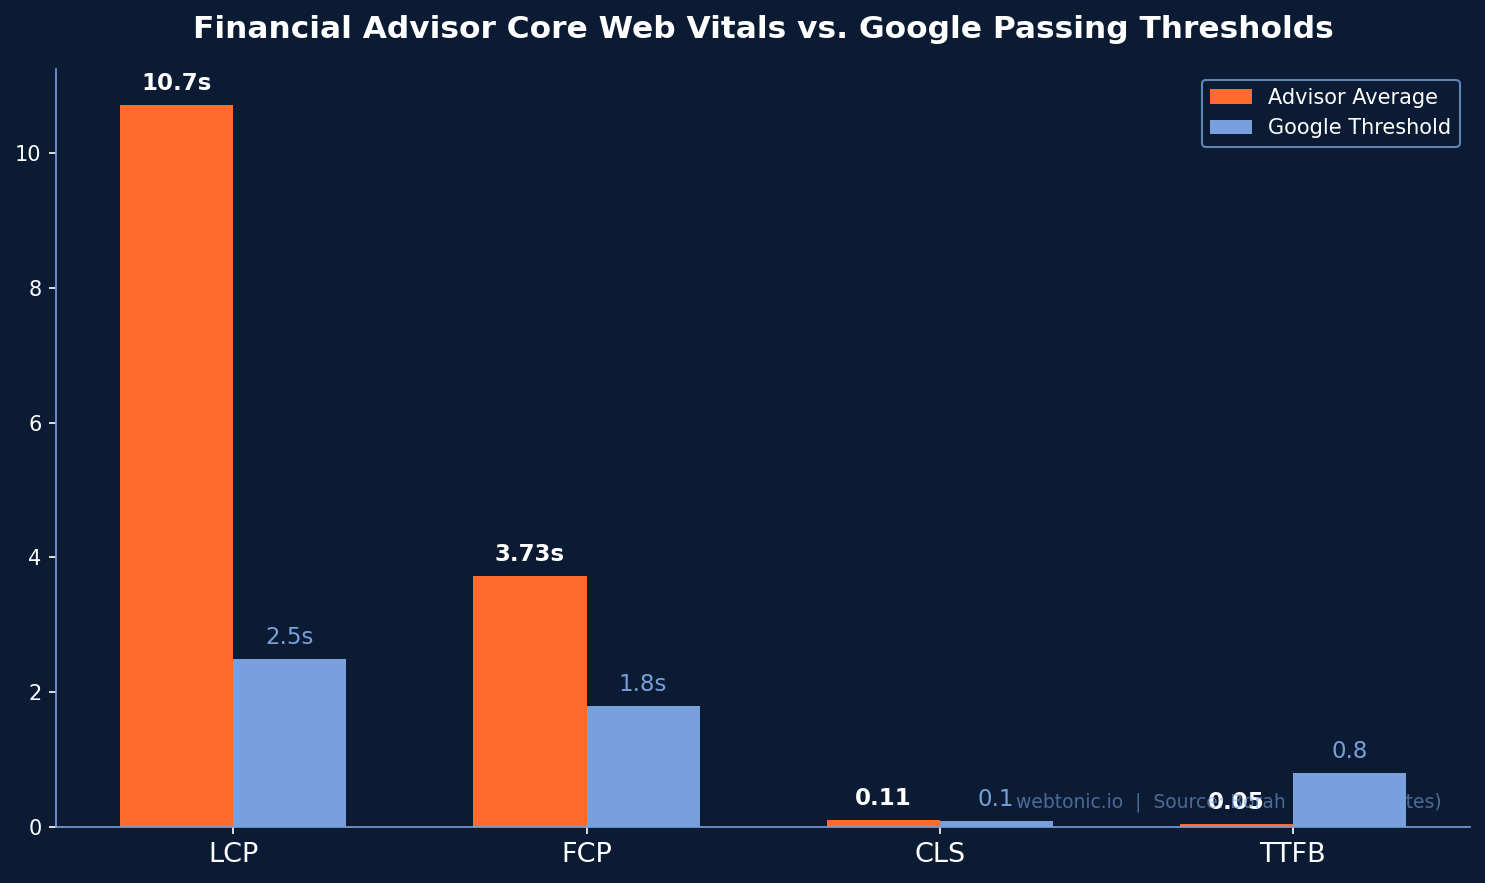
Site speed directly impacts both search rankings and user experience. The Borah Labs benchmark study of 254 financial advisor websites reveals alarming performance gaps across nearly all Core Web Vitals metrics, with only TTFB meeting Google's threshold.
| Core Web Vital | Advisor Average | Google Threshold | Gap |
|---|---|---|---|
| Largest Contentful Paint (LCP) | 10.7s | 2.5s | +8.2s (4.3x over) |
| First Contentful Paint (FCP) | 3.73s | 1.8s | +1.93s (2.1x over) |
| Cumulative Layout Shift (CLS) | 0.11 | 0.10 | +0.01 (marginal fail) |
| Time to First Byte (TTFB) | 0.05s | 0.8s | Passing |
| PageSpeed Performance score | 59/100 | 90+ | -31 points |
| SEO score | 84/100 | 90+ | -6 points |
| Accessibility score | 88/100 | 90+ | -2 points |
The most critical finding is the 10.7-second average LCP — this means the typical advisor website's main content takes more than four times longer to render than Google considers acceptable. Quality Score and landing page experience are directly impacted by these metrics, making site speed optimization one of the highest-ROI investments an advisor can make. The fact that only TTFB passes (at 0.05s) suggests the server responds quickly but the front-end rendering pipeline is severely bloated with unoptimized images, excessive JavaScript, and render-blocking CSS.
Conversion Rate Benchmarks for Advisor Websites
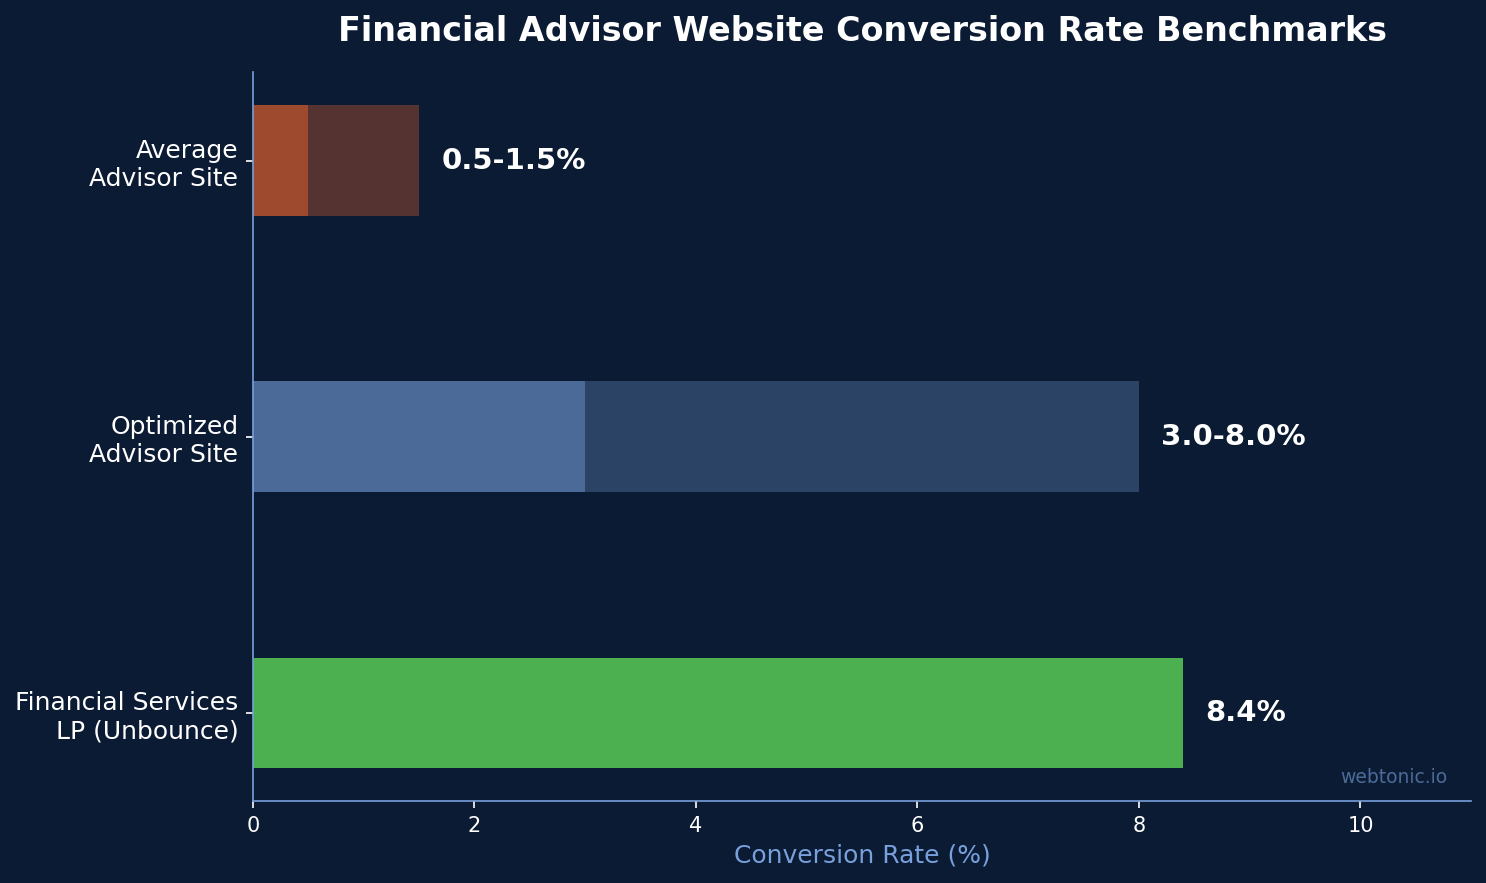
Website traffic is meaningless if visitors do not convert. The data reveals a stark divide between average and optimized financial advisor websites, with a clear path to improvement through proven design patterns.
- Average advisor site conversion rate: 0.5-1.5% (OJay Media)
- Optimized conversion-focused advisor sites: 3-8% (OJay Media)
- Financial services landing page CVR: 8.4% (Unbounce benchmark, via Apexure)
- Financial services MQL CVR: 1.7-2.3% for contact form fills and appointment bookings (ConversionXperts)
- Booking calendar replacement lifts calls 40-80% from the same traffic volume (OJay Media)
- Website redesign case study: 2.4x conversions after implementing conversion design principles (OJay Media)
- Website redesign case study: 3x monthly consultation requests with doubled organic traffic (Capital Advantage case study)
The single highest-leverage change for most advisors is replacing the generic contact form with a direct-booking calendar. This eliminates the back-and-forth scheduling friction and typically lifts discovery calls by 40-80% without increasing traffic spend. Combined with a niche-specific headline and above-fold trust signals (credentials, AUM, media logos), this pattern consistently produces 3-8% conversion rates from the same visitor volume that was converting below 1.5% before.
Technology Stack and Infrastructure Data
The technology landscape for financial advisor websites reveals both opportunities for modernization and concerning security gaps across the sample of 254 advisory firm websites analyzed by Borah Labs in July 2026.
| Technology | Adoption Rate | Category |
|---|---|---|
| Cloudflare | 13.2% | CDN / Security |
| Google Analytics | 13.1% | Analytics |
| jQuery | 12.4% | JavaScript Framework |
| HSTS | 11.8% | Security Headers |
| PHP | 9.2% | Server Language |
| Google Tag Manager | 8.9% | Tag Management |
| WordPress | 8.0% | CMS |
| HTTP/3 | 8.2% | Protocol |
The relatively low Google Analytics adoption at 13.1% is striking — it suggests that nearly 87% of advisor sites either use alternative analytics tools or, more concerning, have no analytics tracking at all. Similarly, only 8.9% use Google Tag Manager, indicating most advisors lack the tracking infrastructure needed to measure conversion attribution and campaign ROI effectively.
Security and SSL Compliance
For financial advisory firms handling sensitive client information, website security is both a regulatory compliance requirement and a critical trust signal for prospective clients evaluating the firm online. The Borah Labs data reveals significant gaps in basic security practices across the 254 advisory firm websites analyzed, creating unnecessary risk exposure, regulatory vulnerability, and search ranking penalties that compound over time.
- 82.4% of advisor sites have SSL certificates — meaning 17.6% (45 of 254 sites) are still unencrypted (Borah Labs)
- Sites without SSL trigger Chrome browser warnings that immediately erode prospect trust and increase bounce rates
- Only 11.8% implement HSTS (HTTP Strict Transport Security) headers for enhanced security protection (Borah Labs)
- Compliance-first WordPress configurations like Comply.Press are emerging for regulated firms requiring FINRA and SEC audit trails (LiftDEMAND)
- WordPress security requires systematic vulnerability management beyond basic plugin installations for financial compliance (OneWebCare)
Social Media Integration from Advisor Websites
Social media links provide trust signals and additional touchpoints for prospects evaluating an advisor. However, fewer than half of advisor sites link to any social platform from their homepage.
| Platform | Sites Linking Out | Count |
|---|---|---|
| Any social platform | 43.9% | ~112 of 254 |
| 41.2% | 105 sites | |
| 31.0% | 79 sites |
The social presence data reveals important patterns for advisors evaluating their digital footprint. Financial advisory is a relationship business, and prospects increasingly verify advisors through social channels before scheduling a consultation. A complete LinkedIn profile linked from the firm website serves as a secondary trust verification point that can influence conversion decisions.
LinkedIn leads at 41.2%, which aligns with the platform's relevance for professional services and B2B client acquisition. The 56.1% of advisor sites with zero social links are missing easy trust signals that prospects check during their evaluation process. For advisors running paid social campaigns, linking back to social profiles from the website creates a reinforcement loop that strengthens brand recall.
RIA Marketing Spend and Digital Budget Allocation
Understanding how the broader RIA industry allocates marketing spend provides context for website investment decisions. The shift toward digital channels has accelerated significantly, with advisory firms increasingly treating their website as a revenue-generating asset rather than a static online brochure.
- RIA marketing spend reached $2.1 billion in 2023 with digital channels driving 62% of that budget (Gitnux)
- Referral programs still power 55% of new RIA clients each year, but digital acquisition share is growing rapidly (Gitnux)
- "RIA near me" paid search averages $15.40 per click, making organic search and website conversion optimization critical for cost control (Gitnux)
- Average RIA marketing ROI benchmark: 4.2:1 — firms with optimized websites significantly outperform this average (Gitnux)
- Average RIA sales cycle: 92 days — highlighting the importance of a website that nurtures prospects over extended evaluation periods (Gitnux)
- 42% of RIAs acquired 10+ clients via Google Ads in 2023, reinforcing the need for high-converting landing pages (Gitnux)
With $15.40 per click for "RIA near me" searches and a 92-day average sales cycle, the cost of poor website performance is enormous. Every percentage point improvement in conversion rate translates directly to lower cost per client acquisition, making website optimization one of the highest-ROI marketing investments available to advisory firms. The 4.2:1 average marketing ROI benchmark provides a useful baseline for measuring whether website improvements are delivering measurable returns against total marketing spend.
Custom vs. WordPress Website Performance
The custom vs. template debate is particularly relevant for financial advisors weighing build quality against budget constraints and time-to-market requirements.
- Custom-built sites average 84.3 PSI mobile performance (median 89) vs. lower scores for template-based WordPress sites (WebDesigner London (49-site study))
- 49% of custom sites score 90+ on mobile PageSpeed Insights (WebDesigner London)
- Custom sites achieve 94.3 average desktop PSI (median 98) showing near-perfect desktop performance (WebDesigner London)
- WordPress wins on raw server response time but custom wins on render performance, especially on mobile and slow connections (D1TechCreative)
- 60%+ of advisor site traffic arrives on mobile — making mobile render performance the decisive factor for user experience and rankings (OJay Media)
Related reading
- 100+ Statistics Shaping Webflow in the Financial Advisory Industry (2026)
- Financial Advisory Landing Page Statistics: 2026 Conversion Rate Benchmarks
- Financial Advisory Shopify Statistics: E-Commerce, Digital Products & Subscription Data (2026)
- Custom Web Development services at Web Tonic
Frequently Asked Questions
What percentage of financial advisors use WordPress?
Approximately 8% of financial advisor websites run on WordPress based on a 254-site benchmark study, while 88% of RIAs use website builders including WordPress for their digital presence. The gap reflects many advisors using WordPress-based page builders rather than standalone installs.
What is the average conversion rate for financial advisor websites?
The average financial advisor website converts 0.5-1.5% of visitors. Optimized, conversion-focused advisor sites achieve 3-8% conversion rates. Replacing a generic contact form with a direct-booking calendar typically lifts discovery call bookings by 40-80%.
How fast should a financial advisor website load?
Google recommends a Largest Contentful Paint under 2.5 seconds, but the average financial advisor website takes 10.7 seconds. The average PageSpeed performance score is just 59 out of 100, indicating significant optimization opportunity.
Is WordPress secure enough for financial advisors?
WordPress can meet financial compliance requirements with proper hardening — SSL, regular updates, security plugins, and compliance-first configurations. However, 17.6% of advisor sites still lack SSL certificates, and many run outdated plugins creating unnecessary risk exposure.
Should financial advisors use WordPress or a custom website?
WordPress offers lower upfront costs and faster deployment. Custom sites score higher on mobile performance (84.3 average PSI mobile vs. lower for WordPress templates). Solo advisors and small RIAs benefit from WordPress with professional optimization and conversion-focused themes designed for financial services. Larger firms with compliance teams and complex integration requirements may justify the investment in custom builds for superior performance and analytics integration.
Sources
https://borahlabs.us/insights/financial_advisor
https://w3techs.com/technologies/details/cm-wordpress
https://www.ojaymediamarketing.com/blog/financial-advisor-website-design-that-converts/
https://gitnux.org/marketing-in-the-ria-industry-statistics/
https://firmbase.co/resources/technology-lists/financial-advice-using-wordpress-uk
https://www.apexure.com/blog/landing-page-conversion-rate-benchmarks-by-industry
https://liftdemand.com/systems/comply-press/
https://onewebcare.com/blog/wordpress-security-maintenance-financial-advisory-compliance/


