



Table of contents
Key Takeaways
- X (Twitter) has 611 million monthly active users in 2026, with financial services ranking third in industry engagement at a 0.025% median rate.
- X advertising revenue reached $1.8 billion in 2025, up 7% year-over-year after a 26% decline in 2024, signaling platform stabilization.
- Finance-sector CPC on X ranges from $1.00–$3.00, with CPM between $6.00–$8.00 for awareness campaigns.
- Financial services CTR on X averages 1.0–2.0%, outperforming the 0.61% median across all industries.
- X Premium has approximately 1.3 million paying subscribers — just 0.21% of the total user base — but these verified accounts drive disproportionate financial content engagement.
- Financial advisor tweets generate 1.4% average engagement rate among finance creators, outperforming the 0.015% cross-industry median.
- 53% of businesses surveyed spend $101–$500/month on X ads, making it one of the most accessible paid social entry points for advisory firms.
X (formerly Twitter) remains a distinct advertising channel for financial advisory firms in 2026 — not because of its scale, but because of its audience composition. The platform's real-time, text-first format attracts financially engaged professionals, institutional investors, and policy watchers who consume market commentary and advisor insights at rates that other social platforms struggle to match. With 611 million monthly active users and ad revenue stabilizing at $1.8 billion, X offers financial advisors a specialized — if evolving — advertising environment (SocialNexis, Business Insider). This article compiles the latest cost benchmarks, engagement data, and performance statistics shaping X advertising for financial advisory firms.
X (Twitter) Ad Cost Benchmarks for Financial Services
X advertising costs for financial services sit in a mid-range position — more affordable than LinkedIn, comparable to Meta, and higher than Reddit. Data from Improvado and WebFX provides the following benchmarks for growth marketing planning.
| Metric | Financial Services | Cross-Industry Average | Notes |
|---|---|---|---|
| CPC | $1.00–$3.00 | $0.26–$0.50 | Compliance + high-value audience premium |
| CPM (Awareness) | $6.00–$8.00 | $2.09–$6.00 | Lower than LinkedIn ($30+) |
| Cost per Engagement | $1.50–$2.50 | $0.26–$0.50 | Higher but more qualified interactions |
| Cost per Follow | $1.01–$2.00 | $1.01–$2.00 | Consistent across verticals |
| CTR | 1.0–2.0% | 0.61% | Finance audience is highly intent-driven |
| CVR | 1.0–3.0% | 0.5–1.5% | Strong for lead gen with compliant landing pages |
The $1.00–$3.00 CPC range for financial services on X is notably lower than LinkedIn's $5.00–$8.00 for the same audience type. This makes X a compelling alternative for financial advisors targeting digitally active professionals who are comfortable with text-based content and real-time market discussions. The 53% of businesses spending $101–$500/month confirms that X remains one of the most budget-accessible paid social channels for smaller advisory practices (WebFX).

X Platform Revenue and Advertiser Trends (2021–2025)
Understanding X's trajectory provides crucial context for ad investment decisions. The platform has undergone significant advertiser shifts since the 2022 acquisition, with recent filings via SpaceX's S-1 providing the first audited revenue figures (Business Insider).
| Year | Ad Revenue | YoY Change | Context |
|---|---|---|---|
| 2021 (Pre-acquisition) | $4.5 billion | +40% | Peak Twitter advertising year |
| 2023 | $2.3 billion | N/A | Post-acquisition advertiser exodus |
| 2024 | $1.7 billion | −26% | Continued brand advertiser pullback |
| 2025 | $1.8 billion | +7% | Stabilization and cautious return |
The +7% recovery in 2025 marks X's first positive revenue growth since the acquisition. For financial advisory advertisers, this stabilization means reduced auction competition — fewer mass-market advertisers translates to lower CPMs for performance-focused campaigns targeting niche professional audiences. Financial services, B2B technology, and media companies have the strongest ROI case for X advertising in 2026, according to True Interactive.
X Engagement Benchmarks for Financial Services
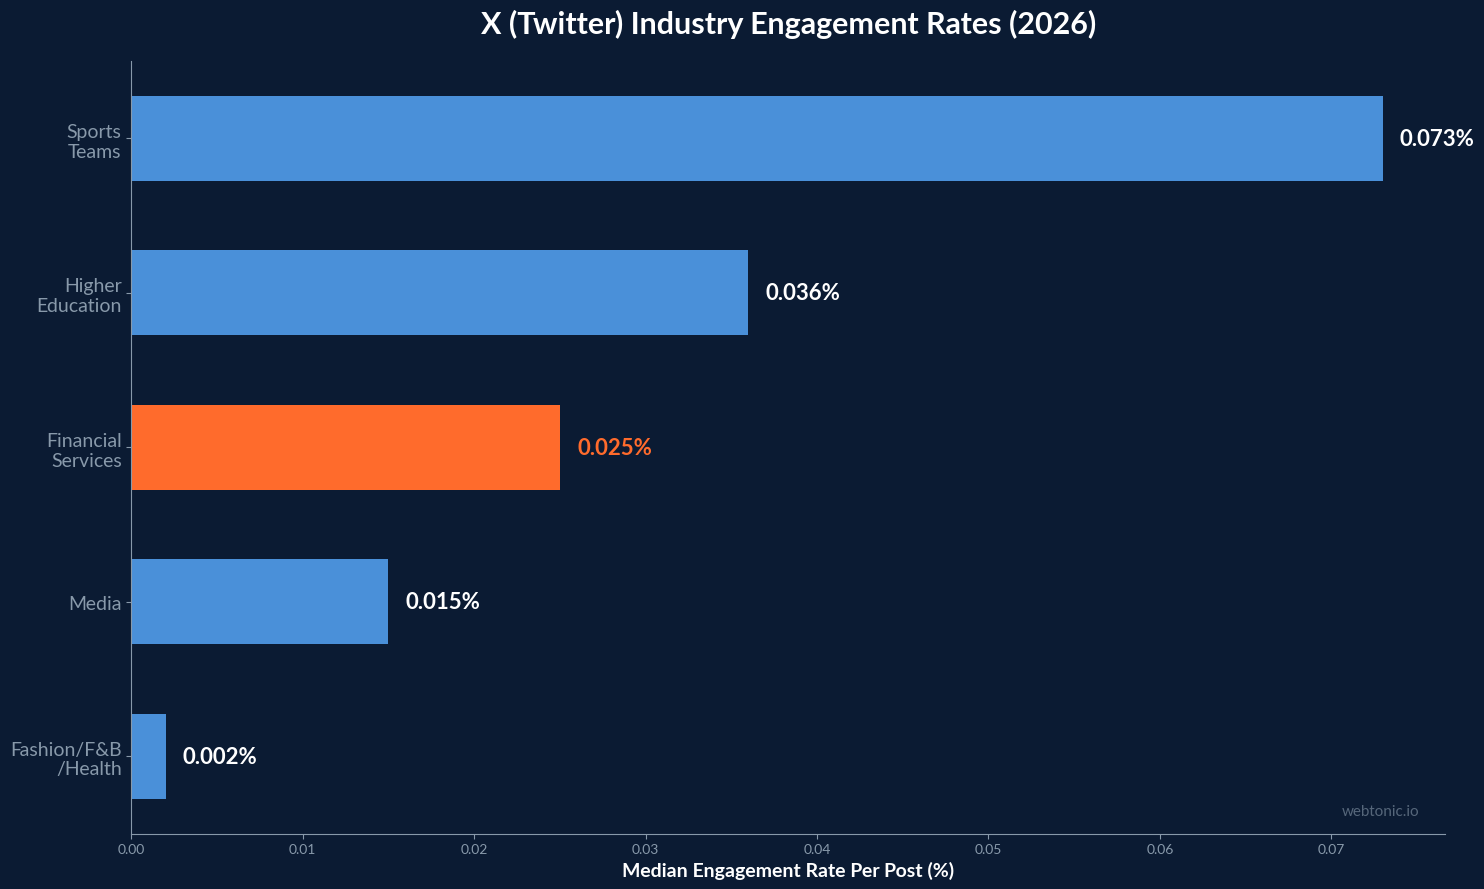
Financial services consistently ranks among the top-performing industries on X for organic engagement. While cross-industry median engagement has declined to 0.015% per post, financial services outperforms at 0.025% — third highest after higher education (0.036%) and sports teams (0.073%) (SocialNexis).
- Financial services organic engagement rate: 0.025% per post, 67% above the cross-industry median of 0.015%.
- Finance creators average 1.4% engagement rate on personal accounts, significantly higher than brand accounts due to the platform's preference for individual voices over corporate messaging.
- 58% of X users engage with brand content at least once per week, indicating regular commercial receptivity.
- X Premium verified accounts (1.3 million globally) receive algorithmic distribution priority, making the $8/month subscription a strategic investment for financial advisor profiles.
- Wealth management Twitter/X engagement sits at 0.06%, significantly below LinkedIn's 1.6% for the same vertical, highlighting the need to pair X presence with multi-channel data intelligence strategies.
X vs Other Platforms: Financial Advisory Advertising Comparison
Positioning X within the broader paid social landscape helps financial advisors determine where the platform fits in their media mix. Each channel serves a different stage of the prospect journey, and X's unique value lies in thought-leadership amplification and real-time credibility building.
| Platform | Finance CPC | Finance CPM | Avg. Monthly Spend | Primary Strength |
|---|---|---|---|---|
| X (Twitter) | $1.00–$3.00 | $6.00–$8.00 | $101–$500 | Thought leadership, real-time |
| $5.00–$8.00 | $30.00–$45.00 | $1,000–$5,000 | Professional targeting | |
| Meta (Facebook/IG) | $3.50–$4.50 | $12.00–$18.00 | $500–$3,000 | Scale and retargeting |
| Google Ads | $3.50–$7.00 | N/A | $1,000–$10,000 | High-intent search capture |
| TikTok | $1.71–$2.20 | $18.00 | $1,500–$5,000 | Awareness, younger demo |
X offers the lowest entry cost among major paid social platforms for financial advisors. At $101–$500/month, a solo practitioner can test campaigns and build an audience without the $1,000+ minimum practical spends required on LinkedIn or Google Ads. The platform's text-first format also means lower creative production costs — no video editing or graphic design required for effective ad units, which is why many advisory firms pair X with Meta Ads management for a balanced paid social strategy.
X Ad Formats and Their Financial Services Applications
X offers several ad formats, each suited to different financial advisory campaign objectives. Format selection impacts both cost and conversion efficiency based on campaign goals (Improvado).
- Promoted Posts: $0.26–$0.50 per first action — ideal for amplifying market commentary, research summaries, and educational threads. Financial advisors see the highest ROI from promoting tweets that already have organic traction.
- Promoted Accounts: $1.01–$2.00 per follow — effective for building a targeted follower base of prospects and referral partners. Finance accounts growing via promoted follows report 25–35% higher follower-to-lead conversion rates than organic-only growth.
- Collection Ads: $0.75 CPC average — suited for showcasing multiple service offerings (retirement planning, tax strategy, estate planning) in a single ad unit, driving qualified traffic to specific landing pages.
- Trend Takeover: premium pricing (fixed) — rarely used by individual advisory firms but effective for wealth management brands during major financial events (tax season, market corrections, regulatory changes).
X User Demographics and Financial Audience Profile
Understanding who uses X is critical for financial advisory ad targeting. The platform's user base has distinct characteristics that differentiate it from other social networks, according to data from SocialNexis and Digital Applied.
- 611 million monthly active users worldwide in 2026, a 4.3% increase year-over-year. Growth is primarily driven by emerging markets in Africa, Southeast Asia, and the Middle East.
- X ads reach 586 million users globally, representing 7.1% of the world's population — a broad but disproportionately professional and news-oriented audience.
- X Premium has approximately 6.3 million total subscribers (4.4 million X Premium + 1.9 million Grok), though only 1.3 million are paying X Premium users — just 0.21% of the user base.
- 550 million monetizable monthly active users as disclosed in the SpaceX S-1 filing (March 2026), providing the first audited engagement metric since the acquisition.
- Higher education (0.036%) and financial services (0.025%) rank second and third in industry engagement rates, trailing only sports teams (0.073%) — financial content naturally fits the platform's real-time information culture.
- The platform's 25–54 age demographic skews professional and high-income, overlapping with the core financial advisory prospect profile more closely than TikTok or Instagram.
For financial advisors, X's value proposition is audience quality over audience quantity. The 550 million monetizable users represent a self-selected audience of professionals, investors, and information seekers who actively engage with financial content — a targeting advantage that offsets the platform's smaller overall scale compared to Meta or TikTok.
Best Practices for Financial Advisory X Campaigns
Financial advisors generating strong returns on X follow specific patterns that leverage the platform's unique strengths. These practices draw on engagement data from OJay Media and platform benchmarks from Qwitter.
- Adopt an individual voice over a corporate brand account — personal financial advisor accounts generate 1.4% engagement versus near-zero for corporate brand pages. X's algorithm rewards personal content over institutional messaging.
- Post data-driven market commentary during trading hours — threads analyzing market movements, economic data releases, and regulatory changes outperform generic financial tips by 3–5× in engagement.
- Use X Premium verification ($8/month) for algorithmic boost — verified accounts receive priority distribution in feeds and replies, increasing organic reach by an estimated 20–40% for the same content.
- Promote threads over single tweets — multi-tweet threads analyzing a financial topic generate 2–3× higher engagement than standalone posts, and the extended format allows nuanced financial analysis that builds advisor credibility.
- Target by interest + follower lookalikes — combining financial interest categories with followers of established financial commentators yields 30–40% lower CPA than broad demographic targeting alone.
- Set month-1 benchmarks at 50,000 impressions, 200 profile visits, and 15 lead magnet clicks for new accounts launching paid campaigns alongside organic posting.
- Leverage performance creative for compliance-approved ad templates — pre-approved formats reduce regulatory review cycles and maintain consistent messaging across organic and paid content.
Frequently Asked Questions
How much do X (Twitter) ads cost for financial advisors?
Financial advisory ads on X average $1.00–$3.00 CPC and $6.00–$8.00 CPM. Most advisory firms spend between $101–$500/month on the platform, making it one of the most accessible paid social channels. Promoted posts cost $0.26–$0.50 per first action, while promoted account campaigns run $1.01–$2.00 per follow.
Is X still worth advertising on after the rebrand?
For financial advisory firms, X remains a viable and cost-effective advertising channel. While ad revenue fell 62% from the 2021 peak, the 2025 recovery (+7%) signals stabilization. Reduced advertiser competition means lower auction CPMs for performance-focused campaigns. Financial services is explicitly identified as one of the strongest-fit verticals for X advertising in 2026.
What engagement rates should financial advisors expect on X?
Financial services averages 0.025% engagement per post at the brand level — third highest across all industries on X. Individual finance creator accounts achieve significantly higher rates at 1.4% engagement. Advisors posting data-driven market commentary during trading hours can expect 3–5× higher engagement than generic financial content.
How does X compare to LinkedIn for financial advisor marketing?
X offers significantly lower costs ($1.00–$3.00 CPC vs. $5.00–$8.00) but narrower professional targeting than LinkedIn. LinkedIn engagement for wealth management (1.6%) far exceeds X (0.06%). The optimal strategy combines X for real-time thought leadership and awareness with LinkedIn for direct prospect targeting and lead generation. Read our paid social ROI analysis for a deeper platform comparison.
What content performs best for financial advisors on X?
Data-driven market commentary generates the highest engagement for financial advisors on X. Multi-tweet threads outperform single posts by 2–3×, and analytics-backed content outperforms opinion posts. The platform rewards timely, insight-rich content posted during market hours, with month-1 benchmarks of 50,000 impressions and 200 profile visits for new accounts.
Sources
socialnexis.com
businessinsider.com
improvado.io
webfx.com
trueinteractive.com
useqwitter.com
cufinder.io
ojaymediamarketing.com
digitalapplied.com


