Table of contents
The average financial advisor website takes 10.7 seconds to render its main content — more than 4× slower than Google's 2.5-second passing threshold for Largest Contentful Paint. Across a benchmark study of 254 financial advisor sites in the US, the typical advisory firm scores just 59 out of 100 on Google's performance audit, signaling major technical SEO gaps that directly impact search visibility, user experience, and client conversion rates.
Key Takeaways
- Average financial advisor LCP is 10.7 seconds — 4.3× slower than Google's 2.5-second threshold, making most advisory sites fail Core Web Vitals (borahlabs.us).
- Only 82.4% of financial advisor websites use SSL, leaving 45 out of 254 sites triggering Chrome security warnings that destroy visitor trust (borahlabs.us).
- Average Lighthouse performance score is 59/100, while SEO score averages 84/100 — indicating that on-page SEO is better addressed than site speed (borahlabs.us).
- Fewer than 35% of advisory firm sites carry structured FAQ schema on core service pages, missing measurable AI Overview visibility (authorityspecialist.com).
- 58.2% of wealth management website traffic comes from mobile devices, but desktop converts at 2× the rate (4.8% vs. 2.1%) (cufinder.io).
- Organic search drives 44.1% of financial advisory website traffic, making technical SEO the foundation of the primary acquisition channel (cufinder.io).
- FinancialService schema adoption sits at just 0.07% of tracked websites — a massive untapped opportunity for advisory firms (fintechmarketingagency.digital).
Core Web Vitals Benchmarks for Financial Advisor Websites
| Metric | Financial Advisor Average | Google's Passing Threshold | Gap |
|---|---|---|---|
| Largest Contentful Paint (LCP) | 10.7s | 2.50s | 4.3× over threshold |
| First Contentful Paint (FCP) | 3.73s | 1.80s | 2.1× over threshold |
| Cumulative Layout Shift (CLS) | 0.11 | 0.10 | 10% over threshold |
| Time to First Byte (TTFB) | 0.05s | 0.80s | Passes easily |
The data from a July 2026 benchmark study of 254 US financial advisor websites reveals that most advisory sites fail Google's Core Web Vitals on the metrics that matter most for rankings (borahlabs.us). The LCP gap of 8.2 seconds above threshold is particularly damaging — Google has confirmed that pages failing LCP face measurable ranking disadvantages in both traditional search and AI Overviews. The one bright spot is TTFB at 0.05 seconds, indicating that most advisory site servers respond quickly — the bottleneck is front-end rendering, not infrastructure.
Financial Advisor Site Performance Scores
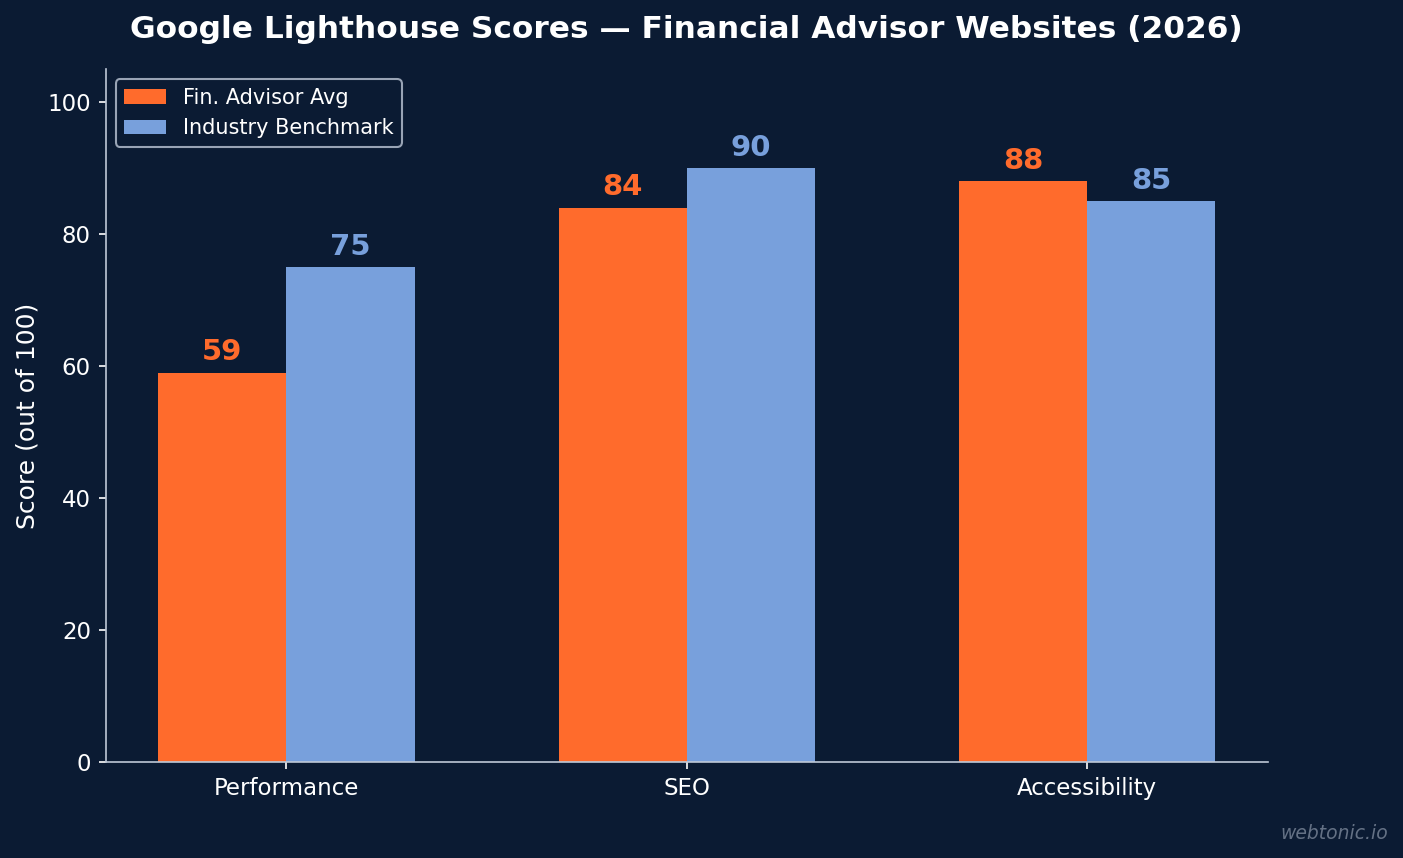
Google Lighthouse audits across the 254-site sample reveal a clear pattern: financial advisor websites are significantly better at on-page SEO fundamentals than performance optimization (borahlabs.us).
| Audit Category | Average Score | Industry Benchmark | Assessment |
|---|---|---|---|
| Performance | 59/100 | 70–80 | Below average — major speed issues |
| SEO | 84/100 | 85–95 | Near benchmark — basic on-page covered |
| Accessibility | 88/100 | 80–90 | On target — compliant foundations |
The 25-point gap between Performance (59) and Accessibility (88) indicates that most advisory firms invest in content structure and compliance but neglect image optimization, render-blocking resources, and JavaScript execution — the primary drivers of poor LCP and FCP.
SSL, HTTPS, and Security Adoption Statistics
Website security is both a technical SEO ranking factor and a trust signal — especially critical for financial advisory sites that handle sensitive client information:
- 82.4% of financial advisor sites have SSL certificates installed — 210 out of 254 sites are secured, while 45 sites lack SSL entirely (borahlabs.us).
- The 17.6% without SSL trigger Chrome browser warnings that immediately signal "Not Secure" to visitors — a trust-killer for any financial services website.
- Google has used HTTPS as a ranking signal since 2014, and sites without SSL face measurable disadvantages in search results.
- The financial services sector's SSL adoption rate lags behind e-commerce (95%+) and healthcare (90%+) where regulatory pressure drives compliance (comparecheapssl.com).
For financial advisors, SSL is non-negotiable. Beyond the SEO ranking impact, the absence of HTTPS creates a compliance risk for firms handling client data and erodes the foundational trust that advisory relationships depend upon.
Schema Markup and Structured Data Statistics
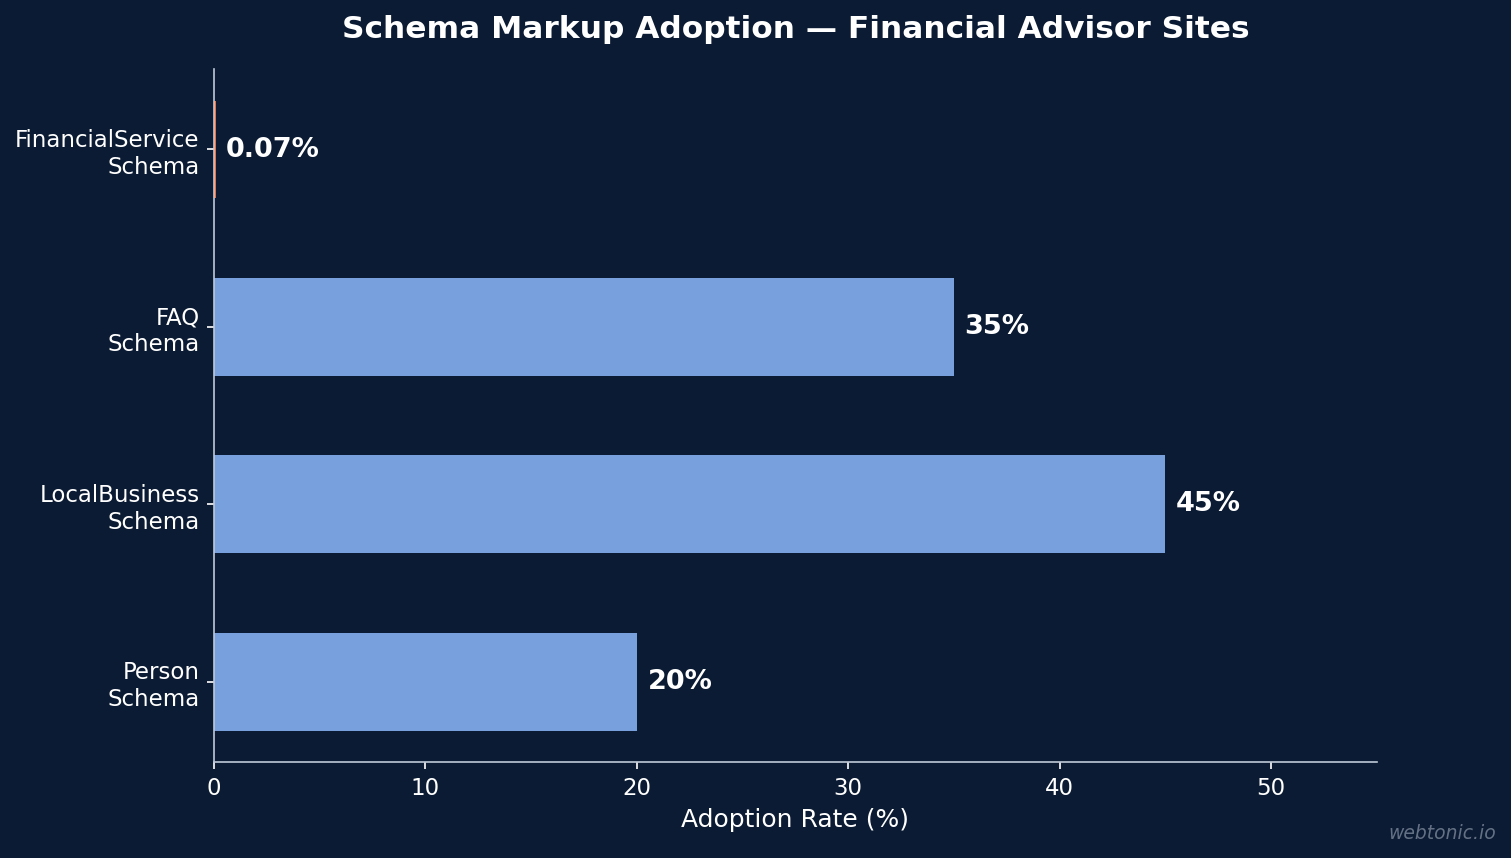
Structured data adoption among financial advisor websites represents one of the largest untapped technical SEO opportunities in the industry:
| Schema Type | Adoption Rate | Impact on Advisory SEO |
|---|---|---|
| FinancialService Schema | 0.07% of tracked sites | Knowledge Graph eligibility, rich results |
| FAQ Schema | <35% of advisory firms | AI Overview visibility, rich snippets |
| LocalBusiness Schema | ~40–50% (estimated) | Map Pack inclusion, local search signals |
| Person Schema (Advisor) | <20% (estimated) | E-E-A-T signals, authorship recognition |
FinancialService schema adoption sits at just 0.07% of tracked websites globally — meaning virtually no financial advisor sites are leveraging this schema type to enhance their search presence (fintechmarketingagency.digital). The opportunity is even clearer for FAQ schema: fewer than 35% of advisory firm sites carry structured FAQ markup on their core service pages, leaving measurable AI Overview visibility on the table (authorityspecialist.com).
Multi-advisor firms that consolidate service pages under a unified entity structure see faster Knowledge Graph association than those running siloed advisor microsites (authorityspecialist.com). Implementing structured data strategies like FinancialService + Person + FAQ schema creates compound E-E-A-T signals that both traditional search and AI systems use to evaluate advisory content credibility.
Mobile Optimization and Traffic Statistics
Mobile performance is the critical conversion bottleneck for financial advisory websites:
- 58.2% of wealth management website traffic comes from mobile devices, yet desktop converts at 2× the rate — 4.8% vs. 2.1% (cufinder.io).
- The 2.7 percentage point conversion gap between mobile and desktop signals significant mobile UX friction — likely driven by slow load times (10.7s average LCP), poor form design, and unoptimized call-to-action placement on smaller screens.
- Organic search drives 44.1% of total financial advisory website traffic, making mobile-first indexing performance directly tied to the primary acquisition channel (cufinder.io).
- Google's mobile-first indexing means the mobile version of an advisory site is the primary version Google evaluates for rankings — a site that performs well on desktop but fails Core Web Vitals on mobile will be penalized.
Closing the mobile-desktop conversion gap from 2.1% to even 3.5% on mobile would represent a 67% increase in mobile conversions for the average advisory firm — a substantial revenue impact given that more than half of all traffic arrives on mobile devices.
Financial Advisor Website Technology Stack
| Technology | Adoption Rate | Technical SEO Impact |
|---|---|---|
| Cloudflare | 13.2% | CDN performance, security headers, edge caching |
| Google Analytics | 13.1% | Core measurement, but adds render-blocking JS |
| jQuery | 12.4% | Legacy dependency, often slows LCP |
| HSTS | 11.8% | Forces HTTPS, prevents downgrade attacks |
| Google Tag Manager | 8.9% | Tag management, but third-party script risk |
| WordPress | 8.0% | Flexible CMS, plugin bloat risk for performance |
| HTTP/3 | 8.2% | Modern protocol, reduced latency |
The technology landscape reveals why financial advisor sites struggle with performance. The combination of jQuery (12.4%) and multiple analytics tags (Google Analytics 13.1%, GTM 8.9%) creates render-blocking JavaScript that directly contributes to the 10.7-second average LCP (borahlabs.us). Only 8.2% of advisory sites use HTTP/3 and 13.2% use Cloudflare CDN, leaving most sites without the modern infrastructure needed to achieve passing Core Web Vitals scores.
Organic Search Performance and Ranking Statistics
Despite technical SEO gaps, organic search remains the highest-value channel for financial advisory firms:
- Organic CTR for top-3 positions on wealth management queries runs 3.4%–5.1% in the advisory vertical (authorityspecialist.com).
- Ranking timelines of 4–6 months are typical before meaningful organic visibility, with competitive metro markets taking longer (authorityspecialist.com).
- Fee-only and fiduciary-framed content consistently outperforms generic financial planning pages in organic rankings.
- Credentialed advisor authorship produces top-5 rankings on HNW-intent queries at roughly 2× the rate compared to content without advisor attribution (authorityspecialist.com).
- Local search (Map Pack) moves faster than national rankings for firms with an optimized Google Business Profile.
Technical SEO Audit Priorities for Financial Advisor Websites
Based on the benchmark data from 254+ advisory sites, the highest-impact technical SEO improvements follow a clear priority order:
- Fix Core Web Vitals — especially LCP: With an average LCP of 10.7 seconds, image optimization (WebP/AVIF conversion, lazy loading, responsive sizes), eliminating render-blocking JavaScript (jQuery, excessive GTM tags), and implementing efficient font loading are the top priorities. Moving from a 10.7s to sub-2.5s LCP can meaningfully improve Google rankings.
- Implement SSL universally: The 17.6% of advisory sites without SSL face both ranking penalties and trust destruction. SSL certificate installation is typically a same-day fix that provides immediate security and SEO benefits.
- Deploy structured data: Add FinancialService, Person, LocalBusiness, and FAQ schema to relevant pages. With adoption rates at 0.07% for FinancialService schema, early adopters gain a significant competitive edge in rich results and AI Overviews.
- Optimize mobile UX: Close the 2.1% to 4.8% conversion gap between mobile and desktop by improving mobile form design, button sizes, call-to-action placement, and page load performance on mobile networks.
- Consolidate site architecture: Multi-advisor firms should unify service pages under a single entity structure rather than running siloed advisor microsites — this accelerates Knowledge Graph association and consolidates domain authority (authorityspecialist.com).
- Modernize the tech stack: Migrate from jQuery (12.4% adoption) to modern JavaScript, implement HTTP/3 (only 8.2% adoption), and adopt a CDN like Cloudflare to improve TTFB and reduce latency for visitors across geographic regions.
Financial advisor websites that address these six technical SEO priorities can expect measurable improvements in search rankings within 4–6 months. The combination of data-driven technical optimization with content strategy creates compounding organic growth that outpaces paid channel dependency over time.
Frequently Asked Questions
What is the average page speed for financial advisor websites?
The average financial advisor website has a Largest Contentful Paint of 10.7 seconds — more than 4× slower than Google's 2.5-second passing threshold. First Contentful Paint averages 3.73 seconds against a 1.80-second threshold. Only Time to First Byte (0.05s) consistently passes, indicating that server infrastructure is adequate but front-end rendering is the bottleneck.
What percentage of financial advisor sites have SSL?
82.4% of financial advisor websites have SSL certificates, based on a 254-site benchmark study. The remaining 17.6% (45 sites) lack SSL entirely, triggering Chrome "Not Secure" warnings that immediately erode visitor trust — especially damaging for firms handling sensitive financial information.
How does schema markup impact financial advisor SEO?
Schema markup adoption among financial advisors is extremely low: FinancialService schema appears on just 0.07% of tracked websites, and fewer than 35% of advisory firms use FAQ schema on service pages. Firms that implement structured data see faster Knowledge Graph association, rich snippet eligibility, and improved AI Overview visibility — creating a significant competitive advantage given the near-zero adoption baseline.
What is the mobile conversion rate for financial advisor websites?
Mobile conversion rates for financial advisor websites average 2.1%, compared to 4.8% on desktop — a 2× gap. With 58.2% of traffic coming from mobile, this conversion gap represents the single largest revenue opportunity for most advisory firms. Improving mobile Core Web Vitals and form UX are the highest-ROI technical SEO investments.
How long does it take for financial advisor SEO to show results?
Financial advisor SEO campaigns typically require 4–6 months before producing meaningful organic visibility. Competitive metro markets may take longer. Local search performance (Google Map Pack) often moves faster than broad national rankings, making local SEO a quicker-win channel for advisors with a physical office presence.
Sources
borahlabs.us — Financial Advisors Website Benchmarks (July 2026)
authorityspecialist.com — Financial Advisor SEO: 2026 Benchmarks from 41 Advisory Firms
cufinder.io — Wealth Management Industry Marketing Benchmarks 2026
comparecheapssl.com — Website SSL Adoption by Industry (2026)
fintechmarketingagency.digital — Fintech Schema Markup Guide
gitnux.org — Marketing in the Finance Industry Statistics