



Table of contents
Financial Advisory Analytics Statistics: Tracking What Matters in 2026
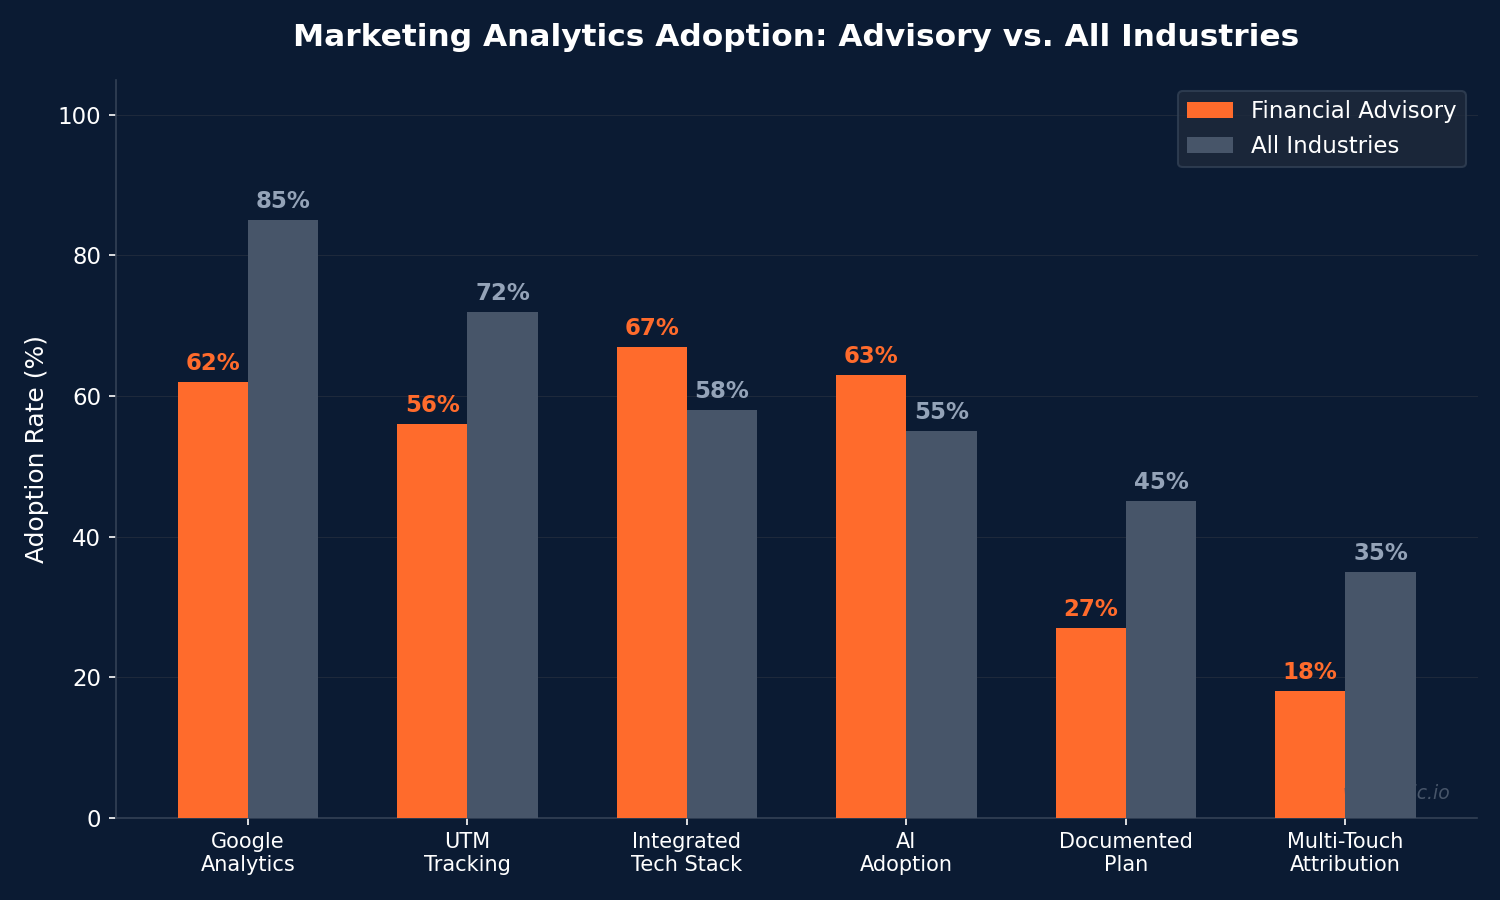
Only 62% of RIA firms actively leverage Google Analytics for tracking, and just 56% use UTM parameters to attribute leads to specific campaigns — leaving nearly half of advisory marketing spend effectively unmeasured. Below is the data that reveals how the best-performing advisory firms use analytics to outpace their competition.
Key Takeaways
- 62% of RIAs use Google Analytics for marketing tracking, but only 56% consistently tag campaigns with UTM parameters (Gitnux).
- 67% of advisors now use an integrated technology stack, up from under 40% in 2021 — making CRM-to-analytics pipelines the new baseline (CircleBlack).
- 63% of RIAs use AI in some capacity, more than double the 2023 rate, though most remain in individual experimentation rather than firm-wide analytics strategy (Orion 2026).
- Organic search drives 35% of revenue at 850% ROI when properly attributed — a finding that shifted budget away from LinkedIn Ads (7% of revenue, 140% ROI) at one advisory firm (VantagePoint).
- Mobile traffic dominates at 58.2%, but desktop converts 2x better (4.8% vs. 2.1%), highlighting the importance of device-specific analytics segmentation (CuFinder).
- Firms with documented marketing plans acquire 67% more new clients annually, and analytics-driven firms track LTV/CAC ratios targeting 5:1 or higher (Defiance Analytics, OJay Media).
- Email open rates for financial services hit 36.5%, among the highest across all industries, but only firms tracking downstream conversion attribute this to revenue (CuFinder).
Marketing Analytics Adoption Benchmarks at a Glance
| Analytics Metric | Financial Advisory | All-Industry Average |
|---|---|---|
| Google Analytics Adoption | 62% | 85% |
| UTM Tracking Adoption | 56% | 72% |
| Integrated Tech Stack | 67% | 58% |
| AI Adoption (Any Capacity) | 63% | 55% |
| Documented Marketing Plan | 27% | 45% |
| Multi-Touch Attribution | ~18% | 35% |
| CRM-Marketing Integration | 67% | 52% |
Sources: Gitnux, CircleBlack, Orion, Defiance Analytics
The Marketing Measurement Stack for Advisory Firms
The modern advisory marketing measurement stack has evolved beyond standalone Google Analytics into a multi-layer system. According to Platinum Prospects' 2026 guide, the minimum viable stack includes four layers: platform pixels (Meta CAPI, Google Enhanced Conversions), GA4 with event-level tracking, CRM integration (lead source, campaign source, submission timestamp), and a reporting layer (Looker, Tableau, or built-in CRM dashboards).
Critical tracking events for advisory firms include:
- Lead qualified — when a prospect meets minimum AUM or demographic criteria.
- Appointment booked — the primary conversion event that ties directly to cost per booked call ($200–$600).
- Client won — the downstream CRM event that enables true ROI measurement against the $1,200–$4,000 acquisition cost range.
- Cross-device user_id — essential when 58.2% of traffic arrives on mobile but desktop converts 2x better.
Firms that connect GA4 to Google Ads, Search Console, and BigQuery gain a unified view that makes Google Ads optimization significantly more precise. The non-negotiable CRM fields — lead source (UTM parameters), campaign source, submission timestamp, and advisor assignment — form the backbone of closed-loop reporting. Without these fields populated consistently, even the best analytics tools cannot connect marketing spend to revenue outcomes.
The cost of inadequate measurement is substantial. Advisory firms without proper analytics attribution typically overinvest in channels that appear to drive results (often paid search, which captures last-click credit) and underinvest in content marketing, Meta Ads remarketing, and email nurture sequences that create demand earlier in the funnel but rarely receive last-click attribution.
KPI Tracking and ROI Measurement
The most effective advisory firms track a specific set of KPIs that map to their business model. OJay Media's 2026 benchmark dashboard identifies the following tier structure:
| KPI Category | Metric | Target Range | Red Flag Threshold |
|---|---|---|---|
| Engagement | CTR | Google: 2–5%; Meta: 0.9–2.5% | Below 1% |
| Lead Gen | Cost per Lead | $80–$250 | Above $300 |
| Sales | Cost per Booked Call | $200–$600 | Above $800 |
| Client | AUM per New Client | $250K–$750K | Declining trend |
| Client | LTV/CAC Ratio | Target >5:1 | Below 3:1 |
| Efficiency | Marketing Spend as % Revenue | 7–15% | Below 5% |
The LTV/CAC ratio is particularly powerful in financial advisory: with average AUM per new client between $250K–$750K and advisory fees of 0.75–1.25%, a single client generates $1,875–$9,375 in annual revenue. Against a $1,200–$4,000 acquisition cost, the first-year LTV/CAC ratio ranges from 0.5:1 to 7.8:1 — but with 10+ year average client retention, the lifetime ratio reaches 5:1 to 78:1.
Multi-Touch Attribution in Financial Advisory
The average financial advisory sales cycle spans 6–18 months, making single-touch attribution models (first-click or last-click) dangerously misleading. VantagePoint's analysis revealed a striking case: attribution showed organic search drove 35% of revenue at 850% ROI, while LinkedIn Ads generated only 7% at 140% ROI. Budget was reallocated accordingly, resulting in overall program improvement.
Key attribution findings for advisory firms:
- Organic search is consistently undervalued in last-click models because content marketing touches (blog visits, SEO-driven research) occur early in the funnel but disappear from last-click attribution by the time a prospect books a consultation.
- LinkedIn outbound costs $250–$900 per client with 50–180% ROI — effective for high-AUM prospects but expensive relative to content-driven channels when properly attributed.
- Cold email response rates average 4.2% for RIAs, making it a viable channel only when tracked through full-funnel attribution to measure downstream conversion quality.
- Multi-touch attribution can be wired into CRM in 90 minutes according to OJay Media — making it the highest-leverage data project for advisory firms spending $5K–$25K/month on marketing.

Technology Adoption and AI in Advisory Analytics
The analytics technology landscape for financial advisors is shifting rapidly. CircleBlack's 2026 data shows that 38% of firms use AI to generate marketing content (blog posts, social media, newsletters) and 31% use it for drafting client correspondence. But the bigger story is infrastructure: 67% of advisors now use an integrated technology stack, a dramatic increase from under 40% in 2021.
The Wolf Financial compliance-first martech guide outlines the standard stack layers: CRM (Salesforce, Wealthbox, Redtail), analytics (GA4, Looker, Tableau), automation (HubSpot, ActiveCampaign), and attribution (revenue attribution connecting closed deals to marketing campaigns). The gap in most advisory firms is not the tools — it is the integration between layers that enables true closed-loop measurement.
Despite high AI adoption rates, Orion's 2026 State of the Advisor Report notes that most firms remain in individual experimentation rather than firm-wide AI-driven analytics strategy. The firms achieving the highest ROI from analytics are those using AI not just for content creation but for predictive lead scoring, automated campaign optimization, and real-time budget allocation.
The technology adoption gap creates a competitive opportunity: advisory firms that build integrated analytics stacks now are capturing disproportionate market share. Defiance Analytics reports that RIA firms with documented marketing strategies and proper attribution infrastructure acquire 67% more new clients annually than those without — a gap that widens as digital advertising costs continue rising and the firms without measurement lose the ability to optimize spend efficiently.
Channel Performance When Properly Measured
| Channel | Avg. CPL | Attributed ROI | Revenue Share |
|---|---|---|---|
| Organic Search (SEO) | $45–$120 | 500–850% | 30–35% |
| Google Ads | $80–$250 | 200–400% | 20–30% |
| Meta Ads | $60–$180 | 150–350% | 10–20% |
| LinkedIn Outbound | $250–$900 | 50–180% | 5–10% |
| Email Marketing | $15–$40 | 300–600% | 10–15% |
| Referral Programs | $0–$50 | 1,000%+ | 20–40% |
Sources: OJay Media, VantagePoint, CuFinder
The data underscores a consistent finding: referrals and organic search deliver the highest ROI, but paid channels like Meta Ads and Google Ads are essential for predictable lead volume. The advisory firms achieving the best overall results blend high-ROI organic channels with paid acquisition and measure everything through unified attribution.
Device and Behavioral Analytics Insights
Understanding how prospects interact with advisory content across devices is a critical analytics capability. The mobile-desktop conversion gap is one of the most actionable insights: while 58.2% of traffic arrives via mobile, desktop visitors convert at 4.8% compared to just 2.1% on mobile — a 2.3x difference that has significant implications for campaign targeting and landing page design.
Behavioral analytics from wealth management firms reveal additional patterns:
- LinkedIn engagement (1.6%) outperforms all other social platforms for advisory content — making it the primary channel for organic analytics investment and content distribution measurement.
- Email open rates in financial services average 36.5%, among the highest of any industry, but only firms tracking click-to-conversion flows capture the downstream value of email engagement.
- Average session duration on advisor websites is 2.4 minutes — visitors who watch a video stay 3.5x longer and convert at 2x the rate, making video engagement a powerful predictive metric for lead quality.
- Return visitor conversion rate is 3–5x higher than first-visit conversion, which means analytics systems that track new vs. returning segments can dramatically improve retargeting efficiency.
Firms that segment their analytics by device, behavior, and visit frequency can build predictive models that allocate budget toward the traffic sources producing the highest downstream value — not just the cheapest clicks.
Financial Advisory Analytics vs. Other Industries
| Metric | Financial Advisory | Healthcare | Legal | SaaS |
|---|---|---|---|---|
| GA4 Adoption | 62% | 78% | 55% | 92% |
| Multi-Touch Attribution | ~18% | 22% | 15% | 48% |
| CRM Integration | 67% | 52% | 45% | 78% |
| AI in Marketing | 63% | 42% | 28% | 72% |
| Avg. Sales Cycle | 6–18 months | 1–4 weeks | 2–8 weeks | 1–6 months |
| LTV/CAC Target | 5:1+ | 3:1+ | 3:1+ | 3:1+ |
Financial advisory stands out for its high CRM integration rate (67%) driven by the relationship-centric nature of the business, and its unusually long sales cycle (6–18 months) that makes multi-touch attribution essential rather than optional. The 63% AI adoption rate — higher than healthcare or legal — reflects the industry's rapid embrace of technology for content and analytics, even as firm-wide strategy adoption lags behind.
Related reading
- Financial Advisory Marketing Attribution Statistics (2026)
- Financial Advisory Marketing Dashboards Statistics (2026)
- 28+ Financial Advisory Email Marketing Statistics (2026 Benchmarks)
- Marketing Analytics services at Web Tonic
FAQ
What percentage of financial advisors use Google Analytics?
Approximately 62% of RIA firms actively use Google Analytics for marketing tracking, and 56% use UTM parameters to attribute leads to campaigns. However, only a fraction configure GA4 with proper event tracking for appointment bookings and client acquisitions.
What is the best LTV/CAC ratio for financial advisory marketing?
The target LTV/CAC ratio for sustainable advisory marketing is 5:1 or higher. Below 3:1 signals unsustainable marketing spending. Given the long client retention periods in wealth management (10+ years average), even initial ratios of 2:1 can reach lifetime ratios of 20:1+.
How do financial advisors measure marketing ROI?
The most effective approach is multi-touch attribution wired into CRM, connecting closed deals back to the marketing campaigns that influenced them. This reveals channel-level ROI — for example, organic search may drive 35% of revenue at 850% ROI compared to LinkedIn Ads at 7% and 140% ROI.
What is the average cost per lead for financial advisors?
Financial advisory CPL ranges from $45 to $250 depending on channel, with organic search at the low end ($45–$120) and LinkedIn outbound at the high end ($250–$900). The key metric is not CPL alone but cost per acquired client ($1,200–$4,000) and the resulting LTV/CAC ratio.
What marketing technology do RIA firms use in 2026?
67% of advisors use an integrated technology stack that typically includes a CRM (Salesforce, Wealthbox, Redtail), analytics platform (GA4), marketing automation (HubSpot, ActiveCampaign), and reporting layer. AI adoption has reached 63%, primarily for content generation (38% of firms) and client correspondence (31%).
Sources
https://gitnux.org/marketing-in-the-ria-industry-statistics/
https://www.circleblack.com/key-ria-industry-statistics/
https://orion.com/2026-state-advisor-report
https://www.ojaymediamarketing.com/blog/marketing-kpis-for-financial-advisors/
https://www.ojaymediamarketing.com/blog/financial-advisor-marketing-roi/
https://vantagepoint.io/blog/hs/multi-touch-attribution-proving-marketing-roi-in-complex-financial-services-sales-cycles
https://cufinder.io/blog/benchmarks/wealth-management/
https://www.platinumprospects.ai/guides/measurement-stack-meta-capi-google-ga4-crm
https://wolf.financial/blog/building-compliant-martech-stack-financial-services
https://www.defianceanalytics.com/blog/ria-client-acquisition-playbook-for-digital-aum-growth


