Table of contents
Close to half of B2B marketing teams now put more than 30% of their program budget into live events, and CEIR's 2026 data puts exhibition spend at 40.8% of exhibitor marketing budgets - the single largest channel line most B2B teams run. This page pulls the 2026 planning numbers together: how much gets spent, how it splits by scope and team size, and how teams are learning to defend the number when a CFO asks for the return.
Key Takeaways
- 31.6% of B2B marketing budgets goes to live events on average (CEIR/Exhibitor Magazine data).
- 40.8% of exhibitor marketing budgets goes to B2B exhibiting alone (CEIR 2026).
- Close to half of teams put over 30% of program budget into events (Forrester 2026).
- 37% of organizations increased event budgets year over year, 31% cut them (Forrester Q1 2026).
- 40% of organizers expect budget growth in 2026, 40% expect it flat (Bizzabo).
- 82% of marketers expect total marketing budget to rise this year (Cvent 2026).
- 81% of marketers tie their events directly to business growth (Cvent 2026).
- 45% of event teams run with just 1-3 people (Bizzabo 2026).
- 86% of teams cannot accurately attribute revenue back to events (2026 B2B events report).
- ROI-proof difficulty fell from 70% to 40% of organizers year over year (Bizzabo).
- A healthy ROEI at 180 days runs 3x to 5x, 7x-plus is strong (Vendelux 2026).
- Cost per ICP-fit meeting above USD 15,000 at a tier-one conference is a red flag (Vendelux).
- 66% of marketers reported the same ROI and 32% an increase year over year (EventMarketer EVENTTRACK 2026).
- 52% of Fortune 1000 brands plan the same number of events, up 23 points (EventMarketer 2026).
- Business events supported 24.2 million jobs and USD 1.8 trillion of global GDP in 2025 (Events Industry Council).
How much of the budget events actually take
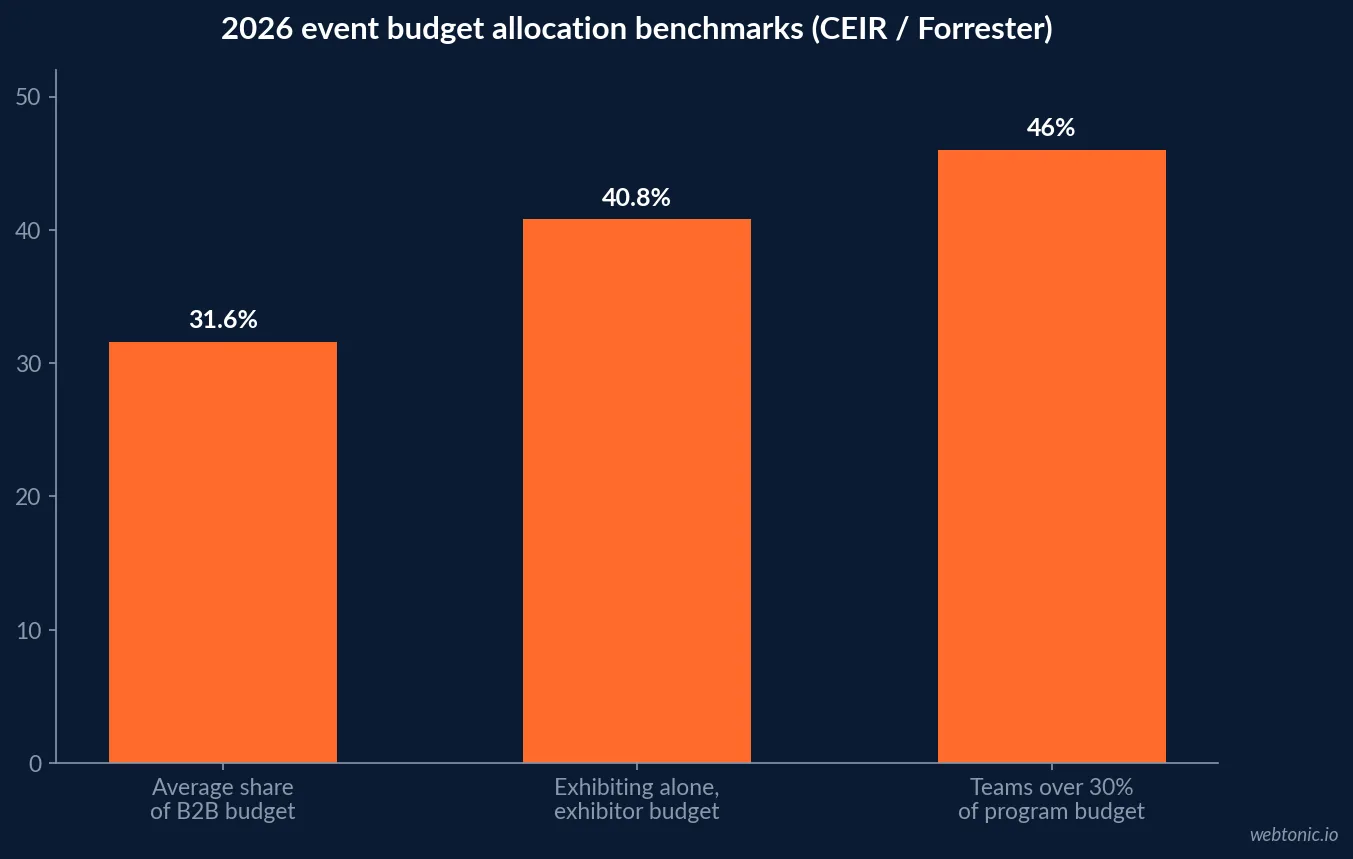
Two industry research bodies converge on roughly the same range for a very different reason to pay attention to it. CEIR's 2026 Marketing Spend Decision Report, surveying more than 1,200 North American exhibitors, puts exhibition spend at 40.8% of B2B exhibitor marketing budgets, the single largest channel by a wide margin. Forrester's 2026 State of B2B Events survey finds close to half of teams putting over 30% of their program budget into events overall, with high-ACV B2B SaaS running toward the 25-35% end and lower-ACV or manufacturing segments allocating less.
The takeaway is not a single target percentage. It is that events have become the largest or second-largest line in most B2B marketing budgets, which is exactly why the planning discipline below matters more than it did five years ago.
| Budget benchmark (2026) | Figure | Source | What it measures |
|---|---|---|---|
| Average share of B2B marketing budget on events | 31.6% | CEIR / Exhibitor Magazine | All event and trade show spend |
| Exhibiting alone, share of exhibitor budget | 40.8% | CEIR 2026 Marketing Spend Decision Report | Booth, staffing, logistics |
| Teams putting 30%+ of program budget into events | Close to half | Forrester 2026 State of B2B Events | Program-level allocation |
| High-ACV B2B SaaS allocation range | 25-35% | Forrester / Vendelux 2026 | Segment-adjusted benchmark |
| Organizations that increased event budgets YoY | 37% | Forrester Q1 2026 | Year-over-year change |
Growing, flat, or cut - the 2026 split
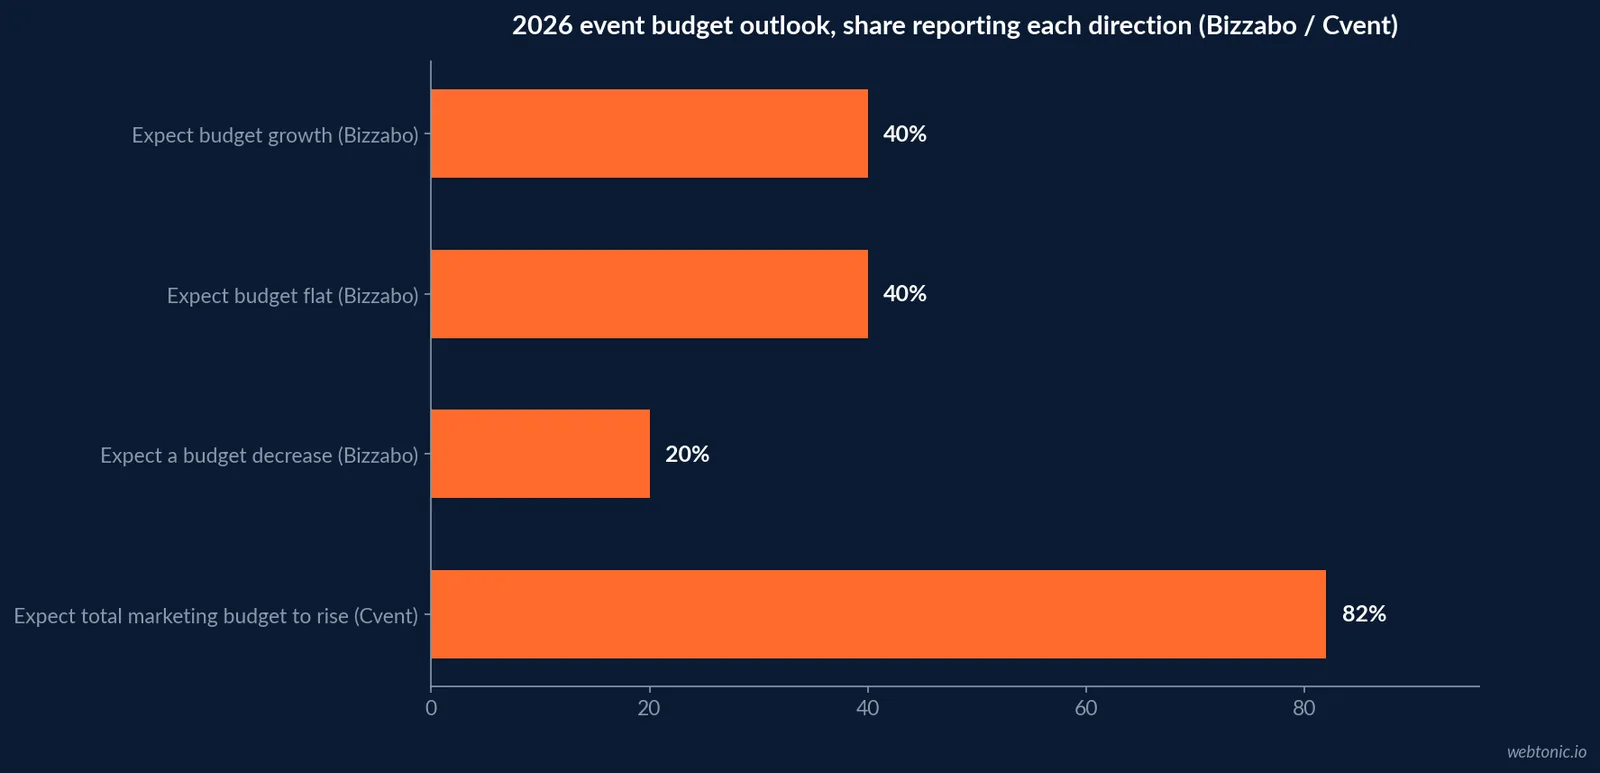
Ask three different research shops and you get three shades of the same picture. Bizzabo's 2026 benchmarks report 40% of organizers expecting budget growth, 40% expecting it to hold flat, and 20% expecting a decrease. Forrester's Q1 2026 survey found 37% of organizations increased event budgets year over year while 31% cut them - a near-even split that says events are being re-earned, not renewed automatically.
Cvent's 2026 Event-Led Growth Report, surveying more than 1,000 marketers across the US and UK, is the most bullish outlier: 82% expect total marketing budget to rise this year and 81% tie their events directly to business growth. The gap between Cvent's optimism and Forrester's near-even split likely reflects who answers each survey - marketers already committed to an event-led growth motion versus a broader cross-industry sample.
| 2026 budget direction | Share reporting it | Source | Read |
|---|---|---|---|
| Expect budget growth | 40% (Bizzabo) / 37% up YoY (Forrester) | Bizzabo 2026 / Forrester Q1 2026 | Roughly two in five teams growing |
| Expect budget to hold flat | 40% | Bizzabo 2026 | The largest single group |
| Expect a budget decrease | 20% (Bizzabo) / 31% cut (Forrester) | Bizzabo 2026 / Forrester Q1 2026 | Meaningful minority under pressure |
| Expect total marketing budget to rise | 82% | Cvent 2026 Event-Led Growth Report | Event-committed marketer sample |
| Fortune 1000 brands planning same event count | 52%, up 23 points | EventMarketer EVENTTRACK 2026 | Stability over expansion |
The team running the budget is small
The spend is large; the staff managing it usually is not. Bizzabo's 2026 data finds 45% of event teams operating with just 1-3 people, which is the practical reason scalable systems, templated run-of-show documents, and reusable budget frameworks show up in nearly every 2026 planning guide. A three-person team cannot custom-build the budget model for every event on a calendar that includes a flagship conference and a dozen regional field events.
Freeman's 2026 Trends Report work reinforces the staffing pressure from the attendee side: teams are being asked to prove value to increasingly selective audiences with the same or fewer planning hours per event, not more.
Where the ROI-proof problem actually sits
Budget defense fails most often on attribution, not performance. A 2026 B2B events report finds 86% of teams cannot accurately attribute closed-won revenue back to events, because event influence shows up in the pipeline earlier than most CRMs give it credit for. The trend line is improving: Bizzabo reports the share of organizers calling ROI proof difficult falling from 70% in 2025 to 40% in 2026, tracking with wider adoption of return-on-event-investment math.
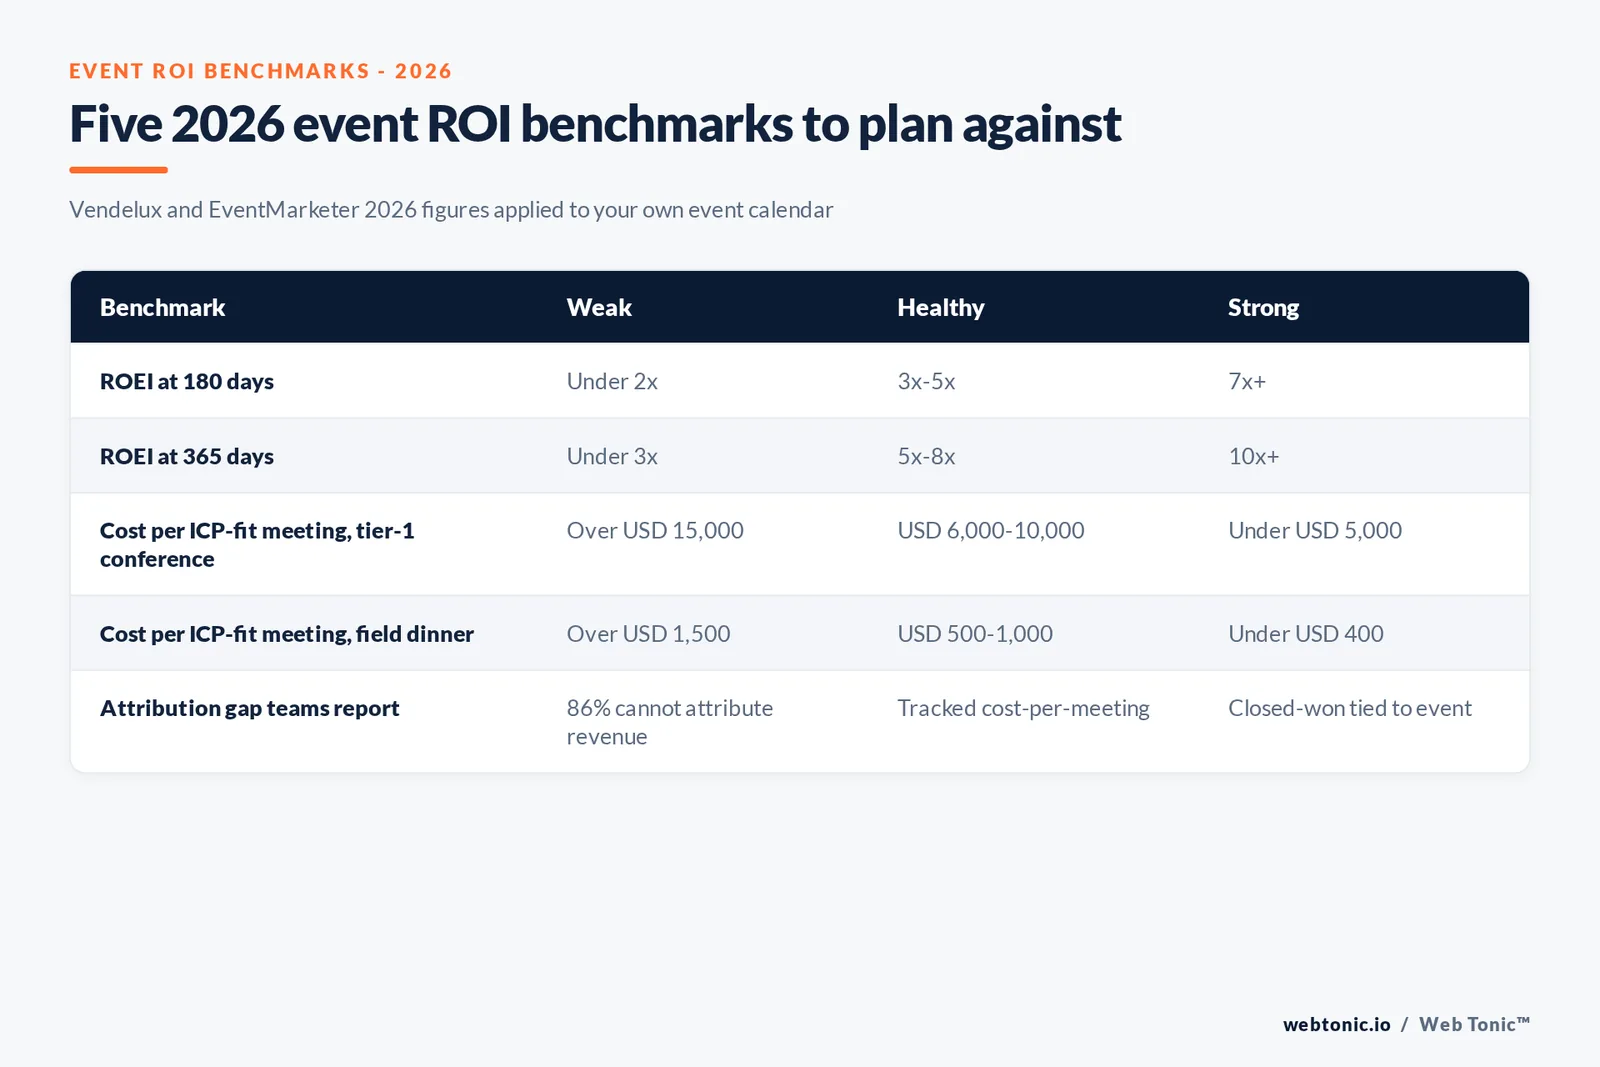
Vendelux's 2026 ROI benchmarks frame the healthy range as 3x to 5x ROEI at 180 days, rising to 5x to 8x at 365 days as delayed deals close, with 7x-plus and 10x-plus respectively marking strong performance. The leading indicator underneath both numbers is cost per ICP-fit meeting - Vendelux flags a tier-one conference cost above USD 15,000 per qualified meeting as a red flag against a USD 6,000-10,000 healthy band.
| ROI benchmark (2026) | Weak | Healthy | Strong | Source |
|---|---|---|---|---|
| ROEI at 180 days | Under 2x | 3x-5x | 7x+ | Vendelux 2026 |
| ROEI at 365 days | Under 3x | 5x-8x | 10x+ | Vendelux 2026 |
| Cost per ICP-fit meeting, tier-1 conference | Over USD 15,000 | USD 6,000-10,000 | Under USD 5,000 | Vendelux 2026 |
| Cost per ICP-fit meeting, field dinner | Over USD 1,500 | USD 500-1,000 | Under USD 400 | Vendelux 2026 |
| Teams who cannot attribute revenue to events | - | 86% report this gap | - | 2026 B2B Events Report |
Same ROI, different confidence
EventMarketer's EVENTTRACK 2026 study reports 66% of marketers getting the same ROI year over year and 32% reporting an increase - a market that is, on the whole, holding its ground rather than accelerating. Lead generation remains the top-ranked metric for the channel, cited as most important by roughly half of the surveyed industry, down slightly from 59% a year earlier as sales-lift and direct-sales metrics gain ground.
Exhibit spending itself is forecast up year over year among 82% of trade show brand marketers, which combined with the flat-ROI data suggests teams are betting on scale and presence to hold performance steady rather than expecting a step-change in returns.
| EVENTTRACK 2026 metric | Figure | Direction |
|---|---|---|
| Marketers reporting the same ROI | 66% | Stable |
| Marketers reporting increased ROI | 32% | Improving |
| Trade show brand marketers increasing exhibit spend | 82% | Growing |
| Fortune 1000 brands planning the same event count | 52%, up 23 points | Consolidating |
| Industry citing lead generation as top metric | ~50%, down from 59% | Diversifying toward sales metrics |
Why the spend keeps justifying itself at the macro level
The category the budget sits inside is large and growing. The Events Industry Council's 2026 Global Economic Significance of Business Events Study puts business events at USD 3.1 trillion in total business sales in 2025, contributing USD 1.8 trillion to global GDP and supporting 24.2 million jobs worldwide. That macro backdrop is part of why finance teams keep approving event budgets even while asking for tighter attribution - the category's economic weight is not in dispute, even when a single campaign's ROI is.
| Global business events impact (2025 data, 2026 report) | Figure | Source |
|---|---|---|
| Total business sales generated | USD 3.1 trillion | Events Industry Council |
| Contribution to global GDP | USD 1.8 trillion | Events Industry Council |
| Jobs supported worldwide | 24.2 million | Events Industry Council |
| Trade show brand marketers increasing exhibit spend | 82% | EventMarketer EVENTTRACK 2026 |
Planning implications for 2026
- Budget the channel first, then the event. With 31.6% of the marketing budget already committed to events on average, treat the annual event calendar as a portfolio with its own allocation rules rather than approving each event as a one-off request.
- Match team size to system complexity, not to ambition. A 1-3 person team managing 30%+ of the budget needs templated budget models and standardized run-of-show documents before it needs a bigger events calendar.
- Report cost per ICP-fit meeting, not just registrations. Vendelux's benchmark gives finance a number they can compare across event types, which shortens the ROI conversation.
- Separate the flagship event budget from the field-event budget. The ROEI and cost-per-meeting benchmarks differ by roughly 10x between a tier-one conference and a field dinner, so a blended average hides where the money is actually working.
- Plan for a flat-to-growing budget, not a windfall. The 40/40/20 growth/flat/cut split from Bizzabo is a more realistic planning assumption than Cvent's more bullish 82% figure, which skews toward teams already committed to an event-led growth motion.
Where this fits your broader channel mix
Events rarely work in isolation from paid acquisition - most B2B pipelines nurture event leads through the same channels that generated the registration in the first place. If your team is weighing event spend against paid search, our breakdown of what Google Ads actually costs in 2026 is a useful comparison point, and our growth marketing practice builds the channel mix models that decide where the next incremental dollar goes. When you are ready to plan next year's calendar against real numbers, talk to us.
Frequently Asked Questions
What share of the marketing budget should go to events?
Forrester's 2026 State of B2B Events survey finds close to half of teams putting more than 30% of their program budget into events, and CEIR's 2026 Marketing Spend Decision Report puts exhibition spend at 40.8% of B2B exhibitor marketing budgets - the single largest line. There is no universal target: software and high-ACV B2B SaaS teams run 25-35%, while lower-ACV and manufacturing segments allocate less. Anchor the number to your deal size and channel mix, not to an industry average.
Are event budgets growing or shrinking in 2026?
Both, depending on who you ask. Bizzabo's 2026 benchmarks report 40% of organizers expecting budget growth, 40% expecting it to hold flat and 20% expecting a cut. Forrester's Q1 2026 survey found 37% of organizations increased event budgets year over year while 31% cut them. Cvent's 2026 Event-Led Growth Report is more bullish, with 82% of marketers expecting their total marketing budget to rise over the year. Read the spread as evidence that events are being fought for line by line, not funded automatically.
Why is event ROI still hard to prove?
Attribution, not performance. A HubSpot-hosted 2026 B2B events report found 86% of teams cannot accurately attribute revenue back to events, because events influence pipeline earlier than the CRM gives them credit for. The good news is direction: Bizzabo reports the share of organizers calling ROI proof difficult fell from 70% in 2025 to 40% in 2026, which tracks with wider adoption of the return-on-event-investment math Vendelux and EventMarketer both now publish benchmarks for.
How big should an event team be for the budget it manages?
Small, more often than planners assume. Bizzabo's 2026 data finds 45% of event teams operating with just one to three people, which is one reason scalable systems and templated workflows show up repeatedly in the planning guidance below. A three-person team managing 30%+ of the marketing budget cannot run every event as a bespoke build.
What is a realistic event marketing ROI target?
Vendelux's 2026 benchmarks frame it as return on event investment (ROEI): under 2x at 180 days is weak, 3x-5x is healthy, and 7x or higher is strong performance, extending to 5x-8x and 10x-plus at the 365-day mark as delayed deals close. Cost per ICP-fit meeting is the leading indicator underneath that number - Vendelux puts a tier-one conference meeting above USD 15,000 as a red flag against a USD 6,000-10,000 healthy range.
Sources
Forrester - The State of Event Budget Allocation in B2B Marketing Programs, 2026
CEIR - 2026 Marketing Spend Decision Report (via IAEE)
Bizzabo - 2026 Event Marketing Statistics, Trends and Benchmarks
Cvent - 2026 Event-Led Growth Report
Vendelux - How to Measure Event Marketing ROI in 2026
EventMarketer - EVENTTRACK 2026
2026 B2B Events Report - Events Are in the Hot Seat
Freeman - 2026 Trends Report: What's Keeping Audiences Away
Events Industry Council - 2026 Global Economic Significance of Business Events Study