Table of contents
Electrical contractors who track marketing performance through dashboards close more jobs and waste less budget — yet 73% of home service owners review their numbers only monthly or less (WebFX, 2026). This gap between data-available and data-used is where most ad dollars go to die. Below are the statistics that quantify dashboard adoption, KPI tracking, and reporting ROI for the electrical services industry in 2026.
Key Takeaways
- 41% of contractors have no single source of truth for cost per lead by channel (WebFX, 2026).
- Only 38% of SMBs measure marketing ROI with any formal attribution model (Stealth Agents / CMO Survey, 2026).
- 44% of small businesses struggle to measure marketing ROI at all (DesignLoud, 2026).
- Contractors tracking cost per closed job (not CPL) see 5:1 to 20:1 ROAS across channels (Web Tonic, 2026).
- A healthy contractor dashboard tracks 7 core KPIs: CPL, CAC, CLV, conversion rate, ad spend pacing, revenue attribution, and booked jobs (PipelineOn, 2026).
- 51% of US small businesses still manage customer relationships with spreadsheets or email (CustomerFlows / Capterra, 2026).
- Lead response time under 5 minutes increases contact rates by 21× (Elev8 Operations, 2026).
Analytics Adoption & Analytics Tracking in Electrical Services
The home services industry lags behind other home service trades in analytics maturity. While 70% of home service contractors track impressions, clicks, and sessions, fewer than 25% track cost per acquired customer or CLV:CAC ratio (PipelineOn, 2026). This creates a dangerous blind spot: contractors know how many people clicked but not how many became profitable customers.
| Metric | Adoption Rate | Source |
|---|---|---|
| Track impressions, clicks & sessions | 70% | PipelineOn / WebFX 2026 |
| Track CPL by channel | 59% | WebFX 2026 |
| Single source of truth for CPL | 59% (41% lack one) | WebFX 2026 |
| Track CAC or CLV:CAC | <25% | PipelineOn 2026 |
| Use formal attribution model | 38% | Stealth Agents 2026 |
| CRM adoption (SMB) | 49% | CustomerFlows / Capterra 2026 |
| Spreadsheet/email-only CRM | 51% | CustomerFlows / Capterra 2026 |
| Struggle to measure ROI | 44% | DesignLoud 2026 |

The 51% of small businesses still relying on spreadsheets for customer management face a compounding problem: without structured data, building an accurate marketing dashboard becomes nearly impossible. Investing in a proper CRM is the prerequisite to meaningful reporting.
The 7 Core KPIs Every Electrical Contractor Dashboard Should Track
According to PipelineOn's 2026 contractor dashboard framework, a healthy marketing dashboard tracks exactly seven KPIs. Each metric answers a different question about marketing health:
| KPI | What It Answers | Electrical Benchmark |
|---|---|---|
| CPL by Channel | Which channels produce the cheapest leads? | $39 LSA · $93.69 Google Ads |
| CAC by Channel | What does a paying customer actually cost? | $150–$280 per booked job (LSA) |
| CLV by Customer Type | Which customer segments are most valuable? | $2,500–$6,000 avg ticket |
| Conversion Rate by Funnel Stage | Where are leads dropping off? | 43.4% LSA book rate |
| Ad Spend Pacing | Are we on track or overspending? | 5–10% of gross revenue |
| Revenue Attribution by Source | Which channel drives real revenue? | 8.5× LSA closed ROAS |
| Booked Jobs by Day-of-Week | When does demand peak? | Mon–Fri peaks vary by region |
Fewer than 25% of contractors track beyond the first two KPIs. Those who do gain a structural advantage: they can reallocate budget from channels that produce cheap leads but poor close rates to channels that produce profitable jobs — a distinction invisible without dashboard-level tracking.
Cost Per Lead Benchmarks Across Channels for Electricians
Dashboard utility depends on having benchmarks to compare against. The BaaDigi 2026 electrical benchmark report compiled data from SearchLight, LocaliQ, and WebFX across hundreds of accounts:
| Channel | Avg CPL | Conversion Rate | Closed ROAS |
|---|---|---|---|
| Local Services Ads | $39 | 43.4% book rate | 8.5× |
| Google Search Ads | $93.69 | 9.08% | 3–5× |
| Meta Ads | $28–$53 | ~10% | 5–8× (top quartile) |
| HomeAdvisor / Angi | $55–$200 | Varies | 2–4× |
| SEO (organic) | $0 (content cost only) | Highest long-term | 10×+ |
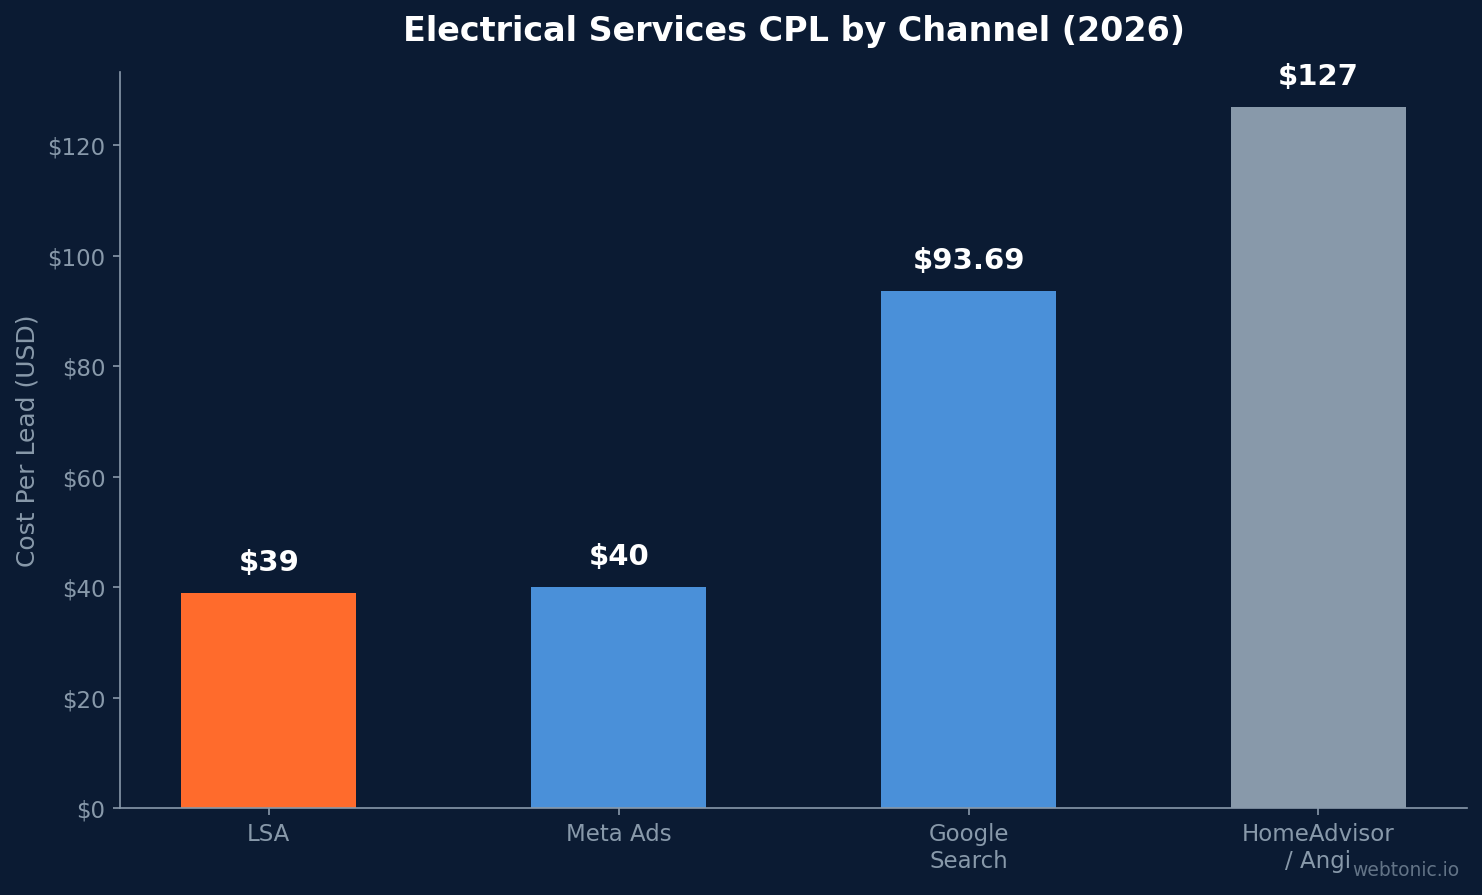
Dashboards that display these side by side — with cost per closed job, not just cost per lead — reveal that LSA dominates on efficiency while Google Search Ads carry higher CPLs but often deliver larger-ticket jobs. Without a dashboard view, contractors tend to chase the cheapest lead rather than the most profitable customer.
ROI Measurement & Attribution Challenges
Measuring marketing ROI remains the top challenge for small businesses, with 44% admitting they cannot clearly tie spend to revenue (DesignLoud, 2026). The problem is especially acute in trades where jobs often begin with a phone call, not an online form:
- Only 38% of SMBs use any formal attribution model — the majority cannot defend or optimize their spend (Stealth Agents, 2026).
- 52% of businesses use marketing attribution reporting of some kind, but depth varies widely (LocaliQ, 2026).
- Call tracking adoption in home services sits around 55–65% — meaning a third of contractors have no idea which ad drove the phone to ring (CallRail data via PipelineOn, 2026).
- Contractors who miss 18 leads per month at $74 per lead waste over $15,000 annually on unanswered opportunities (CoreiBytes, 2026).
The solution most dashboard platforms now offer is closed-loop reporting — connecting ad spend to booked jobs, completed work, and collected revenue. Contractors using this approach see 5:1 to 20:1 ROAS because they can identify and double down on channels that produce profitable work, not just leads.
Dashboard & Reporting Tool Costs for Electrical Contractors
Marketing dashboards range from free (Google Looker Studio) to enterprise-grade platforms costing $2,000+ per month. Here is what electrical contractors typically pay:
| Tool Category | Monthly Cost | Key Feature |
|---|---|---|
| Google Looker Studio | Free | Custom dashboards, Google Ads/GA4 integration |
| Call Tracking (CallRail) | $55–$215/mo | Dynamic number insertion, call attribution |
| CRM + Dashboard (ServiceTitan) | $500–$2,000/mo | Full-stack: dispatch, invoicing, marketing ROI |
| Agency Analytics Platform | $150–$500/mo | Multi-channel reporting, client dashboards |
| Custom BI (Power BI / Tableau) | $10–$70/user/mo | Advanced modeling, cross-source blending |
The critical insight: the cost of not tracking dwarfs the cost of any analytics platform. An electrical contractor spending $5,000/month on ads without attribution is effectively flying blind — a $215/month call tracking investment that reveals which half of the budget is wasted pays for itself in the first week.
Platform selection should match business stage. A solo electrician running $500/month in LSA needs nothing more than CallRail plus Google Looker Studio. A multi-truck operation spending $5,000+ per month across Google, Meta, and LSA needs a CRM-integrated platform that tracks leads through to invoiced revenue. Over-investing in tooling is as wasteful as under-investing — the goal is attribution coverage proportional to ad spend.
Impact of Data-Driven Marketing on Electrical Services Revenue
Contractors who adopt data-driven marketing consistently outperform those relying on gut instinct. The data supports aggressive measurement investment:
- Lead response under 5 minutes increases contact rate by 21× — dashboards with real-time alerts make this operationally possible (Elev8 Operations, 2026).
- Top-performing contractors spend 7–10% of revenue on marketing vs. the 5–10% average, but only because they can prove ROI for each incremental dollar (Elev8 Operations, 2026).
- 40–50% of estimates are never followed up — CRM dashboards that automate follow-up at 24h, 72h, and 7 days recover a significant share of these lost opportunities (JuicyGoosey CRM, 2026).
- AI-powered home service platforms see 51% adoption among mid-tier companies, enabling predictive scheduling and automated lead scoring (Gitnux, 2026).
- 61% of home service businesses use real-time service tracking and 54% use automated scheduling — both of which feed into performance reporting systems (Leads4Build, 2026).
Reporting Best Practices for Electrical Service Marketers
- Track cost per closed job, not cost per lead. A $39 LSA lead that books at 43.4% costs ~$90 per booked job. A $93.69 Google Search lead that books at 25% costs ~$375. The reporting view must show this difference clearly.
- Implement call tracking on every marketing channel. With 55–65% adoption, you gain an immediate edge over competitors still guessing which ads drive calls.
- Set up real-time lead alerts. The 21× contact rate improvement from sub-5-minute response times requires automated notifications, not morning inbox reviews.
- Review dashboards weekly, not monthly. The 73% of contractors reviewing monthly miss trend changes that compound into wasted budget over 4+ weeks.
- Benchmark against industry data. Without comparison points ($39 LSA CPL, $93.69 Search CPL, 43.4% book rate), raw numbers lack context. Build benchmark rows into every dashboard view.
- Connect marketing data to revenue. Close the loop between ad click and collected payment. Only full-funnel visibility reveals true channel ROI.
Electrical Services vs. Other Trades: Analytics Maturity Comparison
How does the electrical industry compare to peer trades in marketing analytics adoption?
| Trade | Dashboard Adoption | Call Tracking Rate | Attribution Model Use |
|---|---|---|---|
| Electrical | Low–Moderate | ~60% | ~35% |
| HVAC | Moderate–High | ~70% | ~45% |
| Plumbing | Moderate | ~65% | ~40% |
| Roofing | Low–Moderate | ~55% | ~30% |
| Landscaping | Low | ~40% | ~20% |
The trade occupies a middle position — ahead of landscaping and roofing but behind HVAC, which benefits from higher average tickets that justify larger analytics investments. The relatively low barrier to entry (call tracking starts at $55/month) makes rapid improvement feasible for any electrical contractor willing to invest in data intelligence.
Common Reporting Mistakes in Electrical Services Marketing
Even contractors who invest in dashboards often undermine their value through these patterns:
- Tracking leads instead of booked jobs. A channel with a $39 CPL and 43% book rate produces booked work at ~$90 per job. A channel with a $28 CPL and 15% book rate costs ~$187 per job. Without book-rate visibility, the cheaper-looking channel wins budget it should not receive.
- Ignoring offline conversions. An contractor receiving 60% of leads by phone call needs call tracking to close the attribution loop. A reporting setup missing call data undervalues every channel that drives phone calls — typically the highest-intent leads.
- Monthly review cadence instead of weekly. The 73% of contractors reviewing monthly miss the compounding effect of a broken landing page, an expired ad, or a budget cap hit mid-month. Weekly 15-minute analytics reviews catch issues before they become expensive.
- No benchmark context. Raw numbers mean nothing without comparison. A $93.69 Google Ads CPL looks expensive in isolation but sits exactly at the industry benchmark for electricians — the reporting interface should display both actual and benchmark values.
Frequently Asked Questions
What KPIs should an electrical contractor dashboard track?
A complete electrical services marketing dashboard tracks seven core KPIs: cost per lead by channel, customer acquisition cost, customer lifetime value, conversion rate by funnel stage, ad spend pacing against budget, revenue attribution by source, and booked jobs by day-of-week. Focusing only on vanity metrics like impressions or clicks misses the connection between marketing spend and actual revenue.
How much does a reporting tool cost for electricians?
Marketing dashboard costs range from free (Google Looker Studio) to $500–$2,000 per month for full-stack platforms like ServiceTitan. Most electrical contractors start with call tracking ($55–$215/month via CallRail) and a free reporting tool, then upgrade to a CRM-integrated platform as their marketing budget grows beyond $3,000 per month.
Why do most contractors struggle with marketing ROI measurement?
Three factors drive the measurement gap: 44% of small businesses cannot tie spend to revenue (DesignLoud, 2026), 51% still use spreadsheets instead of a CRM (Capterra), and phone calls — the primary lead channel for electricians — are harder to attribute than online form fills. Call tracking and closed-loop CRM reporting solve the technical problem; the organizational challenge is reviewing data weekly rather than monthly.
What is a good marketing spend benchmark for electrical contractors?
Industry data shows 5–10% of gross revenue as the standard marketing spend for electrical contractors, with top performers investing 7–10%. Below 5% typically signals under-investment; above 12% sustained may indicate broken unit economics. The key is not the percentage but the ability to measure return — contractors with dashboards can justify higher spend because they prove ROI channel by channel.
How does call tracking improve electrical services marketing?
Call tracking assigns unique phone numbers to each marketing channel, revealing which ads, keywords, and landing pages generate phone calls. With 55–65% of home service contractors now using call tracking, it has become table stakes for competitiveness. The main benefit is attribution: knowing that a specific Google Ads campaign drove a $6,000 panel upgrade job justifies continued investment in a way that click-level data cannot.
Sources
https://pipelineon.com/blog/contractor-marketing-dashboard/
https://pipelineon.com/blog/contractor-marketing-kpi/
https://www.baadigi.com/tools/benchmarks/electrical
https://www.elev8operations.com/guides/contractor-marketing-statistics-2026
https://customerflows.com/resources/home-service-business-statistics/
https://designloud.com/state-of-small-business-marketing-2026/
https://stealthagents.com/research/smb-marketing-budget-statistics-2026
https://blog.coreibytes.com/blog/electrical-leads-contractors-lose-half-90-seconds-lead-capture
https://gitnux.org/ai-in-the-home-service-industry-statistics/
https://journela.com/contractor-marketing-statistics-2026/