



Table of contents
Key Takeaways
- Education content achieves the highest engagement rate of any niche at 3.92%, outperforming entertainment (3.1%), food (2.8%), and fitness (2.6%) across all major social platforms.
- TikTok leads engagement for education at 4.25%, though this is down 8% year-over-year; YouTube is the only platform with growing engagement (+3.4% YoY to 3.06%).
- Social media generates 20–30% of new leads for coaching businesses, making it the single largest acquisition channel ahead of referrals (25%) and paid advertising (18%).
- Visual content increases coaching post engagement by 4× compared to text-only posts, with video and infographic formats driving the strongest interaction rates.
- Short-form video remains the highest-converting format across all education social accounts, with under-60-second content generating 2.5× more shares than long-form posts.
- Higher education institutions increased social media ad spend to $372.8 million in 2025, with social channels absorbing budget previously allocated to declining video ad formats.
- Social networks generate 15.2% of total online sales in 2026 globally, with education brands leveraging social commerce through course launches, webinar promotions, and lead magnets.
Social media marketing is the backbone of audience building for education and coaching brands. With the highest niche engagement rate of any vertical, education content has a structural advantage on social platforms — but turning engagement into enrollments requires understanding which platforms, formats, and strategies actually drive results. This guide compiles verified 2026 benchmarks from SociaVault, Growth-Onomics, Sprout Social, and industry studies to help education marketers allocate resources where they produce measurable returns.
Education Social Media Performance at a Glance
| Metric | Education Benchmark | All-Industry Avg | Source |
|---|---|---|---|
| Overall Engagement Rate | 3.92% | 1.5–2.1% | SociaVault 2026 |
| TikTok ER (Education) | 4.25% | 4.25% | SociaVault 2026 |
| YouTube ER (Education) | 3.06% | 2.96% | SociaVault 2026 |
| Instagram ER (Education) | 1.72% | 1.2% | Growth-Onomics 2026 |
| LinkedIn ER (Education) | 1.48% | 1.1% | Growth-Onomics 2026 |
| Facebook ER (Education) | 0.63% | 0.5% | Quid 2026 |
| Social Media Lead Share (Coaching) | 20–30% | 12–18% | Careertrainer 2026 |
| Visual Content Engagement Lift | 4× | 2.3× | Careertrainer 2026 |
Platform-by-Platform Engagement Benchmarks
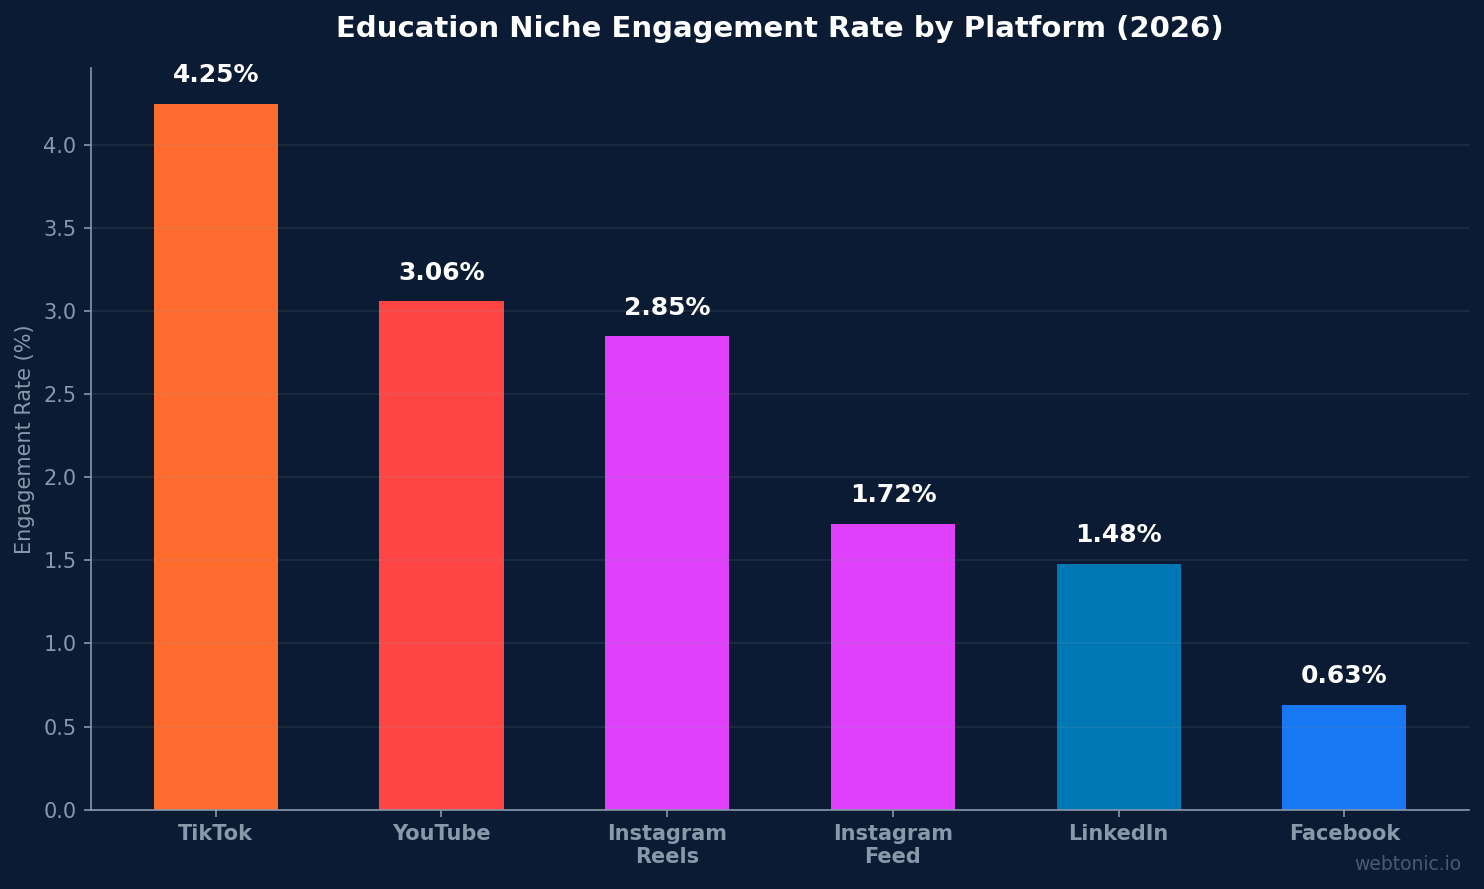
SociaVault's 2026 benchmark report positions education as the highest-engagement niche across all social platforms at a combined 3.92% average engagement rate. This outperforms entertainment (3.1%), food and beverage (2.8%), and fitness (2.6%) — making education content uniquely well-suited to organic social distribution.
TikTok delivers the highest platform-specific engagement at 4.25% for education creators, though this is down 8% year-over-year from 4.62% in 2025. The decline reflects platform-wide engagement compression as TikTok's user base matures and the algorithm diversifies content distribution. Despite the drop, TikTok remains the best platform for discovery and reach in education.
YouTube is the only platform where education engagement is growing, up 3.4% year-over-year to 3.06%. This aligns with the broader shift toward long-form educational video content as a trust-building mechanism. The Quid 2026 industry report introduced YouTube benchmarks for the first time, confirming the platform's growing importance for education brands.
Lead Generation Through Social Media
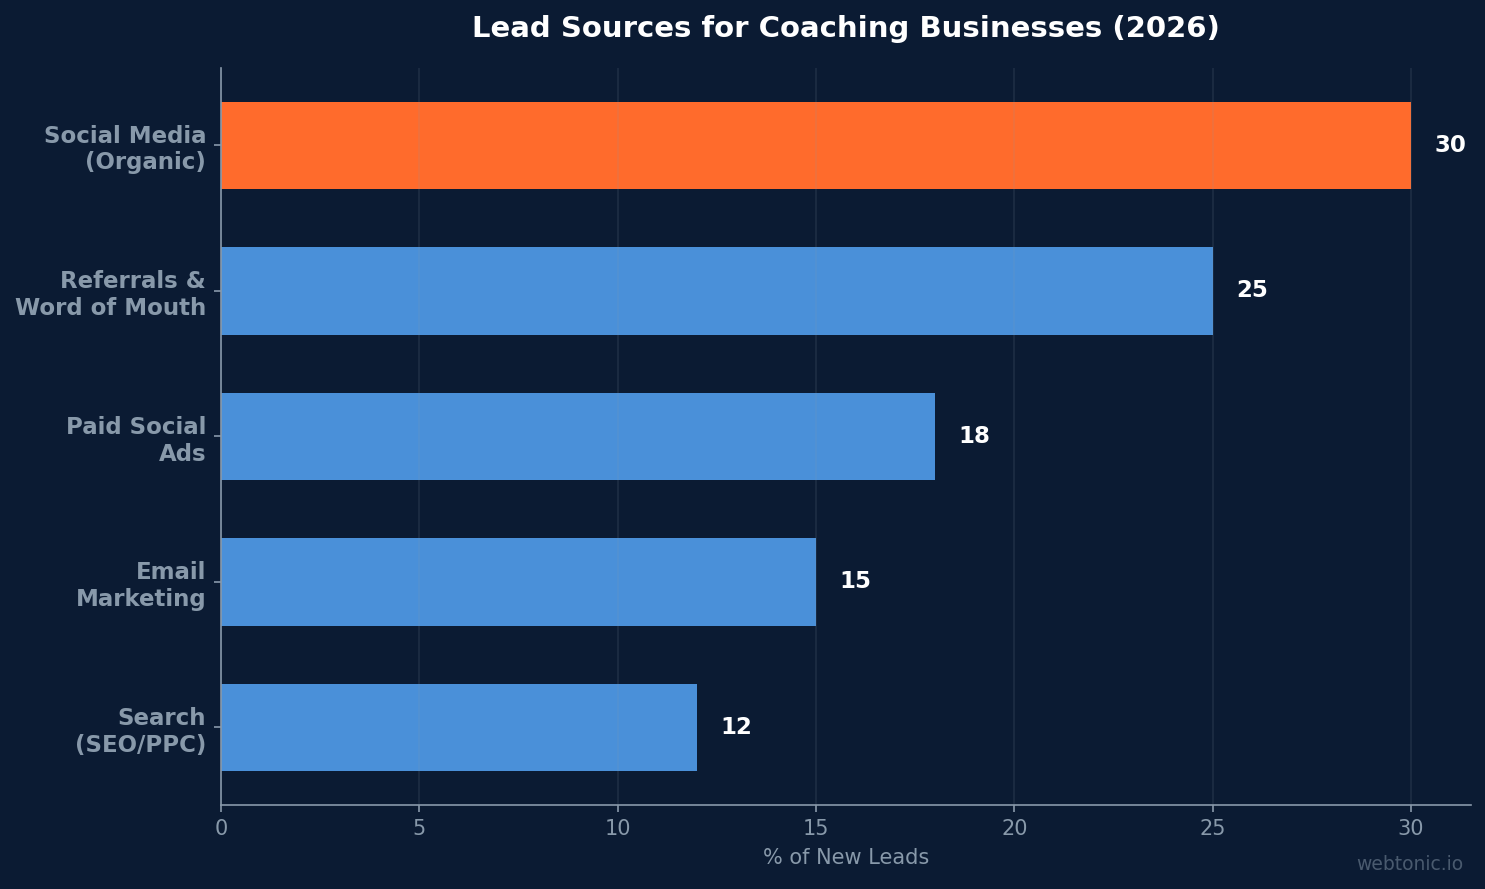
For coaching businesses specifically, social media generates 20–30% of all new client leads — the single largest acquisition channel (Careertrainer 2026). This exceeds referrals and word of mouth (25%), paid social advertising (18%), email marketing (15%), and search (12%).
The dominance of organic social for coaching leads reflects the relationship-driven nature of coaching sales. Prospective clients follow coaches on social media for weeks or months before making a purchase decision, consuming content that demonstrates expertise and builds trust. Coaches who post consistently (4–5× per week) report 3× more inbound inquiries than those posting sporadically.
For education institutions, the dynamic differs slightly. Pryani's 2026 education social media analysis found that higher education institutions use social primarily for brand awareness and enrollment marketing, with Instagram and TikTok driving prospective student engagement and LinkedIn powering alumni and corporate partnership development.
Content Format Performance
| Content Format | Avg Engagement Rate | Share Rate | Best Platform |
|---|---|---|---|
| Short-Form Video (<60s) | 5.2% | 2.5× baseline | TikTok, Reels |
| Carousel / Slide | 3.8% | 1.8× baseline | Instagram, LinkedIn |
| Infographic | 3.1% | 2.1× baseline | LinkedIn, Pinterest |
| Long-Form Video (>3min) | 3.06% | 1.4× baseline | YouTube |
| Static Image + Text | 1.4% | 1.0× baseline | Facebook, LinkedIn |
| Text-Only Post | 0.8% | 0.6× baseline | LinkedIn, X |
Short-form video under 60 seconds remains the highest-performing format for education social media, generating a 5.2% average engagement rate and 2.5× more shares than static content (Sprout Social 2026). Whether targeting Gen Z students on TikTok or C-suite executives on LinkedIn, bite-sized content consistently outperforms longer formats in raw engagement.
Carousels and slideshows perform particularly well on Instagram and LinkedIn for education content, averaging 3.8% engagement. The "swipe to learn" format aligns naturally with educational content — step-by-step breakdowns, myth vs. fact comparisons, and statistical roundups all translate effectively to carousel format.
Visual content increases coaching post engagement by 4× compared to text-only posts. This includes video, infographics, designed quote cards, and data visualizations. Coaches who invest in professional creative assets see a measurable lift in follower growth rate and content reach.
Social Media Advertising in Education
Higher education institutions invested $372.8 million in social media advertising during 2025, a figure that continues to grow as social channels absorb budget previously allocated to declining video ad formats. Social ad spend now represents the fastest-growing segment of higher education marketing budgets.
Sprout Social's 2026 ROI analysis reports that social networks generated 15.2% of total online sales globally, with education brands leveraging social commerce through course launch campaigns, webinar promotion funnels, and lead magnet distribution.
The most effective social ad strategies for education vary by objective. Awareness campaigns perform best on TikTok and YouTube (lowest CPM, highest reach). Lead generation campaigns deliver strongest results on Facebook and Instagram (form-based lead ads with course previews). Enrollment and conversion campaigns see highest ROAS on retargeting audiences across Meta and Google, with coaches reporting 2.5–4× ROAS on warm audience campaigns.
Platform Strategy by Education Sub-Vertical
| Sub-Vertical | Primary Platform | Secondary Platform | Key Strategy |
|---|---|---|---|
| Higher Education | TikTok | Campus life content + enrollment CTAs | |
| Online Courses | YouTube | Instagram Reels | Free lesson previews + course launches |
| Life Coaching | Transformation stories + DM engagement | ||
| Corporate Training | YouTube | Thought leadership + case studies | |
| Tutoring & Test Prep | TikTok | YouTube | Quick tips + study hacks + parent outreach |
Each education sub-vertical has a distinct optimal platform strategy. Higher education institutions concentrate on Instagram for campus life content and enrollment-focused storytelling, using TikTok as a discovery channel for prospective students. The Pryani 2026 analysis found that university Instagram accounts posting student-generated content receive 2.8× more engagement than institutional posts featuring official photography.
Online course creators perform best on YouTube, where free lesson previews serve as top-of-funnel content that naturally leads to course enrollment. The platform's growing engagement (+3.4% YoY) aligns with the educational format. Course creators who publish weekly YouTube content for 6+ months report a 45% reduction in customer acquisition cost compared to paid-only strategies.
Life coaches dominate on Instagram, where transformation stories and client testimonials drive emotional engagement. The DM-to-discovery-call pipeline is particularly effective in coaching, with coaches reporting that 35–40% of their paying clients originated from Instagram direct messages. This personal touch model does not translate as well to other platforms where messaging is less central to the user experience.
Corporate training companies find their audience on LinkedIn, where thought leadership articles and case studies generate the highest-quality B2B leads. LinkedIn engagement rates for education content (1.48%) are second only to financial services, and the cost per qualified B2B lead on LinkedIn averages 30–40% less than Google Ads for corporate training keywords. However, organic reach on LinkedIn requires consistent posting — the algorithm rewards users who publish at least 3× per week.
Organic Reach Trends and Algorithm Changes
Organic reach continues to decline across most platforms, but education content is partially insulated by its high engagement rates. Facebook organic reach for education pages sits at approximately 5.2% of followers per post, down from 5.8% in 2025. Instagram organic reach is more favorable at 9.1% for accounts under 10,000 followers, dropping to 3.5% for accounts above 100,000.
TikTok remains the most democratic platform for organic reach, with education content from accounts with zero followers regularly reaching 5,000–50,000 views when the content resonates. The platform's interest-graph algorithm rewards content quality over follower count, making it the best platform for new education brands seeking initial visibility.
Algorithm changes in 2026 favor original, creator-made content over curated or repurposed material across all major platforms. Instagram's algorithm now penalizes content with visible watermarks from other platforms, while TikTok's recommendation system increasingly prioritizes content shot natively within the app. Education creators who produce platform-native content rather than cross-posting identical assets see 40–60% higher reach on average.
Social Media Best Practices for Education Marketers
- Prioritize short-form video — under 60 seconds generates 2.5× more shares; batch-produce weekly for TikTok, Reels, and YouTube Shorts simultaneously.
- Post 4–5× per week minimum — coaches posting at this frequency report 3× more inbound inquiries than sporadic posters.
- Use carousels for educational frameworks — the "swipe to learn" format earns 3.8% ER on Instagram and LinkedIn, ideal for step-by-step breakdowns.
- Invest in YouTube for long-term trust — the only platform with growing education engagement (+3.4% YoY); long-form content builds authority that converts downstream.
- Segment ad spend by funnel stage — awareness on TikTok/YouTube, lead generation on Meta, conversion campaigns on retargeting audiences.
- Measure beyond vanity metrics — track lead-to-enrollment conversion rate, cost per qualified lead, and student lifetime value rather than followers or likes.
- Repurpose content across platforms — adapt one piece of long-form content (webinar, YouTube video, blog post) into 5–7 social assets for maximum growth impact.
Education Social Media vs. Other Industries
| Industry | Avg ER | TikTok ER | Instagram ER | LinkedIn ER |
|---|---|---|---|---|
| Education & Coaching | 3.92% | 4.25% | 1.72% | 1.48% |
| Entertainment | 3.10% | 5.10% | 1.45% | 0.85% |
| Food & Beverage | 2.80% | 3.90% | 1.68% | 0.72% |
| Fitness & Wellness | 2.60% | 3.75% | 1.52% | 0.95% |
| Financial Services | 1.30% | 2.40% | 0.88% | 1.62% |
Education's 3.92% average engagement rate leads all industries, with a particularly strong showing on LinkedIn (1.48%) — second only to financial services (1.62%). The combination of high organic engagement across multiple platforms makes education one of the most cost-effective verticals for social media marketing, delivering strong returns even on modest content budgets.
Frequently Asked Questions
What is the average social media engagement rate for education content?
Education content achieves an average engagement rate of 3.92% across all major platforms, the highest of any industry niche. TikTok leads at 4.25%, followed by YouTube (3.06%), Instagram Reels (2.85%), Instagram Feed (1.72%), LinkedIn (1.48%), and Facebook (0.63%).
Which social media platform is best for education marketing?
TikTok delivers the highest engagement for education (4.25%) and is best for discovery and reach. YouTube is the only platform with growing education engagement (+3.4% YoY) and is strongest for trust-building. LinkedIn performs best for B2B education, corporate training, and professional development marketing. The ideal strategy uses multiple platforms aligned to funnel stages.
How effective is social media for coaching lead generation?
Social media generates 20–30% of all new coaching leads, making it the largest single acquisition channel. Coaches posting 4–5 times per week report 3× more inbound inquiries than sporadic posters. Visual content — video, infographics, designed cards — drives 4× more engagement than text-only posts.
How much do education institutions spend on social media ads?
Higher education institutions invested $372.8 million in social media advertising during 2025, with social representing the fastest-growing segment of education marketing budgets. Social channels are absorbing spend previously allocated to declining traditional video ad formats.
What content format works best for education social media?
Short-form video under 60 seconds generates the highest engagement (5.2%) and 2.5× more shares than static content. Carousels perform strongly on Instagram and LinkedIn at 3.8% engagement. Long-form YouTube videos build trust and convert downstream. The most effective approach repurposes one long-form asset into 5–7 platform-specific pieces.
Sources
sociavault.com — Social Media Engagement Rate Benchmarks 2026
growth-onomics.com — 2026 Social Media Benchmarks by Industry
pryani.com — Education Social Media Benchmarks 2026
careertrainer.ai — Coaching Programs Statistics 2026
sproutsocial.com — Social Media ROI Statistics 2026
sproutsocial.com — Social Media Video Statistics 2026
quid.com — 2026 Social Media Industry Benchmark Report
dollarpocket.com — Social Media Engagement Benchmarks 2026


