



Table of contents
Google Ads captures 40–45% of total e-commerce paid media budgets — the single largest channel allocation for online retailers. With a median 4.2× ROAS across Search, Shopping, and Performance Max campaigns, the platform remains the primary revenue engine for data-driven e-commerce brands in 2026.
This report compiles 80+ verified Google Ads statistics from COREPPC (500+ Shopify and DTC accounts), industry benchmark studies, and platform data to reveal what competitive performance looks like across campaign types, verticals, and budget tiers.
Key Takeaways
- The average e-commerce Google Ads CPC is $1.42 on Search, $0.68 on Shopping, and $0.82 on Performance Max, with the overall blended ROAS at 4.2× (COREPPC, 2026).
- Shopping campaigns deliver the highest ROAS at 5.1× because shoppers have already seen the product, price, and image before clicking — the most intent-qualified traffic in the Google ecosystem (COREPPC, 2026).
- Performance Max now commands the majority of Shopping-eligible spend, with a 4.8× ROAS and $0.82 CPC, blending multiple channels into a single campaign structure (COREPPC, 2026).
- Conversion rates range from 0.9% (25th percentile) to 4.5% (75th percentile) on Search, with the average at 2.8% — a spread that shows campaign optimization matters more than industry benchmarks (COREPPC, 2026).
- Product feed optimization is the most underworked lever in e-commerce Google Ads, with product titles carrying approximately 70% of PMax's matching signal (ZenoX, 2026).
- Health & Beauty CPCs rose 11% YoY, the steepest increase of any vertical, while Fashion & Apparel saw just 3% — reflecting competitive pressure in high-margin categories (COREPPC, 2026).
- Electronics & Tech has the highest search CPC ($1.85) but lowest ROAS (3.1×), requiring breakeven ROAS of 2.5–4.0× due to thin margins — making feed quality and bidding precision critical (COREPPC, 2026).
| Metric | Search | Shopping | Performance Max |
|---|---|---|---|
| Average CPC | $1.42 | $0.68 | $0.82 |
| Average CTR | 3.8% | 1.2% | 2.1% |
| Conversion Rate | 2.8% | 1.4% | 1.9% |
| Average ROAS | 3.4× | 5.1× | 4.8× |
| Average CPA | $50.71 | $48.57 | $43.16 |
CPC by E-commerce Vertical
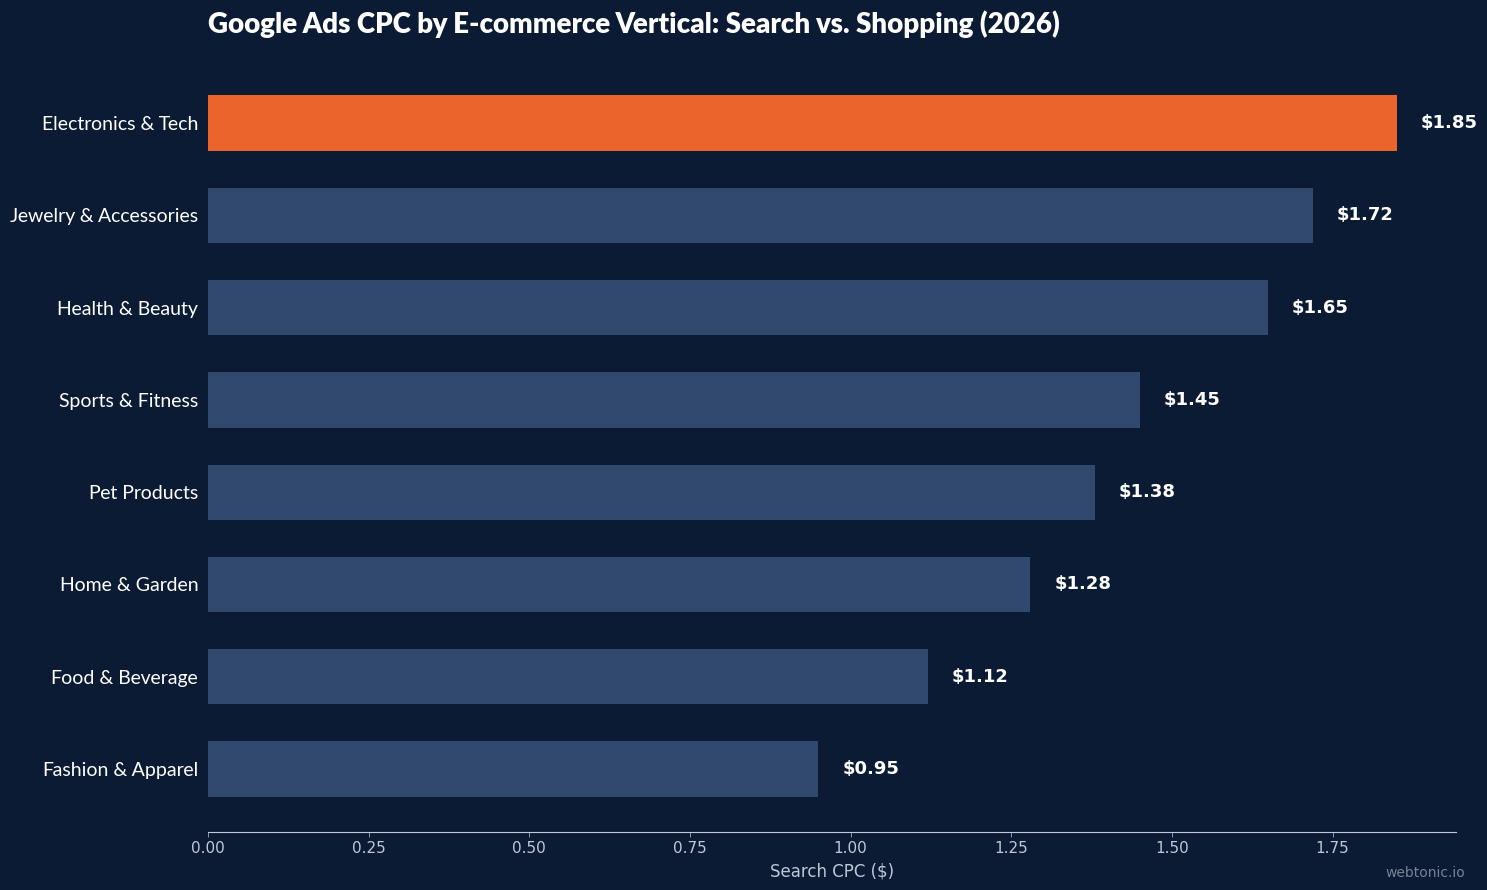
Cost-per-click varies dramatically by product category, reflecting differences in competitive density, margin structure, and purchase intent. The vertical breakdown below — from COREPPC's analysis of 500+ Shopify and DTC accounts — shows where each vertical sits on both Search and Shopping CPCs (COREPPC, 2026).
| Vertical | Avg. Search CPC | Avg. Shopping CPC | YoY Change |
|---|---|---|---|
| Fashion & Apparel | $0.95 | $0.42 | +3% |
| Food & Beverage | $1.12 | $0.52 | +5% |
| Home & Garden | $1.28 | $0.61 | +6% |
| Pet Products | $1.38 | $0.65 | +7% |
| Sports & Fitness | $1.45 | $0.71 | +9% |
| Health & Beauty | $1.65 | $0.78 | +11% |
| Jewelry & Accessories | $1.72 | $0.82 | +8% |
| Electronics & Tech | $1.85 | $0.89 | +14% |
Two patterns stand out. First, Shopping CPCs are consistently 50–55% lower than Search CPCs across every vertical, because Shopping traffic self-qualifies through product images and pricing. Second, CPC inflation is fastest in high-margin categories (Health & Beauty +11%, Electronics +14%), where more advertisers compete for profitable queries.
For Google Ads cost planning, these vertical benchmarks are more useful than cross-industry averages. A fashion brand paying $1.42 CPC on Search is significantly overpaying relative to its vertical ($0.95 average), while an electronics brand at $1.42 is underpaying relative to its ($1.85 average).
ROAS and Conversion Rates by Vertical
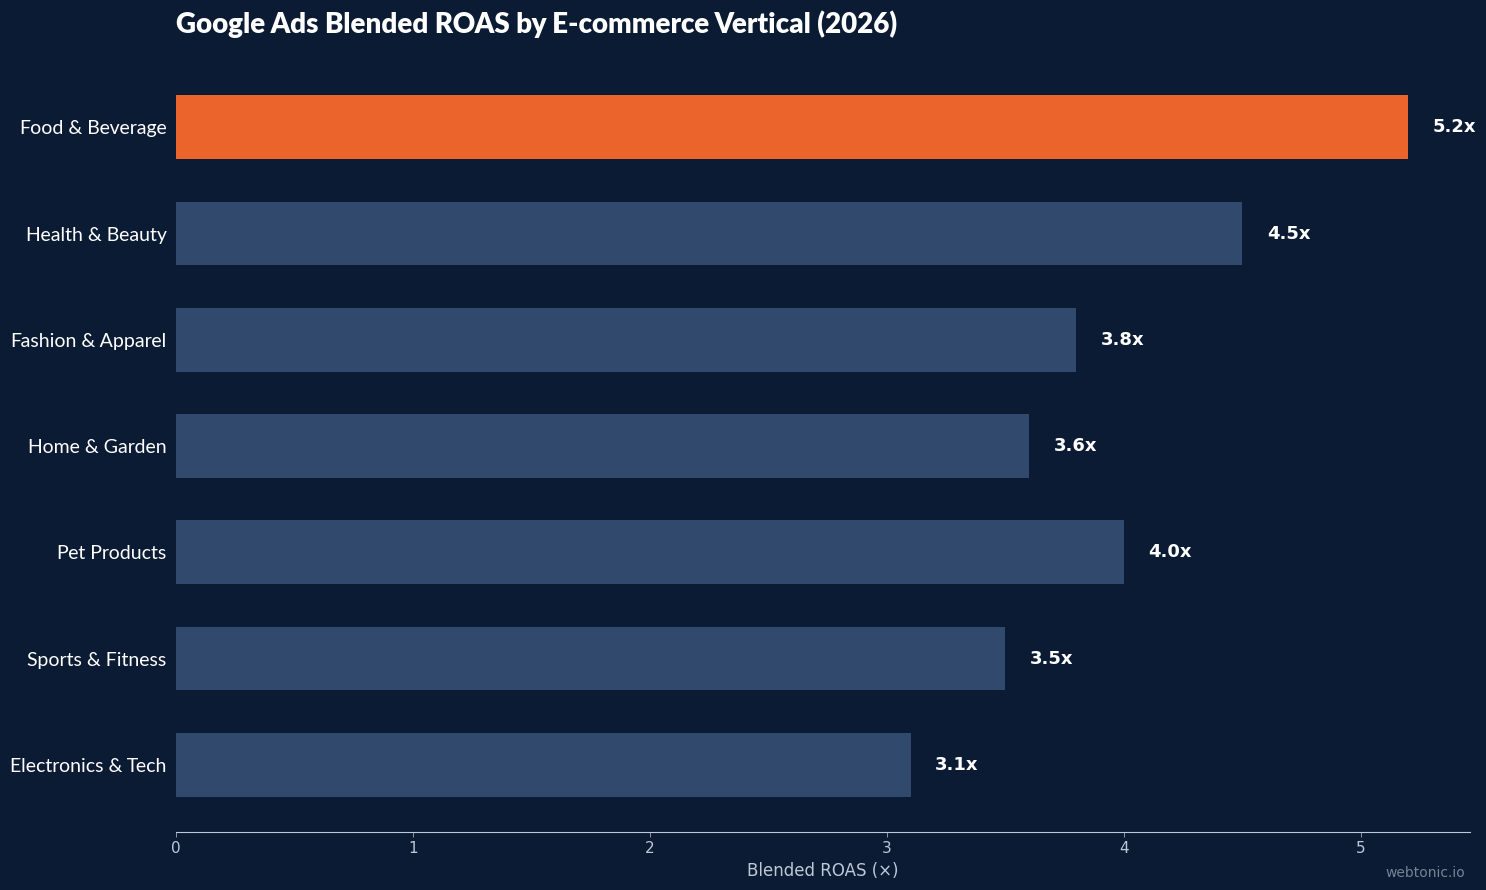
Return on ad spend is the metric that determines whether Google Ads spending generates profit or just revenue. The critical context: a "good" ROAS depends entirely on gross margins. A 4× ROAS is exceptional for a fashion brand with 55–65% margins but barely break-even for an electronics brand at 25–40%.
| Vertical | Avg. Blended ROAS | 75th Percentile | Typical Gross Margin | Breakeven ROAS |
|---|---|---|---|---|
| Food & Beverage | 5.2× | 8.1× | 50–65% | 1.5–2.0× |
| Health & Beauty | 4.5× | 7.2× | 60–75% | 1.3–1.7× |
| Pet Products | 4.0× | 6.0× | 50–60% | 1.7–2.0× |
| Fashion & Apparel | 3.8× | 5.5× | 55–65% | 1.5–1.8× |
| Home & Garden | 3.6× | 5.8× | 45–55% | 1.8–2.2× |
| Sports & Fitness | 3.5× | 5.2× | 45–55% | 1.8–2.2× |
| Electronics & Tech | 3.1× | 4.8× | 25–40% | 2.5–4.0× |
The spread between average and 75th-percentile ROAS is 1.5–3× across verticals, indicating that account optimization can deliver returns well above industry benchmarks. The conversion rate spread tells a similar story: 25th-percentile stores convert at 0.9% on Search while 75th-percentile stores hit 4.5% — a 5× gap within the same channel and campaign type.
Performance Max for E-commerce
Performance Max has become the default campaign type for Shopping-eligible e-commerce spend. With a $0.82 CPC, 1.9% conversion rate, and 4.8× ROAS, PMax sits between pure Search and pure Shopping on most metrics — because it blends both along with Display, YouTube, Gmail, Discover, and Maps inventory (COREPPC, 2026).
The critical insight for e-commerce: PMax's performance is driven primarily by your product feed, not your bidding strategy. Product titles carry approximately 70% of the matching signal PMax uses to decide who sees your ads. Descriptions carry about 20%, with product type and category filling the rest (ZenoX, 2026).
If PMax matches your products to the wrong queries, Smart Bidding reads the low conversion rate as "these products do not convert" and reduces impressions. The account looks like it has a bidding problem — but it has a feed problem. For Google Ads management, regular feed audits and title optimization are the highest-leverage activities for PMax performance.
| Google Campaign Type | % of Google Budget | Median CPC | Median ROAS |
|---|---|---|---|
| Shopping / PMax | 55% | $0.85 | 5.1× |
| Search (branded) | 15% | $0.65 | 8.2× |
| Search (non-branded) | 20% | $1.42 | 3.1× |
| Display / YouTube | 10% | $0.35 | 1.8× |
Search vs. Shopping Campaign Performance
The data is unambiguous: Shopping campaigns deliver the highest ROAS (5.1×) of any Google Ads campaign type for e-commerce. The reason is structural — Shopping ads display the product image, price, and store name directly in search results, meaning every click represents a shopper who has already pre-qualified themselves on price and product appearance.
Search campaigns compensate with the highest CTR at 3.8% because they appear for high-intent keyword queries. Branded Search dominates ROAS at 8.2× but represents demand that largely already exists — it is brand capture, not demand generation.
Non-branded Search at 3.1× ROAS and $1.42 CPC is the true prospecting channel. It delivers new customer acquisition at a premium, but the economics work for most e-commerce verticals when managed alongside Shopping's efficiency. A healthy growth marketing approach allocates 55% of budget to Shopping/PMax, 20% to non-branded Search, 15% to branded Search, and 10% to Display/YouTube for upper-funnel awareness.
Product Feed Optimization Impact
Feed quality is the single most underinvested lever in e-commerce Google Ads. A comprehensive audit of Shopping and PMax campaigns consistently reveals that title rewrites alone can shift 15–25% of impression volume from low-converting queries to high-converting ones (ZenoX, 2026).
The optimization hierarchy for product feeds in 2026 is clear: product title carries ~70% of the signal, product description ~20%, and product type/category the remainder. Custom labels, variant handling, and Google Merchant Center compliance form the supporting infrastructure.
The most effective feed audit starts not with the feed itself, but with the search term report. Export all Shopping and PMax search term data, identify what converts well, what gets clicks without sales, and what traffic is junk. That pattern reveals exactly where titles are attracting the wrong shoppers — and where rewrites will have the most impact.
Budget Allocation and Campaign Structure
How e-commerce brands allocate their Google Ads budgets reveals clear strategic priorities. Shopping and Performance Max campaigns command 55% of total Google Ads spend, reflecting the platform's strength in high-intent product discovery. Non-branded Search takes 20%, branded Search 15%, and Display/YouTube campaigns receive approximately 10% for upper-funnel awareness (COREPPC, 2026).
The budget split between branded and non-branded Search is a strategic decision, not a benchmark to copy. Branded Search delivers 8.2× ROAS at $0.65 CPC, but it primarily captures existing demand — shoppers who already know your brand. Non-branded Search at 3.1× ROAS acquires new customers at a premium. The optimal balance depends on your brand awareness level and growth targets.
For e-commerce brands spending $5,000–$50,000/month on Google Ads, the recommended approach is allocating 55–60% to Shopping/PMax for efficient conversion capture, 20–25% to non-branded Search for customer acquisition, and 15–20% to branded Search plus Display. Brands with strong organic brand presence can compress branded Search to 10% and reinvest in non-branded prospecting. Those prioritizing growth marketing efficiency should monitor the marginal ROAS of each campaign type and shift budget from diminishing-return campaigns to constrained-efficient ones.
Google Ads vs. Meta Ads for E-commerce
E-commerce brands rarely choose between Google and Meta — they allocate between them. The benchmarks reveal complementary strengths. Google Ads captures higher-intent traffic at higher CPCs ($0.68–$1.42) but delivers stronger ROAS (4.2× blended vs. Meta's 3.4×) because shoppers arrive with purchase intent. Meta Ads reaches broader audiences at lower CPMs but requires more creative investment to convert cold traffic.
The median Google Ads CPA is $43–$51 across campaign types, compared to Meta's $32–$38 — but Google's higher AOV typically compensates. Google Shopping captures shoppers actively searching for specific products, while Meta Ads excel at demand creation through visual storytelling and social proof.
For most e-commerce brands, the optimal paid media mix is 42% Google Ads, 28% Meta Ads, 10% TikTok, and 20% other channels. The key is measuring each platform's incrementality — not just its reported ROAS — to identify where additional budget drives genuine new revenue rather than claiming credit for sales that would have occurred anyway.
Related reading
- 36+ Financial Advisory Google Ads Statistics Every Marketer Should Know
- Google Ads for Med Spas: 35+ Cost & Performance Statistics (2026)
- Mortgage Google Ads Statistics: CPC, CPL & Conversion Benchmarks (2026)
- Paid Search services at Web Tonic
FAQ
What is a good ROAS for e-commerce Google Ads?
The average blended ROAS across e-commerce is 4.2×, with Shopping at 5.1× and Search at 3.4× (COREPPC, 2026). However, "good" depends on your margins. A 4× ROAS is excellent for a 60% margin business but barely profitable at 30% margins. The right benchmark is your breakeven ROAS — typically 1.3–2.0× for most e-commerce verticals — and then your target profitability above that threshold.
How much does Google Ads cost for e-commerce?
Average CPCs are $1.42 for Search, $0.68 for Shopping, and $0.82 for Performance Max (COREPPC, 2026). Costs vary by vertical: Fashion & Apparel averages $0.95 on Search while Electronics reaches $1.85. Average CPAs range from $43.16 (PMax) to $50.71 (Search). Budget allocation typically follows a 55% Shopping/PMax, 35% Search, 10% Display/YouTube split.
Is Performance Max better than standard Shopping for e-commerce?
PMax delivers 4.8× ROAS vs. Shopping's 5.1×, but PMax reaches additional channels (Search, YouTube, Display, Gmail). PMax's CPA is lower ($43.16 vs. $48.57) due to broader reach. The feed is PMax's primary matching signal — product titles carry ~70% of the signal weight. Most e-commerce brands now run PMax as their primary Shopping vehicle, with standard Shopping reserved for specific product-level control needs.
What conversion rate should I expect from Google Ads for e-commerce?
Average conversion rates are 2.8% for Search, 1.4% for Shopping, and 1.9% for Performance Max (COREPPC, 2026). But the spread is significant: 25th-percentile stores convert at 0.9% while 75th-percentile stores hit 4.5% on Search. The gap is driven by landing page quality, product-market fit, and bidding strategy — not industry benchmarks.
Why does my Shopping CPC keep increasing?
CPC inflation is structural across e-commerce Google Ads, with year-over-year increases ranging from 3% (Fashion) to 14% (Electronics). The drivers are increasing advertiser competition and Google's auction mechanics. The most effective response is feed optimization — title rewrites can shift impression volume to higher-converting queries — combined with bidding strategy refinement and negative keyword hygiene.
Sources
COREPPC — Google Ads Benchmarks for Ecommerce 2026
ZenoX — Google Shopping Feed Optimization 2026 Guide
27five / Triple Whale — Meta Ads Benchmarks for eCommerce 2026
MHI Growth Engine — Meta Ads Benchmarks Ecommerce 2026
Omnisend — 2026 Ecommerce Marketing Report
Visible Factors — Facebook Ads Benchmarks 2026


