



Table of contents
The e-commerce digital marketing landscape in 2026 is defined by channel fragmentation, rising acquisition costs, and the outsized impact of automation. With the median DTC customer acquisition cost reaching $54 (up 18% in two years) and just 5% of brands generating 57% of total order volume growth, the gap between data-driven operators and everyone else has never been wider.
This report compiles 65+ verified e-commerce digital marketing statistics from platform data, merchant benchmarks, and industry studies to reveal what is actually working — and where the money is going — across every major channel.
Key Takeaways
- Email marketing delivers $36–$42 ROI per dollar spent on average, with top-performing merchants achieving $79 per dollar on automated flows (Omnisend, 2026).
- Google Ads captures 40–45% of e-commerce ad budgets, with a median 4.2× ROAS across Shopping, Search, and PMax campaigns (COREPPC, 2026).
- SMS converts at 11.92% — the highest of any marketing channel — followed by email at 8.43% and ChatGPT-referred traffic at 6.27% (ThoughtMetric, Q3 2025).
- Mobile commerce accounts for 60% of global e-commerce sales, generating $2.4–$2.82 trillion, yet converts at half the rate of desktop (Axis Intelligence, 2026).
- U.S. social commerce crossed $100 billion for the first time, with TikTok Shop alone generating $23.4B in GMV (Digital Applied, 2026).
- The median DTC customer acquisition cost is $54, up 18% from two years prior, with the most expensive channel costing 6× more than the cheapest (GrowthSuite, 2026).
- 23.6% of e-commerce orders come from organic search, making SEO the largest non-paid traffic source for online retailers (SeoProfy, 2025).
| Channel | Conversion Rate | Avg. ROI / ROAS | Budget Share |
|---|---|---|---|
| SMS | 11.92% | High (automated flows) | ~3% |
| 8.43% | $36–$42 per $1 | ~4% | |
| ChatGPT / AI referral | 6.27% | Emerging | <1% |
| Organic search (SEO) | 3.8% | Compounding | ~8% (content) |
| Direct | 3.2% | Brand-driven | N/A |
| Google Ads (Search) | 2.8% | 4.2× ROAS | ~42% |
| Social media (organic) | 1.5% | Brand + retention | ~5% |
| Meta Ads (paid) | 1.8–2.2% | 2.8–3.5× ROAS | ~28% |
E-commerce Market Size and Growth
Global e-commerce now accounts for approximately 20.5% of worldwide retail sales, up from 19.9% in 2024. But context matters: China significantly lifts the global average. Excluding China, global e-commerce penetration sits closer to 12.8%, setting a more realistic benchmark for Western markets (Shopify, 2025).
Latin America leads regional growth at 12.2%+ year-over-year, reaching $191.25 billion. The U.S. market continues to mature, with growth concentrated among the top 5% of brands generating 57% of order volume growth — a winner-take-more dynamic that makes growth marketing strategy critical for mid-market brands (Omnisend, 2026).
Conversion Rates by Marketing Channel
Conversion rate is the metric that separates marketing activity from marketing results. The Q3 2025 benchmark data across 100 e-commerce brands reveals a clear hierarchy (ThoughtMetric, Q3 2025):
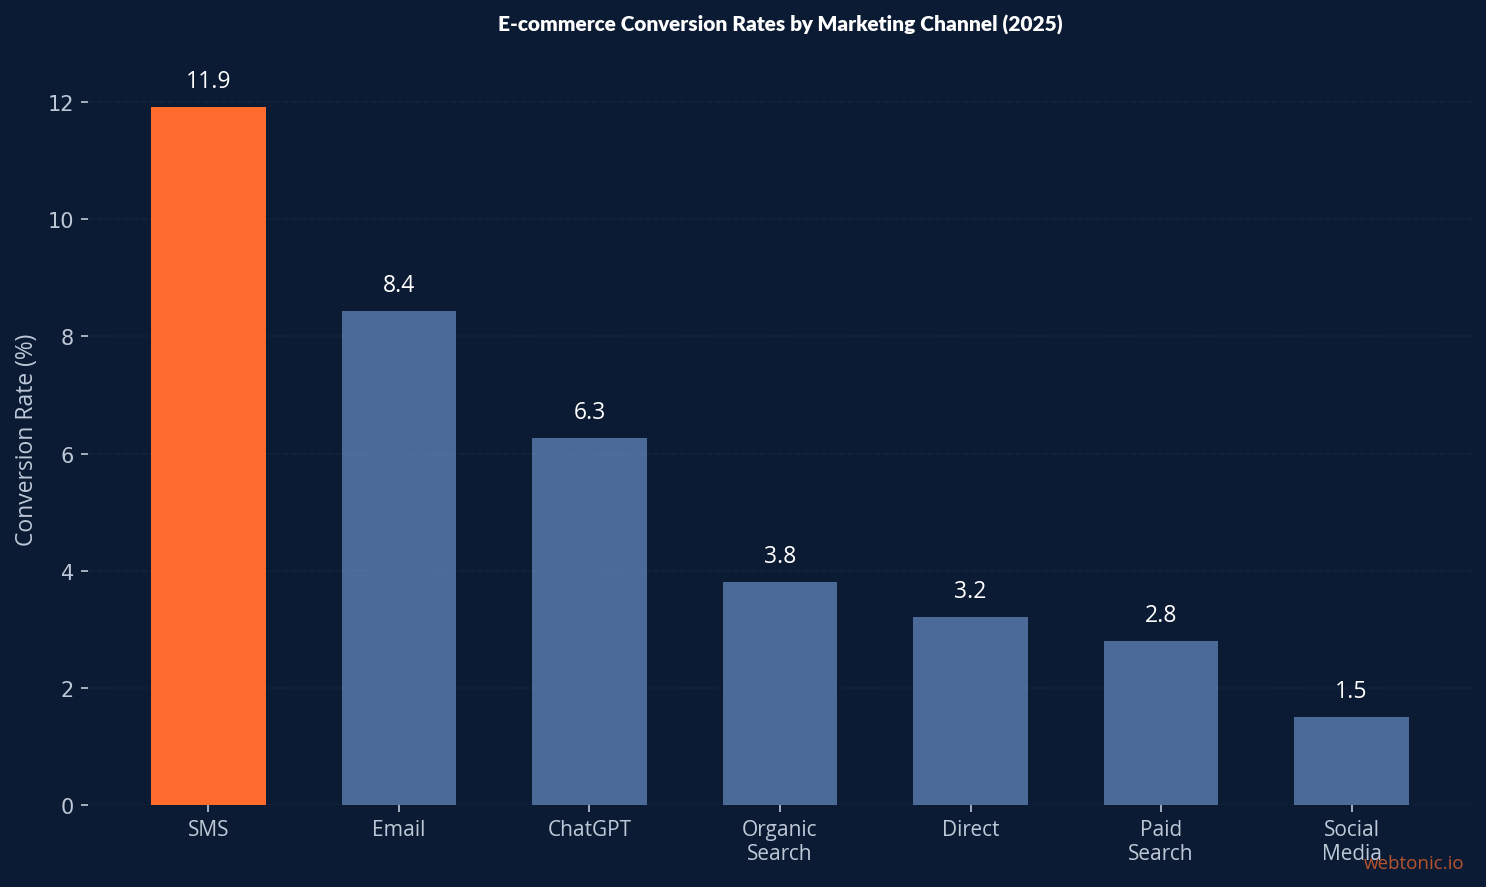
The standout finding is ChatGPT-referred traffic converting at 6.27% — placing AI-assisted discovery third behind only SMS and email. This signals that AI-driven product recommendations are already a meaningful conversion source, not just a novelty.
SMS and email dominate conversion metrics because they reach opted-in, high-intent audiences. The gap between these owned channels and paid acquisition (Google Ads at 2.8%, social at 1.5%) underscores the compounding value of building a first-party data asset.
Ad Spend Allocation and Channel Budgets
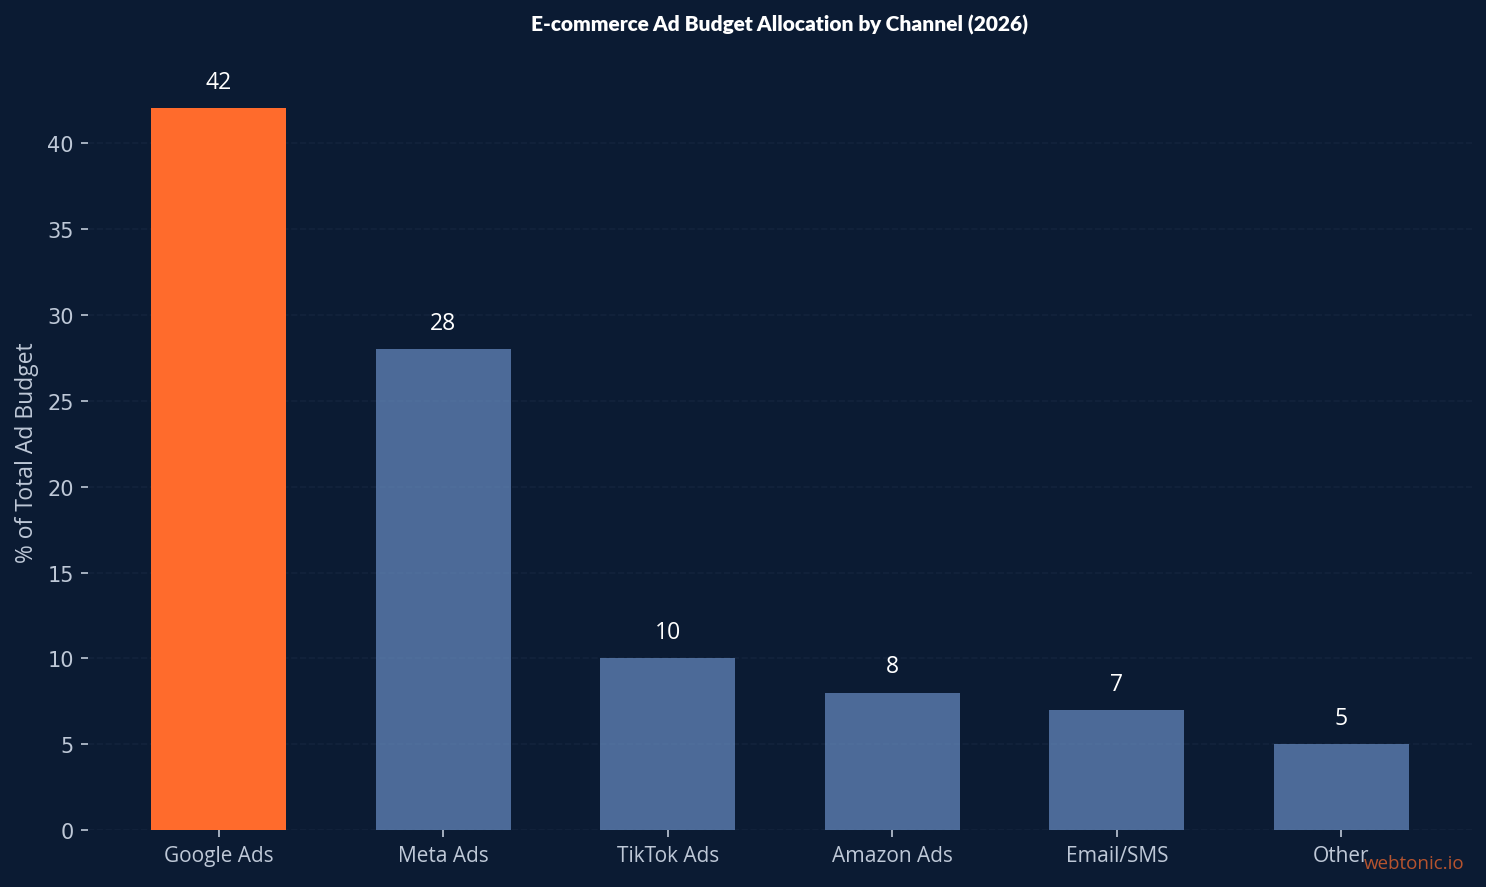
Where e-commerce brands put their ad dollars in 2026 reveals strategic priorities. Google Ads takes the largest share at 40–45% of total paid media budget, split across Shopping, Search, and Performance Max campaigns (COREPPC, 2026).
| Google Campaign Type | % of Google Budget | Median CPC | Median ROAS |
|---|---|---|---|
| Shopping / PMax | 55% | $0.85 | 5.1× |
| Search (branded) | 15% | $0.65 | 8.2× |
| Search (non-branded) | 20% | $1.42 | 3.1× |
| Display / YouTube | 10% | $0.35 | 1.8× |
The overall Google Ads benchmark for e-commerce in 2026: $1.42 CPC, 3.8% CTR, 2.8% conversion rate, and 4.2× ROAS. Shopping and PMax campaigns deliver the highest ROAS at 5.1×, while non-branded search generates volume at a more modest 3.1× (COREPPC, 2026).
Meta Ads captures 25–30% of ad budgets, though Meta CPMs have risen significantly. The most efficient Meta advertisers in e-commerce focus on video creative and broad targeting rather than narrow interest audiences.
Email and SMS Marketing Performance
Email remains the highest-ROI channel in e-commerce, delivering $36–$42 for every dollar spent on average. Merchants using advanced automation platforms average $79 per dollar spent — nearly double the industry benchmark (Omnisend, 2026).
| Email/SMS Metric | Benchmark | Trend |
|---|---|---|
| Email ROI (industry average) | $36–$42 per $1 | Stable |
| Email ROI (top merchants) | $79 per $1 | ↑ Growing |
| Automated email sales share | 37% of email revenue | ↑ Growing |
| Automated email send share | 2% of total sends | Stable |
| Open rates | Rising (5th year) | ↑ Growing |
| Click rates | Declining | ↓ Falling |
| Click-to-conversion | +53% YoY | ↑ Growing |
| SMS conversion rate | 11.92% | Leading all channels |
The most striking finding: automated emails drive 37% of all email-generated sales despite comprising only 2% of total sends. Open rates have risen for the fifth consecutive year, but click rates are declining. The paradox resolves when you see that click-to-conversion jumped 53% year-over-year — fewer people click, but those who do are far more likely to buy (Omnisend, 2026).
Mobile Commerce and Cross-Device Behavior
Mobile commerce accounts for approximately 60% of global e-commerce sales, generating between $2.4 and $2.82 trillion in revenue. Mobile devices drive 78% of all retail website traffic — but convert at roughly half the rate of desktop (Axis Intelligence, 2026).
That gap between traffic dominance and conversion underperformance is the central structural problem of mobile commerce, worth an estimated $280 billion in annually recoverable revenue. The primary friction points remain page speed (mobile sites averaging 2–3× slower loads), complex checkout flows, and payment method availability.
For performance creative teams, this means mobile-first design isn't just good practice — it is the single largest conversion opportunity in e-commerce.
Social Commerce and Platform Shopping
U.S. social commerce crossed $100 billion for the first time in 2026. The clearest data story belongs to TikTok Shop, with $23.4 billion in GMV. Instagram's contribution remains harder to quantify — third-party estimates for the same metric span $8.7 billion to $37.7 billion, reflecting Meta's opacity around shopping-specific revenue (Digital Applied, 2026).
| Platform | Estimated GMV (2026) | Key Strength |
|---|---|---|
| TikTok Shop | $23.4B | Discovery-driven impulse purchases |
| Instagram Shopping | $8.7–$37.7B | Visual product discovery, DTC brands |
| Facebook Marketplace | $18B+ | Local commerce, used goods |
| YouTube Shopping | $3.2B+ | Creator-driven product reviews |
| Pinterest Shopping | $2.1B+ | Inspiration-to-purchase journey |
Short-form videos are the most popular content format for e-commerce marketing, delivering the highest ROI. Brands implementing storytelling techniques can increase content value by up to 2,706% — a staggering multiplier that reflects how narrative-driven content outperforms product-focused posts (SeoProfy, 2025).
Customer Acquisition Cost by Channel
The median DTC brand spent $54 to acquire a single customer in 2025, up 18% from two years earlier. But the spread between channels is dramatic — the most expensive channel costs 6× more per customer than the cheapest (GrowthSuite, 2026).
| Channel | Median CAC | Trend (vs. 2023) |
|---|---|---|
| Meta Ads | $70–$85 | ↑ Up 25–30% |
| Google Ads | $45–$65 | ↑ Up 15–20% |
| TikTok Ads | $30–$50 | → Stabilizing |
| Influencer / creator | $25–$45 | → Stable |
| Email / SMS | $8–$15 | ↓ Down (automation) |
| Organic / SEO | $15–$25 | → Stable |
| Referral / affiliate | $20–$35 | → Stable |
Meta Ads CAC has increased 25–30% since 2023, driven by iOS privacy changes and rising competition. Email and SMS remain the most cost-efficient acquisition channels, reinforcing the importance of first-party data strategies. 23.6% of e-commerce orders come from organic search, making SEO the largest non-paid driver of sales (SeoProfy, 2025).
Content Marketing Strategy for E-commerce
A strong content marketing strategy is the foundation of sustainable e-commerce growth. According to Statista, 70% of online marketers consider content marketing their most effective long-term strategy for driving organic traffic, with 23.6% of e-commerce orders originating from organic search in the United States.
The digital marketing statistics confirm that video content outperforms every other content format for e-commerce brands. Short-form videos on popular social media platforms (TikTok, Instagram Reels, YouTube Shorts) deliver the highest engagement and conversion rates, while long-form video content (product reviews, tutorials, unboxings) drives higher average order values from users who invest time watching before purchasing.
Marketers implementing a content marketing strategy that combines SEO-optimized blog content, video content, and social media content see 3× higher traffic growth than those relying solely on paid advertising. In the United States and Australia, e-commerce brands that invest at least 15% of their marketing budget in content marketing report 45% lower customer acquisition costs over 12 months compared to paid-only strategies.
Search engine optimization remains critical to content marketing success. E-commerce marketers who optimize product descriptions, category pages, and blog content for search engine discovery capture users throughout the buying journey — from early research ("best running shoes for flat feet") to purchase-ready queries ("Nike Pegasus 41 price").
PPC and Paid Search Statistics for Online Retailers
PPC (pay-per-click) advertising remains the fastest path to revenue for online retailers, but costs are rising across every major platform. According to eMarketer, total U.S. digital ad spending for e-commerce exceeded $85 billion in 2025, with Google Ads and Amazon Advertising capturing the largest shares.
Key PPC digital marketing statistics for e-commerce marketers in 2026:
- Google Shopping / PMax campaigns deliver 5.1× ROAS — the highest return among paid channels for online retailers.
- Amazon Advertising CPC averages $0.95–$1.20 for sponsored products, with conversion rates of 9.5% — significantly higher than other PPC platforms due to purchase-intent traffic.
- 75% of online users say paid search ads make it easier to find products, validating the role of PPC in the e-commerce discovery journey (SeoProfy).
- Mobile PPC clicks now represent 65%+ of all paid search clicks for e-commerce, requiring mobile-optimized landing pages and streamlined checkout flows.
In the U.S. market, the most sophisticated e-commerce marketers deploy a full-funnel digital marketing strategy combining SEO for organic discovery, PPC for high-intent capture, and paid social media for awareness and retargeting. Statista projects that e-commerce ad spending in the United States will grow another 12% in 2026, with mobile ad formats capturing the majority of incremental spend.
Mobile Commerce Statistics and User Behavior
Mobile commerce statistics reveal the most significant structural shift in online retail. With 78% of all retail website traffic coming from mobile devices, e-commerce marketers can no longer treat mobile optimization as secondary — it is the primary experience for most users.
Key mobile digital marketing statistics for online retailers:
- Mobile conversion rates average 2.1% compared to 4.3% on desktop — the "mobile gap" represents $280 billion in recoverable annual revenue globally.
- Mobile app users convert 3× higher than mobile web users, driving brands like Amazon and Shein to invest heavily in app-first strategies.
- Page load speed directly impacts mobile conversions — each additional second of load time reduces conversion rates by 7% for mobile users.
- Mobile payment adoption (Apple Pay, Google Pay, Shop Pay) reduces checkout friction and increases mobile conversion rates by 12–18% for online retailers.
According to recent statistics, mobile search drives 65% of all e-commerce paid search clicks, yet many online retailers still serve desktop-optimized landing pages to mobile users. Marketers who implement mobile-first landing pages with streamlined checkout and one-tap payment options report significantly higher return on ad spend from mobile campaigns.
The statistics also show that mobile users engage differently with content marketing than desktop users — they consume shorter-form video content, scroll faster through product listings, and rely more heavily on visual content and reviews. Smart e-commerce marketers adapt their content marketing strategy accordingly, creating mobile-native formats that match how users actually browse and buy on smaller screens.
What Marketers Report About E-commerce Strategy Effectiveness
Survey data from leading research firms including eMarketer and Statista reveal how digital marketers assess the effectiveness of different e-commerce marketing strategies in 2026:
- 72% of e-commerce marketers report that email marketing delivers their most predictable ROI, making it the backbone of their marketing strategy.
- 68% of marketers say that popular social media platforms (Instagram, TikTok, Facebook) are their primary source of new customer discovery for online brands.
- 61% of marketers increased their investment in video content creation for 2026, with short-form video being the fastest-growing content format.
- 58% of digital marketers now report using AI tools to optimize ad copy, audience targeting, and bid strategies across PPC and paid social media campaigns.
- 54% of e-commerce marketers say their search engine optimization strategy delivers better 12-month ROI than any paid channel.
These digital marketing statistics paint a clear picture: the most successful online retailers use a diversified marketing strategy that balances owned channels (email, SMS, content), earned channels (SEO, organic social), and paid channels (Google Ads, paid social media, Amazon ads). The statistics consistently show that brands over-relying on any single paid acquisition channel face unsustainable cost inflation and diminishing returns.
For e-commerce brands targeting the United States market specifically, the data shows that users increasingly expect omnichannel experiences — they discover products on social media, research on search engines, compare on marketplaces like Amazon, and purchase wherever the experience is fastest. Marketers who unify their digital marketing statistics tracking across all these touchpoints report 30–40% better attribution accuracy and more effective budget allocation.
Regional E-commerce Digital Marketing Trends
Digital marketing statistics vary significantly by region, and e-commerce marketers must adapt strategies accordingly. In the United States, e-commerce penetration sits at approximately 16.4% of total retail — below the global 20.5% average that China's massive online market inflates.
Australia represents one of the fastest-growing e-commerce markets in the Asia-Pacific region, with online retail growing 11% year-over-year and mobile commerce adoption accelerating among younger users. Australian e-commerce marketers report that Google Ads and SEO remain the primary acquisition channels, though TikTok adoption is growing faster than in the U.S. market.
Across all regions, the digital marketing statistics point to the same trend: e-commerce marketers are diversifying channel mixes while consolidating around the platforms that deliver measurable ROI. The most successful online retailers use marketing strategy frameworks that balance customer acquisition with retention — because the statistics show that repeat customers generate 3–5× more revenue per customer than first-time buyers.
Related reading
- What E-Commerce Marketers Should Budget for ABM Campaigns
- Countertops Digital Marketing Statistics: The Complete 2026 Report
- The Definitive Guide to Disaster Restoration Digital Marketing Statistics (2026)
- Marketing Strategy Consulting services at Web Tonic
FAQ
What is the average e-commerce conversion rate in 2026?
The average e-commerce conversion rate varies by channel: SMS leads at 11.92%, email at 8.43%, and ChatGPT-referred traffic at 6.27%. Google Ads converts at 2.8% on average. Organic search converts at approximately 3.8%, making it one of the most balanced channels for both volume and quality.
How much do e-commerce brands spend on digital marketing?
The median e-commerce brand allocates 40–45% of its paid media budget to Google Ads, 25–30% to Meta Ads, and the remainder across TikTok, Amazon, email/SMS, and other channels. The median DTC customer acquisition cost is $54, up 18% from two years prior.
Which digital marketing channel has the highest ROI for e-commerce?
Email marketing delivers the highest ROI at $36–$42 per dollar spent on average, with top-performing merchants achieving $79 per dollar. Automated email sequences drive 37% of all email-generated sales despite comprising only 2% of total sends.
How big is the global e-commerce market in 2026?
Global e-commerce accounts for approximately 20.5% of worldwide retail sales in 2026. Mobile commerce specifically generates $2.4–$2.82 trillion, representing about 60% of all e-commerce sales globally.
Is social commerce growing for e-commerce brands?
Yes — U.S. social commerce crossed $100 billion for the first time in 2026. TikTok Shop alone generated $23.4 billion in GMV. Social commerce is the fastest-growing acquisition channel for DTC and e-commerce brands.
Sources
https://www.omnisend.com/resources/reports/2026-ecommerce-marketing-report/
https://coreppc.com/blog/ecommerce-ad-spend-benchmarks-2026/
https://thoughtmetric.io/blog/e-commerce-conversion-rate-benchmarks-q3-2025
https://axis-intelligence.com/mobile-commerce-statistics/
https://www.omnisend.com/blog/email-marketing-roi/
https://www.digitalapplied.com/blog/social-commerce-statistics-2026-data-points
https://seoprofy.com/blog/ecommerce-marketing-statistics/
https://coreppc.com/blog/google-ads-benchmarks-ecommerce-2026/
https://www.shopify.com/enterprise/blog/global-ecommerce-statistics
https://www.growthsuite.net/blog/customer-acquisition-cost-by-channel-where-dtc-brands-are-overspending-in-2026


